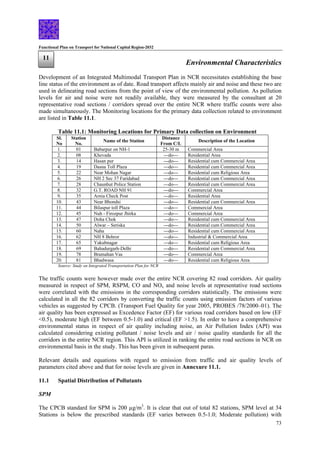
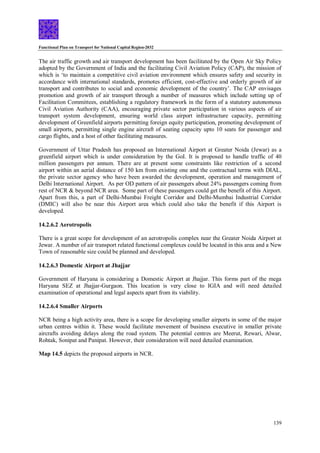
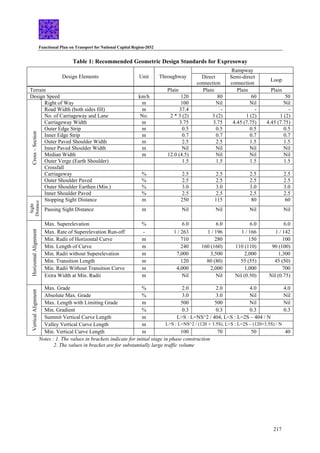
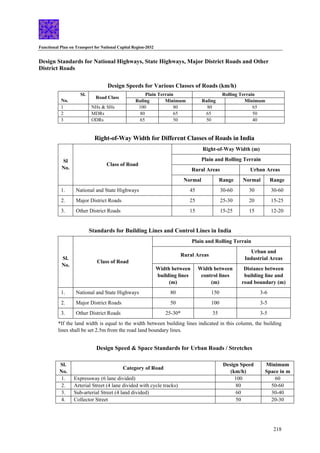
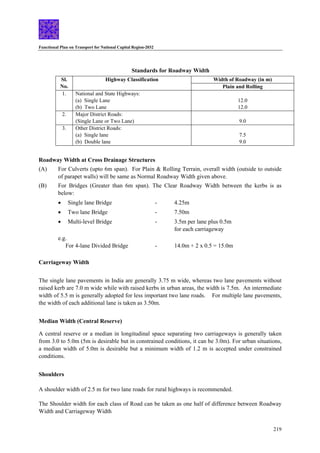
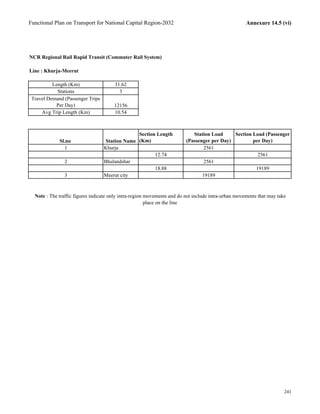
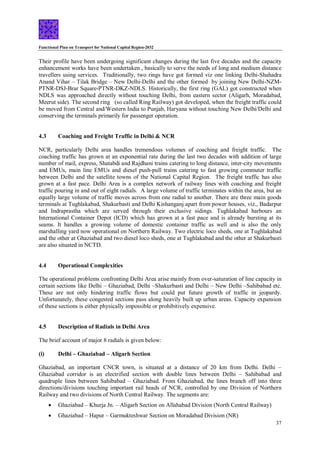
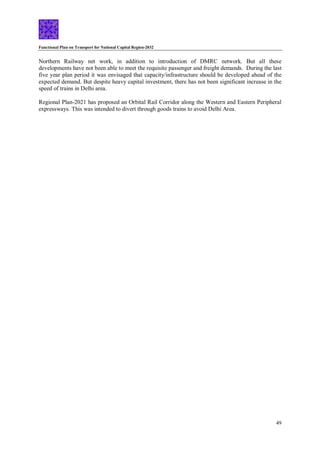
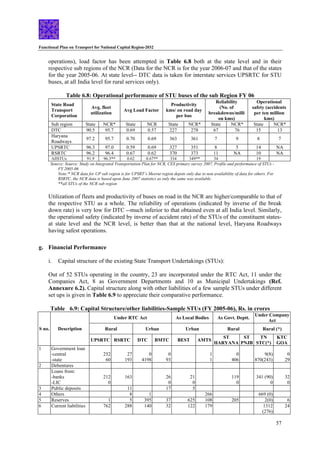
This document provides a summary of the Functional Plan on Transport for the National Capital Region (NCR) 2032. Some key points:
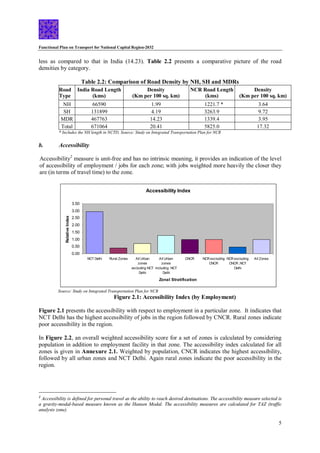
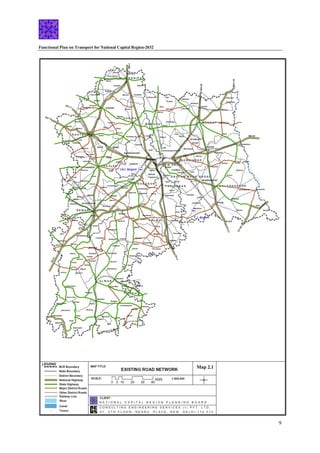
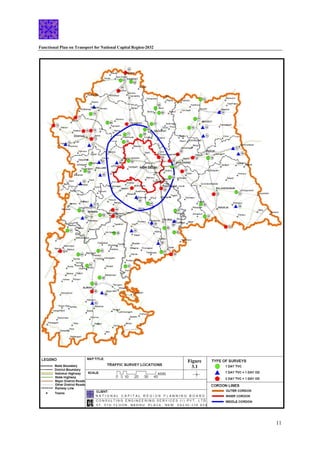
- It analyzes the existing road, rail, bus, and air transport networks in NCR and identifies issues like congestion.
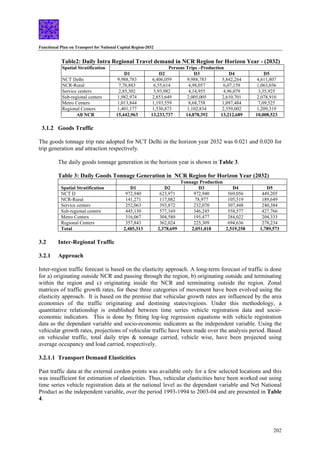
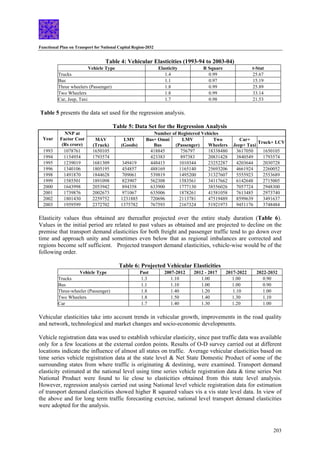
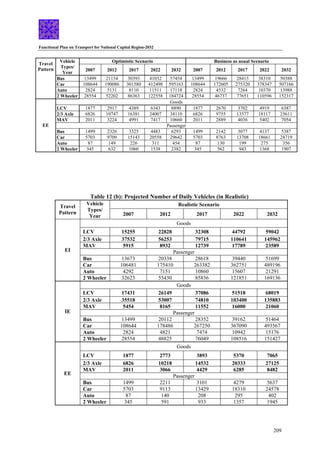
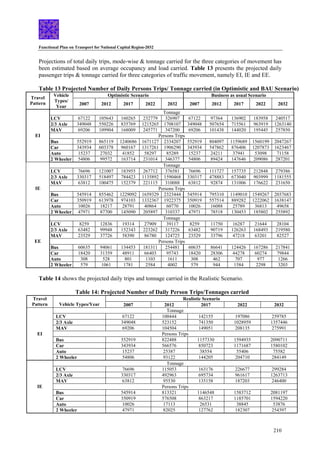
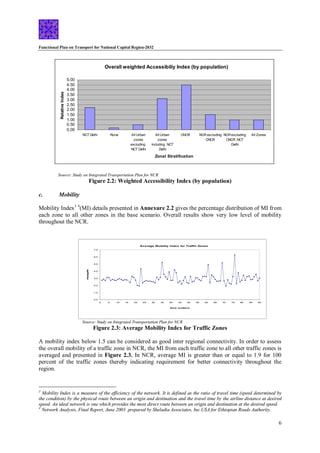
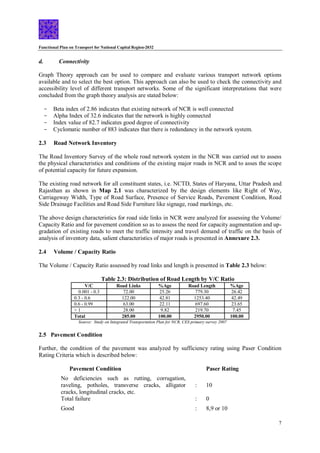
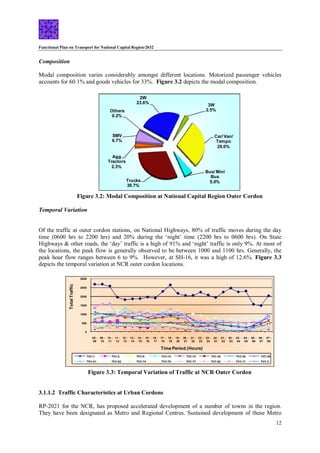
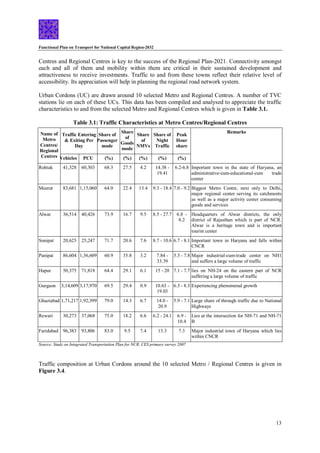
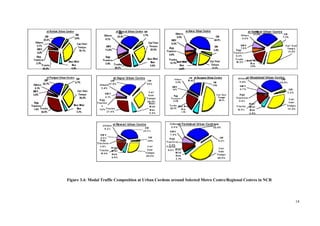
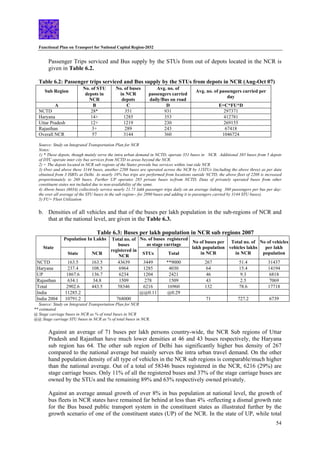
- Traffic surveys show increasing traffic volumes and a shift towards private vehicles over time. Rail commuter traffic is also growing.
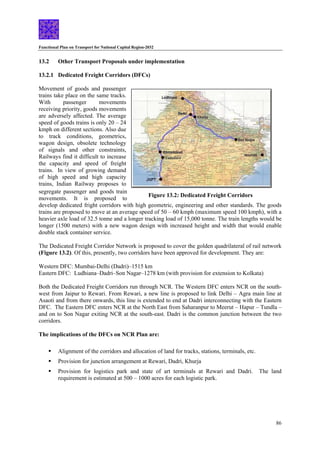
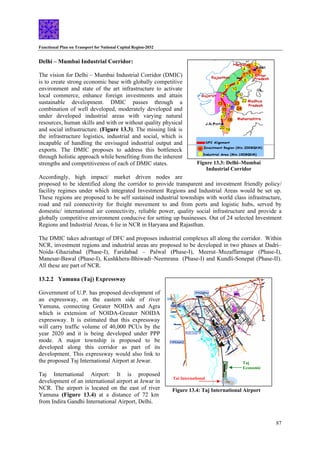
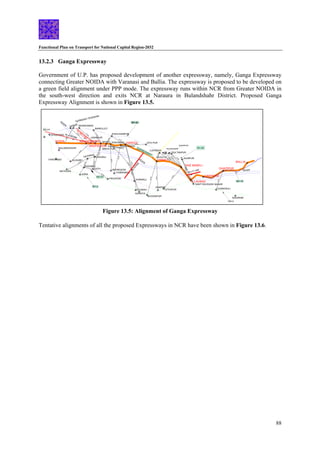
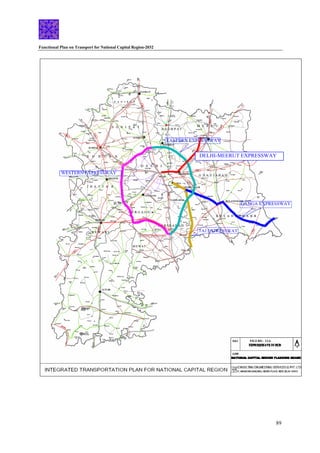
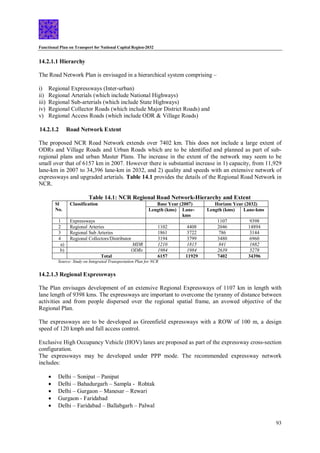
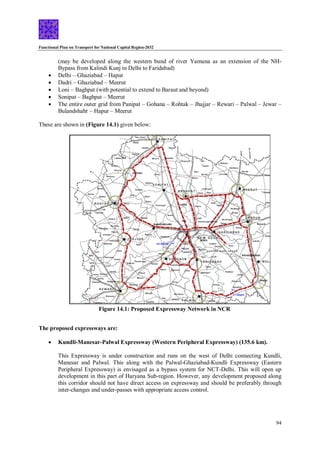
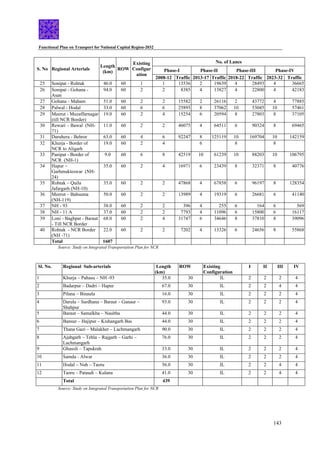
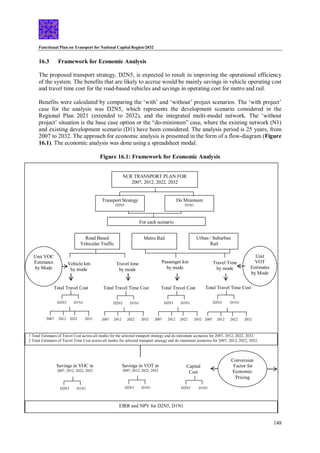
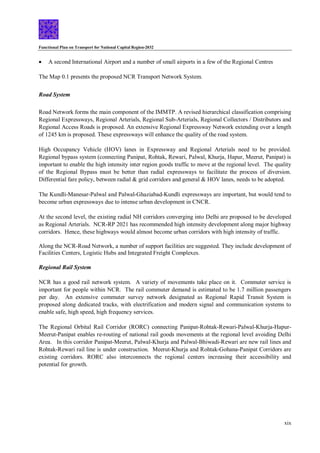
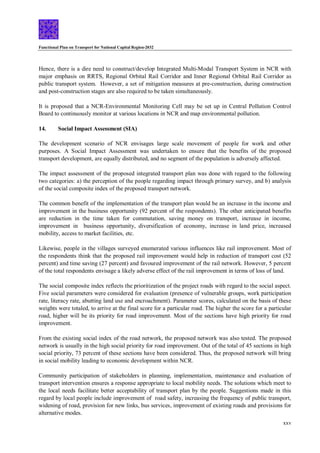
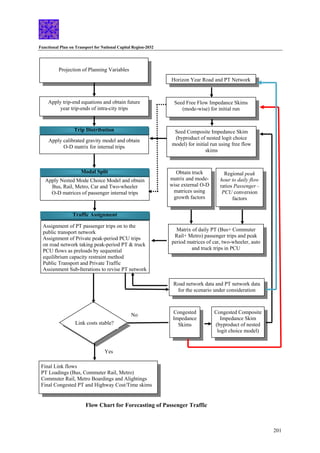
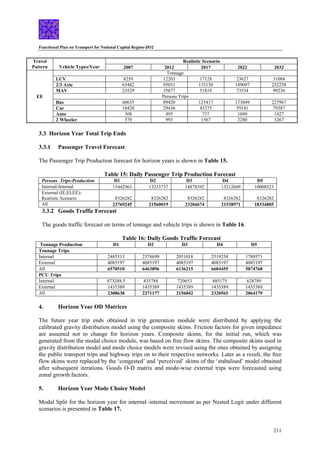
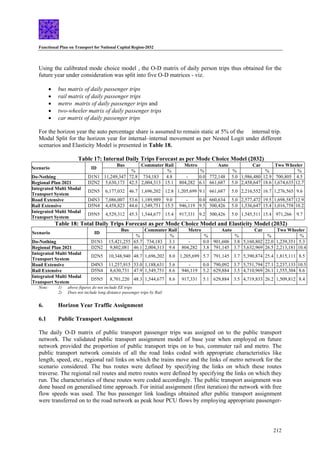
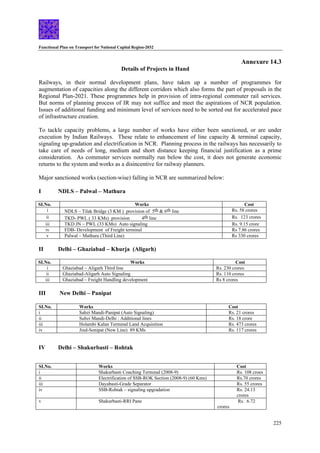
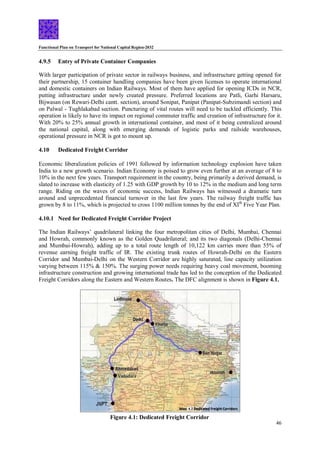
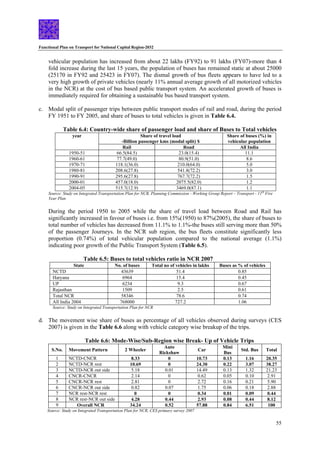
- An integrated multi-modal transport plan is proposed to address future travel demand. This includes expanding the road network through new expressways and arterial roads.
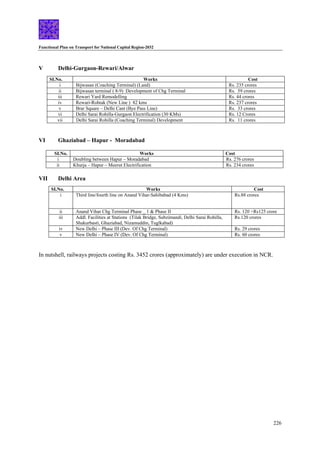
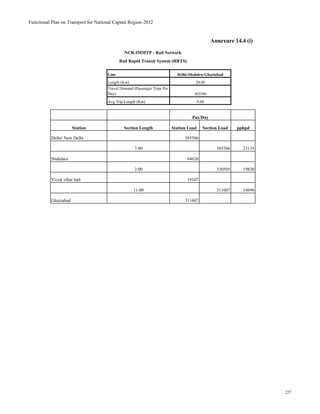
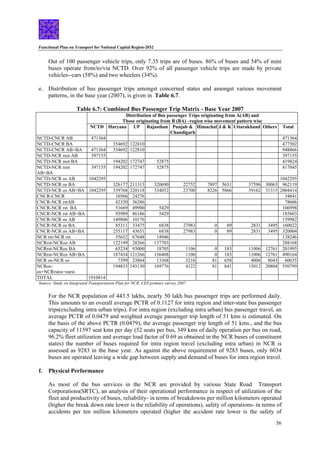
- Railway network improvements like dedicated freight corridors are discussed. Metro and bus services will be expanded to new areas.
- Transport infrastructure like bus terminals will
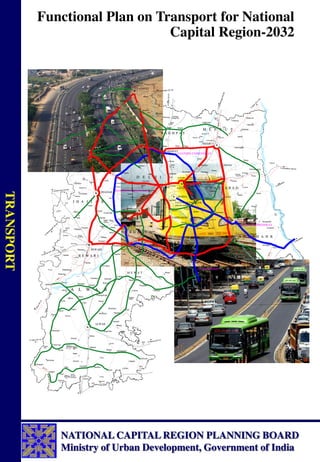


![Functional Plan on Transport for National Capital Region-2032
62
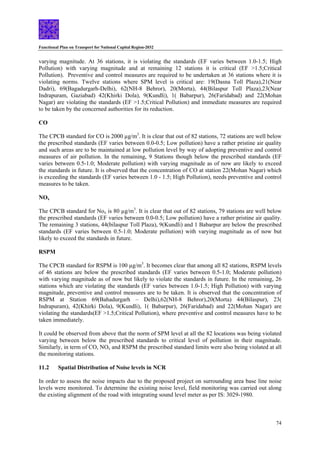
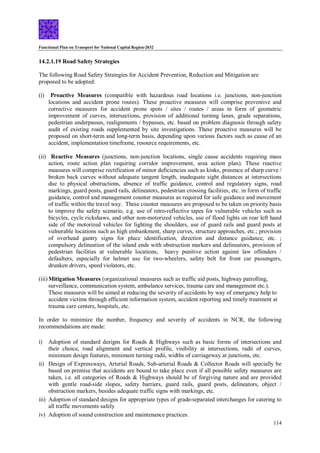
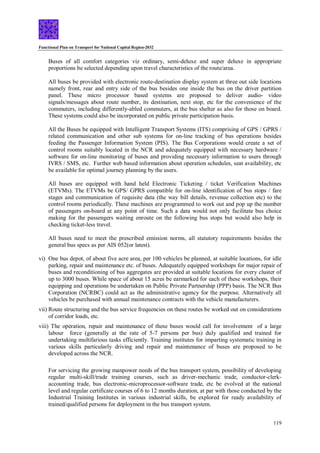
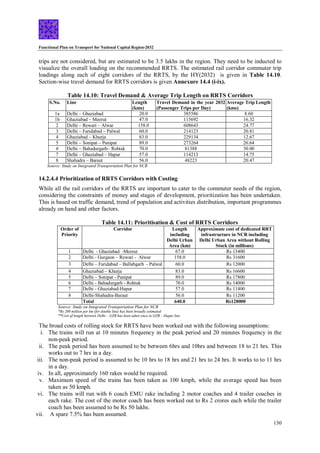
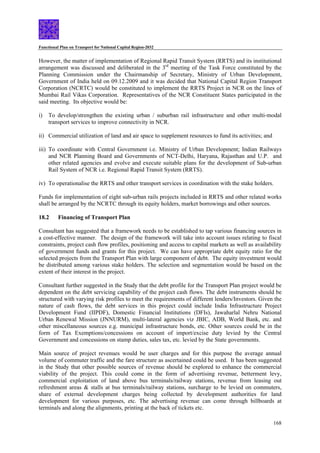
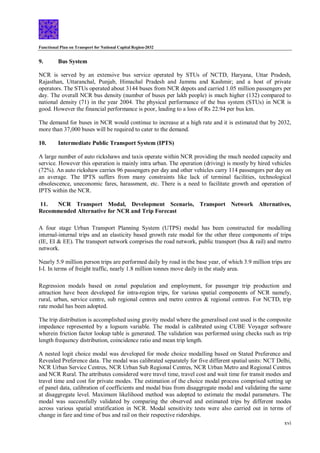
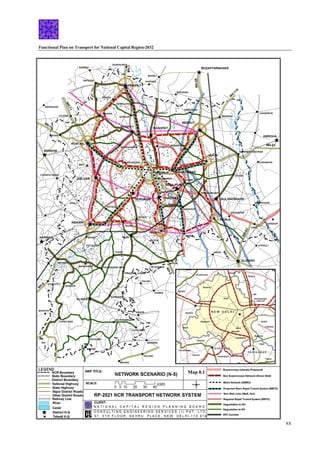
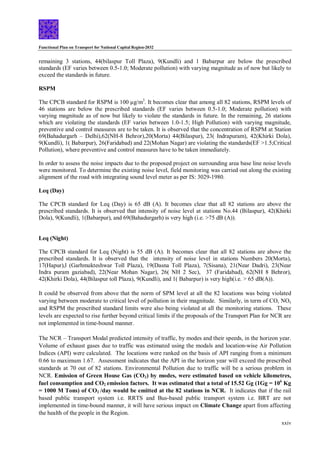
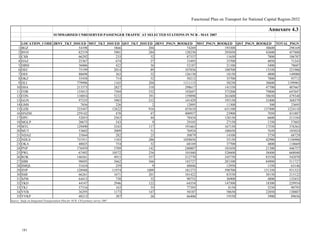
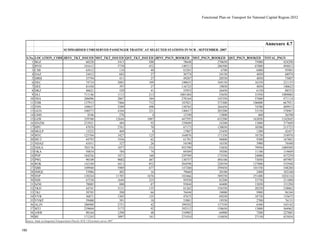
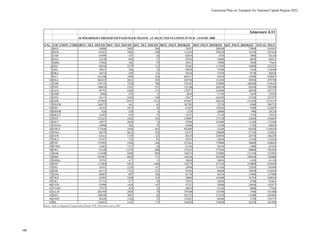
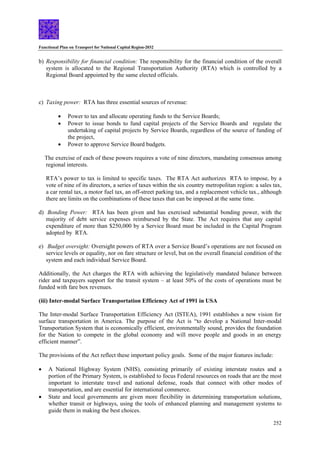
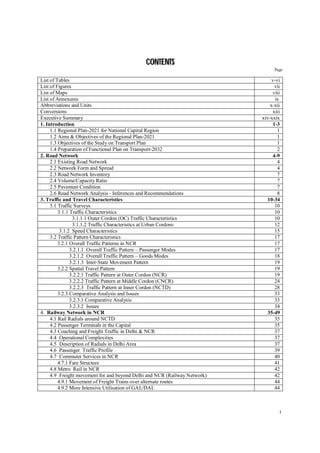
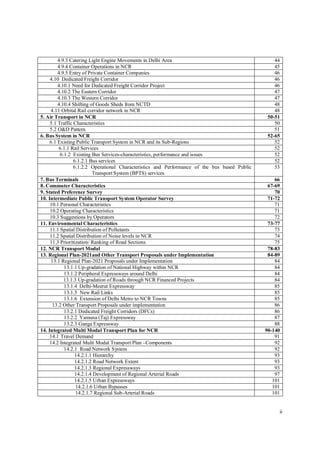
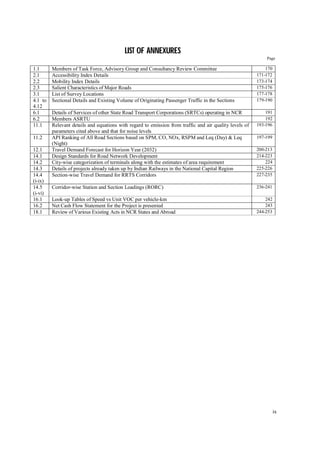
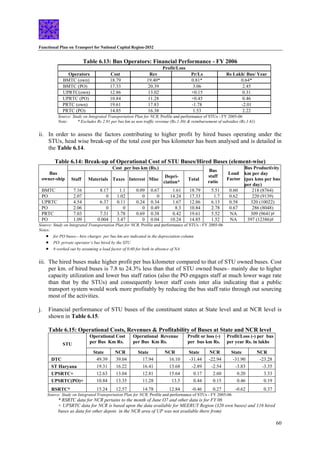
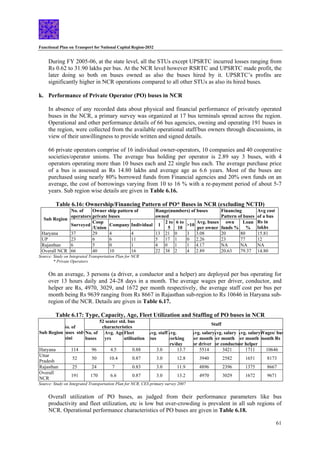
Table 6.18: Operational Performance Characteristics of PO buses (Standard 52 Seater) in NCR
Sub Region
No. of
buses
Fleet
Utilisation
vehicle
(on road)
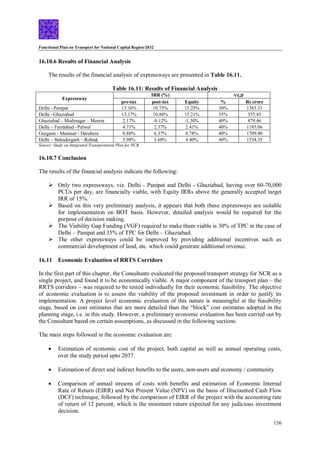
utilisation
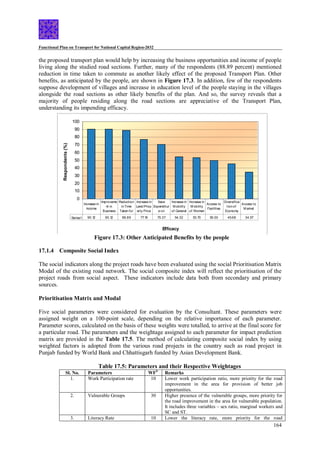
kms/day
Avg.
load
factor
avg.no. of
pax carried
daily/
bus
avg.no. of
pax carried
per trip/bus
Avg. no.
of trips
/bus /day
average
bus trip
length
km
Haryana 96 0.88 247 0.89 323 46 6.96 35.7
Uttar Pradesh 50 0.87 185 0.87 199 45 4.40 42.1
Rajasthan 24 0.83 306 0.82 143 43 3.33 91.7
Overall NCR 170 0.87 237 0.88 260 46 5.69 41.8
Source: Study on Integrated Transportation Plan for NCR, CES primary survey 2007
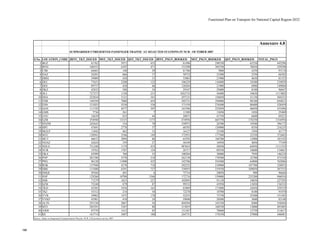
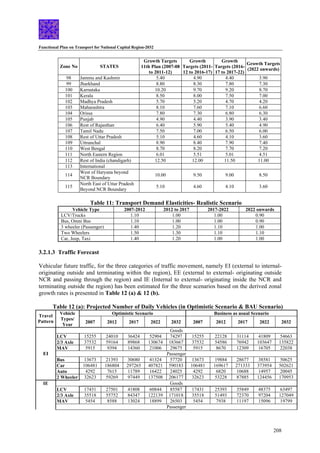
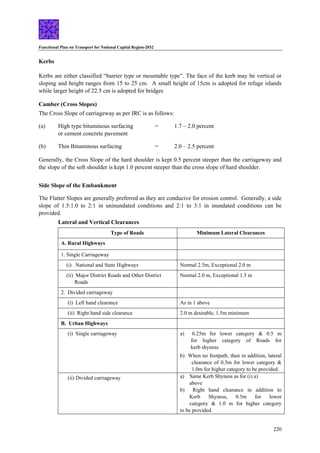
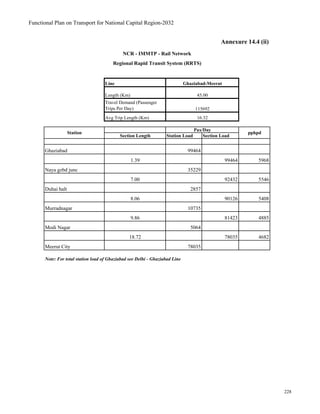
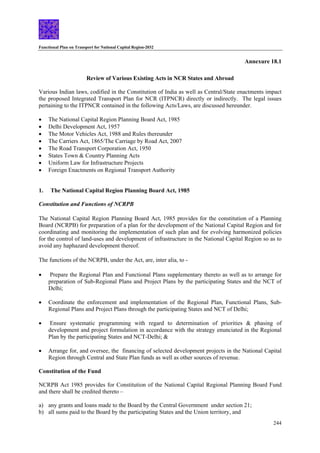
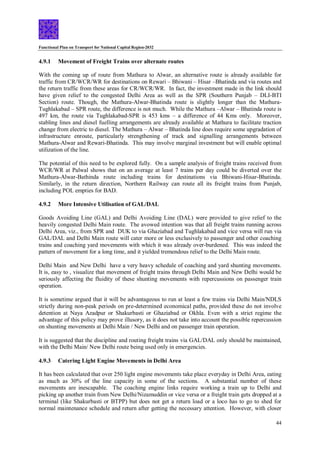
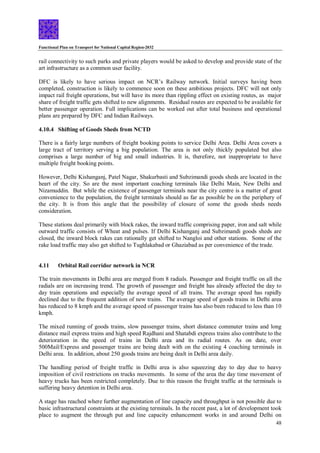
Comparing the operational performance of private operators’ buses with that of the State
Transport Undertaking (STU) buses in the sub region (ref. Table 6.18 & 6.19), PO Buses have:
- lower fleet utilization by about 5%
- significantly (31%) lower vehicle utilization (kms operated per bus on road per day)
- over crowding [avg. load factor significantly (38%) higher]
- low journey speeds (buses operating on an average 237 kms/bus/day in 13.2 hours
perhaps by resorting to trip missing and over staying at bus stops vis a vis 342 kms by
STU buses)
- 4% less passenger kms served daily per bus.
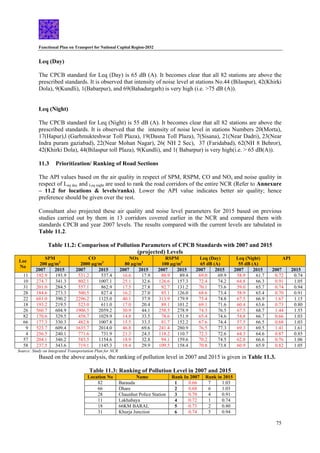
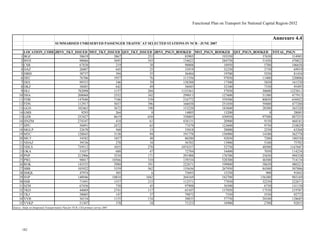
Table 6.19: Comparison of Operational performance characteristics of Private and STU buses in NCR
Sub
Region
No. of buses Fleet Utilisation Avg. vehicle(on road)
utilisation kms/day
Avg. load factor Avg. no. of Pass.
carried daily/bus
Pvt STU
NCR
STU
State
Pvt. STU
NCR
STU
State
Pvt. STU
NCR
STU
State
Pvt. STU
NCR
STU
State
Pvt. STU
NCR
STU
State
Haryana 96 1285 3223 0.88 0.92 0.97 247 362 363 0.89 0.7 0.70 323 333
351
Uttar
Pradesh
50 1219 5976 0.87 0.92 0.96 185 321 334 0.87 0.57 0.67 199 214 156
Rajasthan 24 289 4373 0.83 0.97 0.96 306 337 370 0.82 0.62 0.67 143 240 146
Overall
NCR
170 2793 13572 0.87 0.93 0.96 237 342 352 0.88 0.63 0.68 260 271 199
Source: Study on Integrated Transportation Plan for NCR, Profile and performance of STUs - FY 2005-06
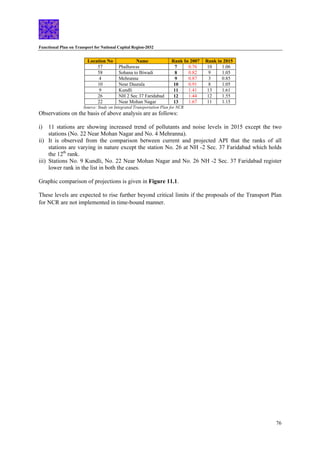
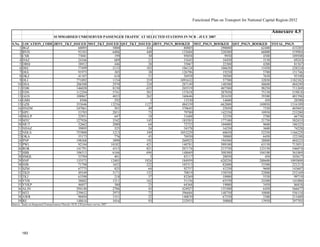
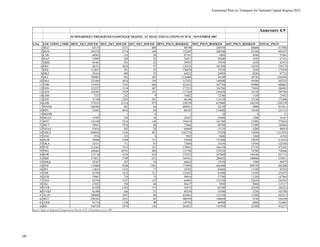
Table 6.20: Profit / Loss (-) per bus per year (Standard buses) - Private operators' and STU buses
No. of buses Total cost per bus per yr
Rs in lacs
Total rev. per bus per yr Rs
in lacs
Profit/Loss per bus per yr
Rs in lacs
Sub Region
Private STU
NCR
STU
State
Private STU
NCR
STU State Private STU
NCR
STU
State
Private STU
NCR
STU
State
Haryana 96 1285 3223 14.83 22.26 24.96 19.21 18.28 21.12 4.38 -3.98 -3.84
Uttar
Pradesh
50 1219 5976 11.55 14.47 18.66 14.71 16.75 15.86 3.16 2.28 -2.8
Rajasthan 24 289 4373 16.11 20.19 19.89 21 19.75 19.39 4.89 -0.44 -0.5
Overall
NCR
170 2793 13572 14.04 18.56 20.55 18.11 17.76 18.24 4.07 -0.8 -2.31
Study on Integrated Transportation Plan for NCR, Profile and performance of STUs - FY 2005-06
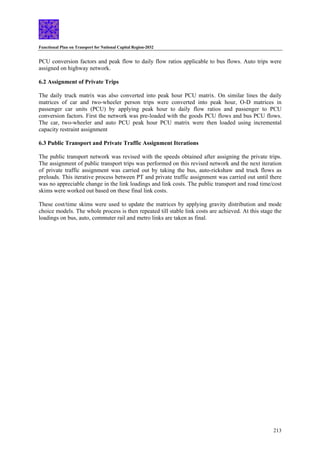
On the financial performance comparisons with STU buses (refer Table 6.20), the PO buses have:
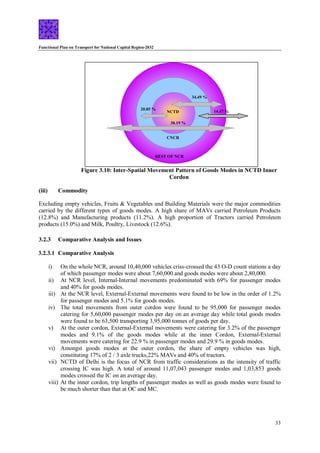
• 27% higher cost per bus km on account of lower bus productivity](https://image.slidesharecdn.com/fpontransportforncr-231114051057-e8b4ee27/85/FP-on-Transport-for-NCR-pdf-77-320.jpg)