National Rail Plan– India
M i n i s t r y o f R a i l w a y s
GovernmentofIndia
1
2.
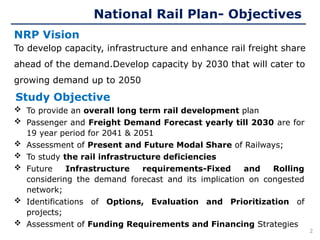
Study Objective
To developcapacity, infrastructure and enhance rail freight share
ahead of the demand.Develop capacity by 2030 that will cater to
growing demand up to 2050
NRP Vision
National Rail Plan- Objectives
To provide an overall long term rail development plan
Passenger and Freight Demand Forecast yearly till 2030 are for
19 year period for 2041 & 2051
Assessment of Present and Future Modal Share of Railways;
To study the rail infrastructure deficiencies
Future Infrastructure requirements-Fixed and Rolling
considering the demand forecast and its implication on congested
network;
Identifications of Options, Evaluation and Prioritization of
projects;
Assessment of Funding Requirements and Financing Strategies
2
3.
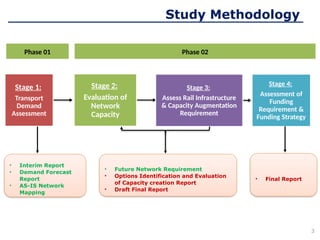
Stage 1:
Transport
Demand
Assessment
Stage 2:
Evaluationof
Network
Capacity
Stage 3:
Assess Rail Infrastructure
& Capacity Augmentation
Requirement
Stage 4:
Assessment of
Funding
Requirement &
Funding Strategy
Study Methodology
Phase 01 Phase 02
• Interim Report
• Demand Forecast
Report
• AS-IS Network
Mapping
• Future Network Requirement
• Options Identification and Evaluation
of Capacity creation Report
• Draft Final Report
• Final Report
3
4.
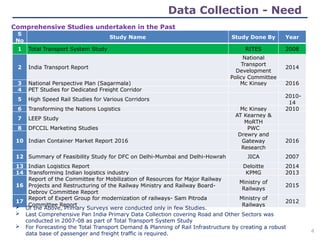
Comprehensive Studies undertakenin the Past
Data Collection - Need
S
No
Study Name Study Done By Year
1 Total Transport System Study RITES 2008
2 India Transport Report
National
Transport
Development
Policy Committee
2014
3 National Perspective Plan (Sagarmala) Mc Kinsey 2016
4 PET Studies for Dedicated Freight Corridor
5 High Speed Rail Studies for Various Corridors
2010-
14
6 Transforming the Nations Logistics Mc Kinsey 2010
7 LEEP Study
AT Kearney &
MoRTH
8 DFCCIL Marketing Studies PWC
10 Indian Container Market Report 2016
Drewry and
Gateway
Research
2016
12 Summary of Feasibility Study for DFC on Delhi-Mumbai and Delhi-Howrah JICA 2007
13 Indian Logistics Report Deloitte 2014
14 Transforming Indian logistics industry KPMG 2013
16
Report of the Committee for Mobilization of Resources for Major Railway
Projects and Restructuring of the Railway Ministry and Railway Board-
Debroy Committee Report
Ministry of
Railways
2015
17
Report of Expert Group for modernization of railways- Sam Pitroda
Committee Report
Ministry of
Railways
2012
Of the Above, Primary Surveys were conducted only in few Studies.
Last Comprehensive Pan India Primary Data Collection covering Road and Other Sectors was
conducted in 2007-08 as part of Total Transport System Study
For Forecasting the Total Transport Demand & Planning of Rail Infrastructure by creating a robust
data base of passenger and freight traffic is required. 4
5.
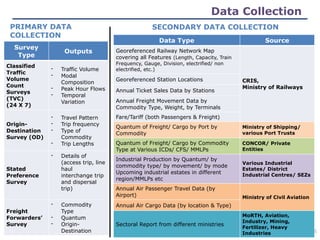
Data Collection
PRIMARY DATA
COLLECTION
SECONDARYDATA COLLECTION
Data Type Source
Georeferenced Railway Network Map
covering all Features (Length, Capacity, Train
Frequency, Gauge, Division, electrified/ non
electrified, etc.)
CRIS,
Ministry of Railways
Georeferenced Station Locations
Annual Ticket Sales Data by Stations
Annual Freight Movement Data by
Commodity Type, Weight, by Terminals
Fare/Tariff (both Passengers & Freight)
Quantum of Freight/ Cargo by Port by
Commodity
Ministry of Shipping/
various Port Trusts
Quantum of Freight/ Cargo by Commodity
Type at Various ICDs/ CFS/ MMLPs
CONCOR/ Private
Entities
Industrial Production by Quantum/ by
commodity type/ by movement/ by mode
Upcoming industrial estates in different
region/MMLPs etc
Various Industrial
Estates/ District
Industrial Centres/ SEZs
Annual Air Passenger Travel Data (by
Airport) Ministry of Civil Aviation
Annual Air Cargo Data (by location & Type)
Sectoral Report from different ministries
MoRTH, Aviation,
Industry, Mining,
Fertilizer, Heavy
Industries
Survey
Type
Outputs
Classified
Traffic
Volume
Count
Surveys
(TVC)
(24 X 7)
- Traffic Volume
- Modal
Composition
- Peak Hour Flows
- Temporal
Variation
Origin-
Destination
Survey (OD)
- Travel Pattern
- Trip frequency
- Type of
Commodity
- Trip Lengths
Stated
Preference
Survey
- Details of
(access trip, line
haul
interchange trip
and dispersal
trip)
Freight
Forwarders’
Survey
- Commodity
Type
- Quantum
- Origin-
Destination 5
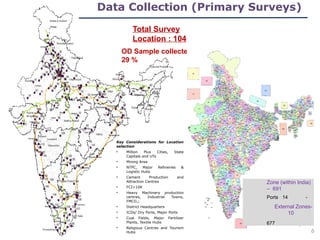
6.
Data Collection (PrimarySurveys)
Total Survey
Location : 104
OD Sample collected:
29 %
Key Considerations for Location
selection
• Million Plus Cities, State
Capitals and UTs
• Mining Area
• NTPC, Major Refineries &
Logistic Hubs
• Cement Production and
Attraction Centres
• FCI>10K
• Heavy Machinery production
centres, Industrial Towns,
FMCG,;
• District Headquarters
• ICDs/ Dry Ports, Major Ports
• Coal Fields, Major Fertilizer
Plants, Textile Hubs
• Religious Centres and Tourism
Hubs
Zone (within India)
– 691
Ports 14 -
Districts -
677
External Zones-
10
6
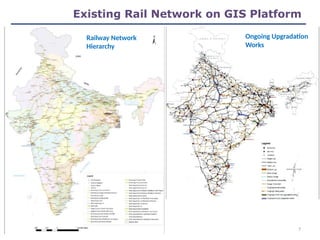
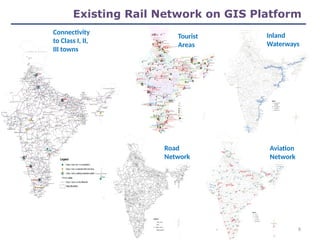
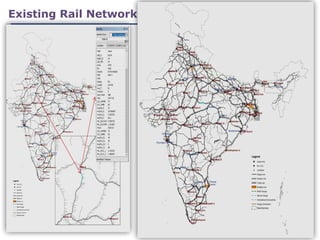
Existing Rail Networkon GIS Platform
Tourist
Areas
Inland
Waterways
Aviation
Network
Road
Network
Connectivity
to Class I, II,
III towns
Road
Network
8
High Value /High Rated
Commodities
Non
Conventional
Goods
10
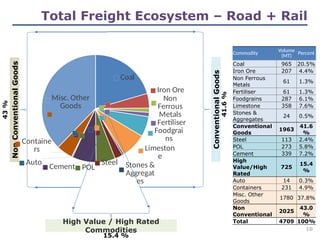
Commodity Volume
(MT)
Percent
Coal 965 20.5%
Iron Ore 207 4.4%
Non Ferrous
Metals
61 1.3%
Fertiliser 61 1.3%
Foodgrains 287 6.1%
Limestone 358 7.6%
Stones &
Aggregates
24 0.5%
Conventional
Goods
1963
41.6
%
Steel 113 2.4%
POL 273 5.8%
Cement 339 7.2%
High
Value/High
Rated
725
15.4
%
Auto 14 0.3%
Containers 231 4.9%
Misc. Other
Goods
1780 37.8%
Non
Conventional
2025
43.0
%
Total 4709 100%
43
%
15.4 %
41.6
%
Total Freight Ecosystem – Road + Rail
Coal
Iron Ore
Non
Ferrous
Metals
Fertiliser
Foodgrai
ns
Limeston
e
Stones &
Aggregat
es
Steel
POL
Cement
Auto
Containe
rs
Misc. Other
Goods
Conventional
Goods
11.
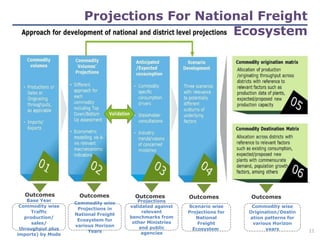
Projections For NationalFreight
Ecosystem
Base Year
Commodity wise
Traffic
production/
sales/
throughput plus
imports) by Mode
Outcomes
Commodity wise
Projections in
National Freight
Ecosystem for
various Horizon
Years
Outcomes
Projections
validated against
relevant
benchmarks from
other Ministries
and public
agencies
Outcomes
Scenario wise
Projections for
National
Freight
Ecosystem
Outcomes
Commodity wise
Origination/Destin
ation patterns for
various Horizon
years
Outcomes
11
12.
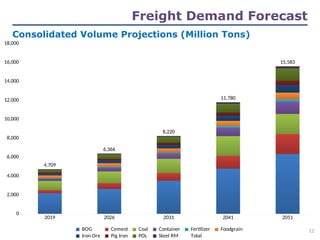
Consolidated Volume Projections(Million Tons)
Freight Demand Forecast
2019 2026 2031 2041 2051
0
2,000
4,000
6,000
8,000
10,000
12,000
14,000
16,000
18,000
4,709
6,366
8,220
11,780
15,583
BOG Cement Coal Container Fertilizer Foodgrain
Iron Ore Pig Iron POL Steel RM Total
12
13.
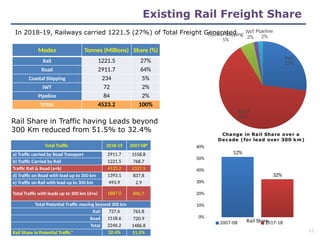
In 2018-19, Railwayscarried 1221.5 (27%) of Total Freight Generated
Modes Tonnes (Millions) Share (%)
Rail 1221.5 27%
Road 2911.7 64%
Coastal Shipping 234 5%
IWT 72 2%
Pipeline 84 2%
TOTAL 4523.2 100%
Total Traffic 2018-19 2007-08#
a) Traffic carried by Road Transport 2911.7 1558.8
b) Traffic Carried by Rail 1221.5 768.7
Traffic Rail & Road (a+b) 4133.2 2327.5
d) Traffic on Road with lead up to 300 km 1393.1 837.8
e) Traffic on Rail with lead up to 300 km 493.9 2.9
Total Traffic with leads up to 300 km (d+e) 1887.0 840.7
Total Potential Traffic moving beyond 300 km
Rail 727.6 765.8
Road 1518.6 720.9
Total 2246.2 1486.8
Rail Share in Potential Traffic* 32.4% 51.5%
Rail Share in Traffic having Leads beyond
300 Km reduced from 51.5% to 32.4%
Existing Rail Freight Share
Rail Share
0%
10%
20%
30%
40%
50%
60%
52%
32%
Change in Rail Share over a
Decade (for lead over 300 km)
2007-08 2017-18
13
Rail
27%
Road
64%
Coastal Shipping
5%
IWT
2%
Pipeline
2%
14.
14
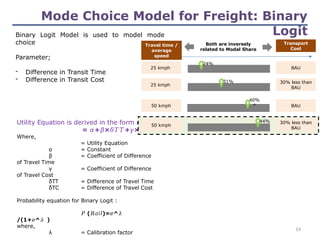
Mode Choice Modelfor Freight: Binary
Logit
Utility Equation is derived in the form of,
= + × + ×
𝛼 𝛽 𝛿𝑇𝑇 𝛾 𝛿𝑇𝐶
Where,
= Utility Equation
α = Constant
β = Coefficient of Difference
of Travel Time
γ = Coefficient of Difference
of Travel Cost
δTT = Difference of Travel Time
δTC = Difference of Travel Cost
Probability equation for Binary Logit :
𝑃 ( )= ^
𝑅𝑎𝑖𝑙 𝑒 𝜆
/(1+ ^
𝑒 𝜆 )
where,
λ = Calibration factor
Binary Logit Model is used to model mode
choice
Parameter;
- Difference in Transit Time
- Difference in Transit Cost
Travel time /
average
speed
25 kmph BAU
25 kmph
30% less than
BAU
50 kmph BAU
50 kmph
30% less than
BAU
Transport
Cost
31%
Both are inversely
related to Modal Share
24%
40%
*
44%
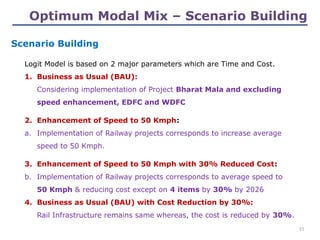
15.
Logit Model isbased on 2 major parameters which are Time and Cost.
1. Business as Usual (BAU):
Considering implementation of Project Bharat Mala and excluding
speed enhancement, EDFC and WDFC
2. Enhancement of Speed to 50 Kmph:
a. Implementation of Railway projects corresponds to increase average
speed to 50 Kmph.
3. Enhancement of Speed to 50 Kmph with 30% Reduced Cost:
b. Implementation of Railway projects corresponds to average speed to
50 Kmph & reducing cost except on 4 items by 30% by 2026
4. Business as Usual (BAU) with Cost Reduction by 30%:
Rail Infrastructure remains same whereas, the cost is reduced by 30%.
Scenario Building
Optimum Modal Mix – Scenario Building
15
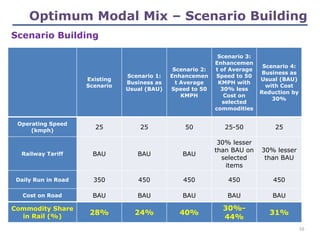
16.
Scenario Building
Existing
Scenario
Scenario 1:
Businessas
Usual (BAU)
Scenario 2:
Enhancemen
t Average
Speed to 50
KMPH
Scenario 3:
Enhancemen
t of Average
Speed to 50
KMPH with
30% less
Cost on
selected
commodities
Scenario 4:
Business as
Usual (BAU)
with Cost
Reduction by
30%
Operating Speed
(kmph)
25 25 50 25-50 25
Railway Tariff BAU BAU BAU
30% lesser
than BAU on
selected
items
30% lesser
than BAU
Daily Run in Road 350 450 450 450 450
Cost on Road BAU BAU BAU BAU BAU
Commodity Share
in Rail (%)
28% 24% 40%
30%-
44%
31%
Optimum Modal Mix – Scenario Building
16
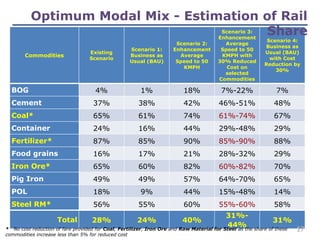
17.
Commodities
Existing
Scenario
Scenario 1:
Business as
Usual(BAU)
Scenario 2:
Enhancement
Average
Speed to 50
KMPH
Scenario 3:
Enhancement
Average
Speed to 50
KMPH with
30% Reduced
Cost on
selected
Commodities
Scenario 4:
Business as
Usual (BAU)
with Cost
Reduction by
30%
BOG 4% 1% 18% 7%-22% 7%
Cement 37% 38% 42% 46%-51% 48%
Coal* 65% 61% 74% 61%-74% 67%
Container 24% 16% 44% 29%-48% 29%
Fertilizer* 87% 85% 90% 85%-90% 88%
Food grains 16% 17% 21% 28%-32% 29%
Iron Ore* 65% 60% 82% 60%-82% 70%
Pig Iron 49% 49% 57% 64%-70% 65%
POL 18% 9% 44% 15%-48% 14%
Steel RM* 56% 55% 60% 55%-60% 58%
Total 28% 24% 40%
31%-
44%
31%
Optimum Modal Mix - Estimation of Rail
Share
* No cost reduction of fare provided for Coal, Fertilizer, Iron Ore and Raw Material for Steel as the share of these
commodities increase less than 5% for reduced cost
17
18.
Coal Iron OreCement BOG Container Fertilizer Foodgrain POL Pig Iron Steel RM
0%
10%
20%
30%
40%
50%
60%
49%
12%
10%
7%
5% 4% 4% 4% 3%
2%
39%
10%
14%
12%
6%
4% 5% 4%
5%
2%
23%
9%
16%
21%
9%
4% 3%
9%
5%
2%
201
8
202
4
Coal
49%
Iron Ore
12%
Cement
10%
BOG
7%
Container
5%
Fertilizer
4%
Foodgrain
4%
POL
4%
Pig Iron
3% Steel RM
2%
39%
10%
14%
12%
6%
4%
5%
4%
5% 2%
Coal
23%
Iron Ore
9%
Cement
16%
BOG
21%
Container
9%
Fertilizer
4%
Foodgrain
3%
POL
9%
Pig Iron
5%
Steel RM
2%
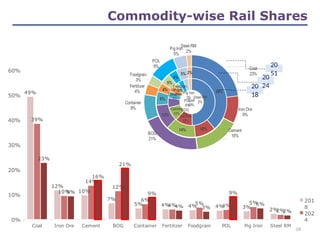
Commodity-wise Rail Shares
20
18
20
24
20
51
18
19.
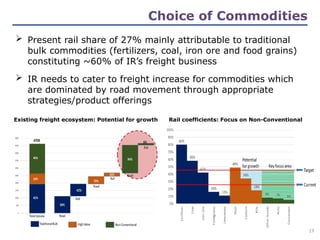
Existing freight ecosystem:Potential for growth Rail coefficients: Focus on Non-Conventional
Present rail share of 27% mainly attributable to traditional
bulk commodities (fertilizers, coal, iron ore and food grains)
constituting ~60% of IR’s freight business
IR needs to cater to freight increase for commodities which
are dominated by road movement through appropriate
strategies/product offerings
Choice of Commodities
19
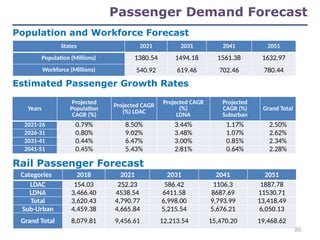
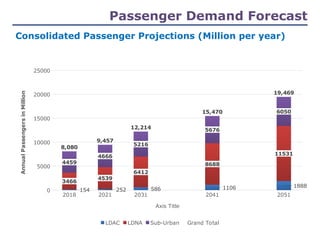
Passenger Demand Forecast
20182021 2031 2041 2051
0
5000
10000
15000
20000
25000
154 252 586 1106 1888
3466
4539
6412
8688
11531
4459
4666
5216
5676
6050
8,080
9,457
12,214
15,470
19,469
LDAC LDNA Sub-Urban Grand Total
Axis Title
Annual
Passengers
in
Million
Consolidated Passenger Projections (Million per year)
22.
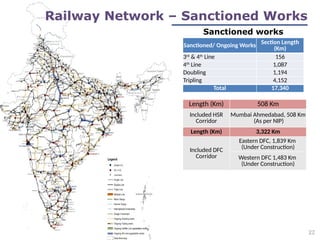
Sanctioned works
Sanctioned/ OngoingWorks
Section Length
(Km)
3rd
& 4th
Line 156
4th
Line 1,087
Doubling 1,194
Tripling 4,152
Total 17,340
Length (Km) 508 Km
Included HSR
Corridor
Mumbai Ahmedabad, 508 Km
(As per NIP)
Length (Km) 3,322 Km
Included DFC
Corridor
Eastern DFC, 1,839 Km
(Under Construction)
Western DFC 1,483 Km
(Under Construction)
22
Railway Network – Sanctioned Works
23.
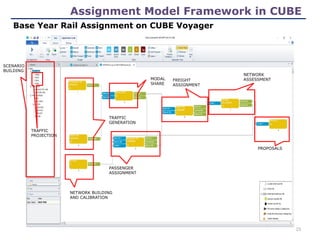
Assignment Model Frameworkin CUBE
Base Year Rail Assignment on CUBE Voyager
SCENARIO
BUILDING
TRAFFIC
GENERATION
NETWORK BUILDING
AND CALIBRATION
MODAL
SHARE
PASSENGER
ASSIGNMENT
FREIGHT
ASSIGNMENT
NETWORK
ASSESSMENT
PROPOSALS
TRAFFIC
PROJECTION
23
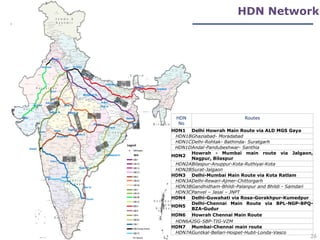
HDN Network
HD
N
1
HD
N 4
HD
N2
HD
N
3
HD
N
6
HD
N 7
H
D
N
5
HD
N
1
HDN
No
Routes
HDN1 Delhi Howrah Main Route via ALD MGS Gaya
HDN1BGhaziabad- Moradabad
HDN1CDelhi-Rohtak- Bathinda- Suratgarh
HDN1DAndal-Pandubeshwar- Santhia
HDN2
Howrah - Mumbai main route via Jalgaon,
Nagpur, Bilaspur
HDN2ABilaspur-Anuppur-Kota-Ruthiyai-Kota
HDN2BSurat-Jalgaon
HDN3 Delhi-Mumbai Main Route via Kota Ratlam
HDN3ADelhi-Rewari-Ajmer-Chittorgarh
HDN3BGandhidham-Bhildi-Palanpur and Bhildi - Samdari
HDN3CPanvel – Jasai – JNPT
HDN4 Delhi-Guwahati via Rosa-Gorakhpur-Kumedpur
HDN5
Delhi-Chennai Main Route via BPL-NGP-BPQ-
BZA-Gudur
HDN6 Howrah Chennai Main Route
HDN6AJSG-SBP-TIG-VZM
HDN7 Mumbai-Chennai main route
HDN7AGuntkal-Bellari-Hospet-Hubli-Londa-Vasco
26
27.
27
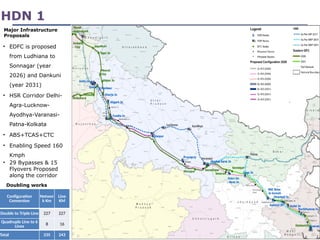
HDN 1
Configuration
Conversion
Networ
k Km
Line
KM
Doubleto Triple Line 227 227
Quadruple Line to 6
Lines 8 16
Total 235 243
Doubling works
• EDFC is proposed
from Ludhiana to
Sonnagar (year
2026) and Dankuni
(year 2031)
• HSR Corridor Delhi-
Agra-Lucknow-
Ayodhya-Varanasi-
Patna-Kolkata
• ABS+TCAS+CTC
• Enabling Speed 160
Kmph
• 29 Bypasses & 15
Flyovers Proposed
along the corridor
Major Infrastructure
Proposals
28.
28
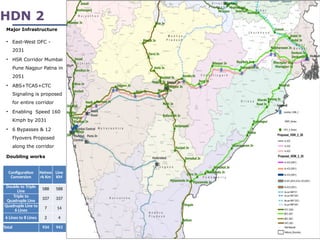
HDN 2
Configuration
Conversion
Netwo
rk Km
Line
KM
Doubleto Triple
Line 588 588
Triple to
Quadruple Line 337 337
Quadruple Line to
6 Lines 7 14
6 Lines to 8 Lines 2 4
Total 934 943
Doubling works
• East-West DFC -
2031
• HSR Corridor Mumbai
Pune Nagpur Patna in
2051
• ABS+TCAS+CTC
Signaling is proposed
for entire corridor
• Enabling Speed 160
Kmph by 2031
• 6 Bypasses & 12
Flyovers Proposed
along the corridor
Major Infrastructure
29.
29
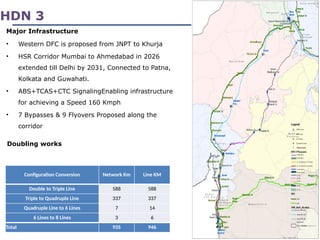
Configuration Conversion NetworkKm Line KM
Double to Triple Line 588 588
Triple to Quadruple Line 337 337
Quadruple Line to 6 Lines 7 14
6 Lines to 8 Lines 3 6
Total 935 946
Doubling works
• Western DFC is proposed from JNPT to Khurja
• HSR Corridor Mumbai to Ahmedabad in 2026
extended till Delhi by 2031, Connected to Patna,
Kolkata and Guwahati.
• ABS+TCAS+CTC SignalingEnabling infrastructure
for achieving a Speed 160 Kmph
• 7 Bypasses & 9 Flyovers Proposed along the
corridor
Major Infrastructure
HDN 3
30.
30
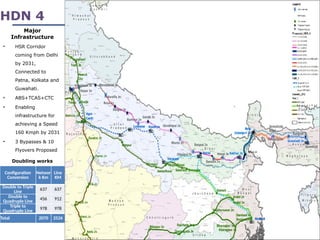
HDN 4
Configuration
Conversion
Networ
k Km
Line
KM
Doubleto Triple
Line 637 637
Double to
Quadruple Line 456 912
Triple to
Quadruple Line 978 978
Total 2070 2526
Doubling works
• HSR Corridor
coming from Delhi
by 2031,
Connected to
Patna, Kolkata and
Guwahati.
• ABS+TCAS+CTC
• Enabling
infrastructure for
achieving a Speed
160 Kmph by 2031
• 3 Bypasses & 10
Flyovers Proposed
Major
Infrastructure
31.
31
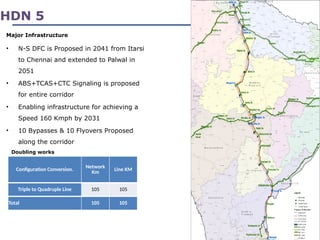
HDN 5
Configuration Conversion.Network
Km
Line KM
Triple to Quadruple Line 105 105
Total 105 105
Doubling works
• N-S DFC is Proposed in 2041 from Itarsi
to Chennai and extended to Palwal in
2051
• ABS+TCAS+CTC Signaling is proposed
for entire corridor
• Enabling infrastructure for achieving a
Speed 160 Kmph by 2031
• 10 Bypasses & 10 Flyovers Proposed
along the corridor
Major Infrastructure
32.
32
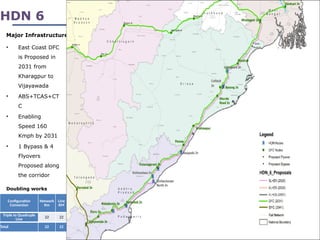
HDN 6
Configuration
Conversion
Network
Km
Line
KM
Triple toQuadruple
Line 22 22
Total 22 22
Doubling works
• East Coast DFC
is Proposed in
2031 from
Kharagpur to
Vijayawada
• ABS+TCAS+CT
C
• Enabling
Speed 160
Kmph by 2031
• 1 Bypass & 4
Flyovers
Proposed along
the corridor
Major Infrastructure
33.
33
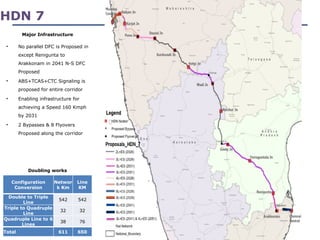
HDN 7
Configuration
Conversion
Networ
k Km
Line
KM
Doubleto Triple
Line
542 542
Triple to Quadruple
Line
32 32
Quadruple Line to 6
Lines
38 76
Total 611 650
Doubling works
• No parallel DFC is Proposed in
except Renigunta to
Arakkonam in 2041 N-S DFC
Proposed
• ABS+TCAS+CTC Signaling is
proposed for entire corridor
• Enabling infrastructure for
achieving a Speed 160 Kmph
by 2031
• 2 Bypasses & 8 Flyovers
Proposed along the corridor
Major Infrastructure
34.
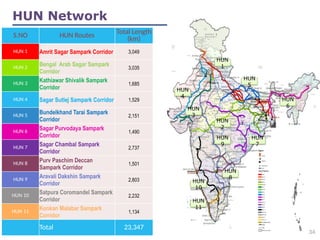
HUN Network
S.NO HUNRoutes Total Length
(km)
HUN 1 Amrit Sagar Sampark Corridor 3,049
HUN 2
Bengal Arab Sagar Sampark
Corridor
3,035
HUN 3
Kathiawar Shivalik Sampark
Corridor
1,685
HUN 4 Sagar Sutlej Sampark Corridor 1,529
HUN 5
Bundelkhand Tarai Sampark
Corridor
2,151
HUN 6
Sagar Purvodaya Sampark
Corridor
1,490
HUN 7
Sagar Chambal Sampark
Corridor
2,737
HUN 8
Purv Paschim Deccan
Sampark Corridor
1,501
HUN 9
Aravali Dakshin Sampark
Corridor
2,803
HUN 10
Satpura Coromandel Sampark
Corridor
2,232
HUN 11
Konkan Malabar Sampark
Corridor
1,134
Total 23,347
HUN
1
HUN
3
HUN
2
HUN
4
HUN
5
HUN
6
HUN
7
HUN
8
HUN
9
HUN
10
HUN
11
34
35.
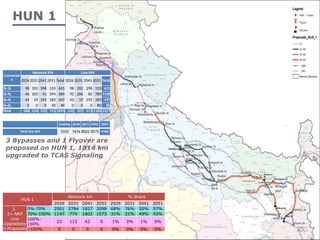
HUN 1
HUN 1
Networkkm % Share
2026 2031 2041 2051 2026 2031 2041 2051
3.
2+ NRP
Line
Upgradatio
n Proposals
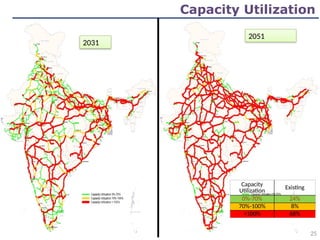
0%-70% 2501 2784 1827 2098 68% 76% 50% 57%
70%-100% 1147 774 1802 1573 31% 21% 49% 43%
100%-
150%
23 113 42 0 1% 3% 1% 0%
>150% 0 0 0 0 0% 0% 0% 0%
Existing 2026 2031 2041 2051
Total Line KM 7035 7676 8002 8575 9760
3 Bypasses and 1 Flyover are
proposed on HUN 1, 1814 km
upgraded to TCAS Signaling
Conversio
n
Network KM Line KM
202620312041 2051 Total 2026 2031 2041 2051 Total
2L-3L 98 102 298 133 631 98 102 298 133 631
2L-4L 46 103 41 394 584 92 206 82 789 1168
3L-4L 43 19 193 183 437 43 19 193 183 437
4L-6L 0 0 0 40 40 0 0 0 80 80
Total 186 224 532 751 1693 232 327 573 1185 2317
Patha
nkot
Bhagal
pur
Jamui
35
36.
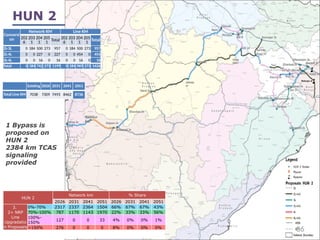
HUN 2
HUN 2
Networkkm % Share
2026 2031 2041 2051 2026 2031 2041 2051
3.
2+ NRP
Line
Upgradatio
n Proposals
0%-70% 2317 2337 2364 1504 66% 67% 67% 43%
70%-100% 787 1170 1143 1970 22% 33% 33% 56%
100%-
150%
127 0 0 33 4% 0% 0% 1%
>150% 276 0 0 0 8% 0% 0% 0%
Existing 2026 2031 2041 2051
Total Line KM 7038 7309 7493 8462 8736
1 Bypass is
proposed on
HUN 2
2384 km TCAS
signaling
provided
Conversi
on
Network KM Line KM
202
6
203
1
204
1
205
1 Total 202
6
203
1
204
1
205
1 Total
2L-3L 0 184 500 273 957 0 184 500 273 957
2L-4L 0 0 227 0 227 0 0 454 0 454
3L-4L 0 0 16 0 16 0 0 16 0 16
Total 0 184 742 273 1199 0 184 969 273 1426
Nandur
bar
Jabalp
ur
Obra
Dam
36
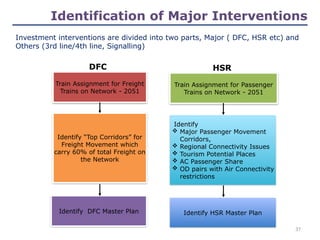
37.
37
Train Assignment forFreight
Trains on Network - 2051
Identify DFC Master Plan
Identify “Top Corridors” for
Freight Movement which
carry 60% of total Freight on
the Network
Identify HSR Master Plan
Identify
Major Passenger Movement
Corridors,
Regional Connectivity Issues
Tourism Potential Places
AC Passenger Share
OD pairs with Air Connectivity
restrictions
Investment interventions are divided into two parts, Major ( DFC, HSR etc) and
Others (3rd line/4th line, Signalling)
Train Assignment for Passenger
Trains on Network - 2051
Identification of Major Interventions
DFC HSR
38.
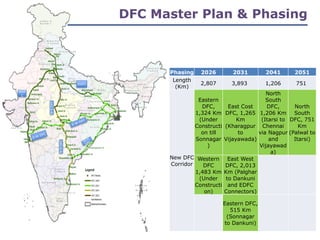
38
DFC Master Plan& Phasing
Phasing 2026 2031 2041 2051
Length
(Km)
2,807 3,893 1,206 751
New DFC
Corridor
Eastern
DFC,
1,324 Km
(Under
Constructi
on till
Sonnagar
)
East Cost
DFC, 1,265
Km
(Kharagpur
to
Vijayawada)
North
South
DFC,
1,206 Km
(Itarsi to
Chennai
via Nagpur
and
Vijayawad
a)
North
South
DFC, 751
Km
(Palwal to
Itarsi)
Western
DFC
1,483 Km
(Under
Constructi
on)
East West
DFC, 2,013
Km (Palghar
to Dankuni
and EDFC
Connectors)
Eastern DFC,
515 Km
(Sonnagar
to Dankuni)
EDFC
WDF
C
E-W DFC
N-S
DFC
ECo
DFC
E-W DFC
N-S
DFC
39.
39
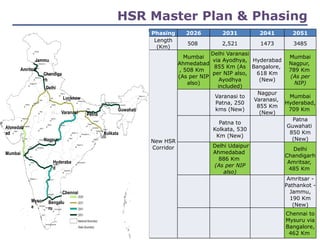
Phasing 2026 20312041 2051
Length
(Km)
508 2,521 1473 3485
New HSR
Corridor
Mumbai
Ahmedabad
, 508 Km
(As per NIP
also)
Delhi Varanasi
via Ayodhya,
855 Km (As
per NIP also,
Ayodhya
included)
Hyderabad
Bangalore,
618 Km
(New)
Mumbai
Nagpur,
789 Km
(As per
NIP)
Varanasi to
Patna, 250
kms (New)
Nagpur
Varanasi,
855 Km
(New)
Mumbai
Hyderabad,
709 Km
Patna to
Kolkata, 530
Km (New)
Patna
Guwahati
850 Km
(New)
Delhi Udaipur
Ahmedabad
886 Km
(As per NIP
also)
Delhi
Chandigarh
Amritsar,
485 Km
Amritsar -
Pathankot -
Jammu,
190 Km
(New)
Chennai to
Mysuru via
Bangalore,
462 Km
HSR Master Plan & Phasing
Jammu
Amritsar
Chandiga
rh
Delhi
Ahmedab
ad
Mumbai
Nagpur
Varanasi Patna
Guwahati
Kolkata
Chennai
Hyderaba
d
Bengalu
ru
Mysor
e
Lucknow
40.
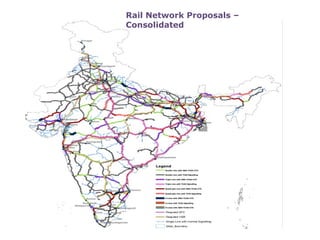
Double Line withABS+TCAS+CTC
Double Line with TCAS Signalling
Triple Line with ABS+TCAS+CTC
Triple Line with TCAS Signalling
Quadruple Line with ABS+TCAS+CTC
Quadruple Line with TCAS Signalling
6 Lines with ABS+TCAS+CTC
6 Lines with TCAS Signalling
8 Lines with ABS+TCAS+CTC
Rail Network Proposals –
Consolidated
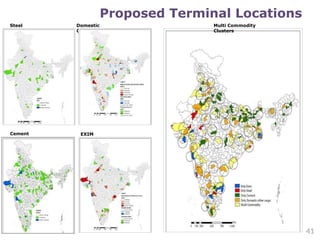
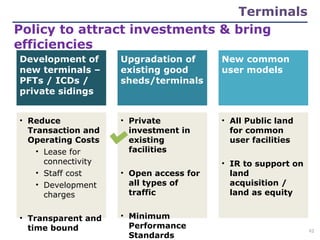
Policy to attractinvestments & bring
efficiencies
Development of
new terminals –
PFTs / ICDs /
private sidings
• Reduce
Transaction and
Operating Costs
• Lease for
connectivity
• Staff cost
• Development
charges
• Transparent and
time bound
Upgradation of
existing good
sheds/terminals
• Private
investment in
existing
facilities
• Open access for
all types of
traffic
• Minimum
Performance
Standards
New common
user models
• All Public land
for common
user facilities
• IR to support on
land
acquisition /
land as equity
Terminals
42
43.
02
01 04
03
05
06
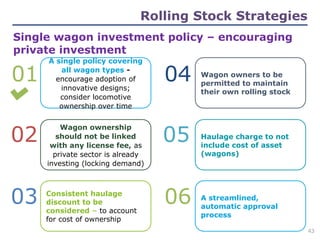
Single wagoninvestment policy – encouraging
private investment
A single policy covering
all wagon types -
encourage adoption of
innovative designs;
consider locomotive
ownership over time
Wagon ownership
should not be linked
with any license fee, as
private sector is already
investing (locking demand)
Consistent haulage
discount to be
considered – to account
for cost of ownership
Wagon owners to be
permitted to maintain
their own rolling stock
Haulage charge to not
include cost of asset
(wagons)
A streamlined,
automatic approval
process
Rolling Stock Strategies
43
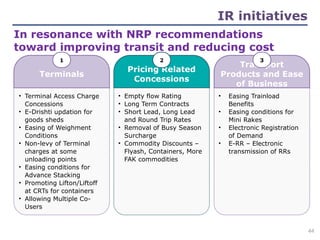
44.
Terminals
• Terminal AccessCharge
Concessions
• E-Drishti updation for
goods sheds
• Easing of Weighment
Conditions
• Non-levy of Terminal
charges at some
unloading points
• Easing conditions for
Advance Stacking
• Promoting Lifton/Liftoff
at CRTs for containers
• Allowing Multiple Co-
Users
1
Pricing Related
Concessions
2
• Empty flow Rating
• Long Term Contracts
• Short Lead, Long Lead
and Round Trip Rates
• Removal of Busy Season
Surcharge
• Commodity Discounts –
Flyash, Containers, More
FAK commodities
Transport
Products and Ease
of Business
• Easing Trainload
Benefits
• Easing conditions for
Mini Rakes
• Electronic Registration
of Demand
• E-RR – Electronic
transmission of RRs
3
In resonance with NRP recommendations
toward improving transit and reducing cost
IR initiatives
44
45.
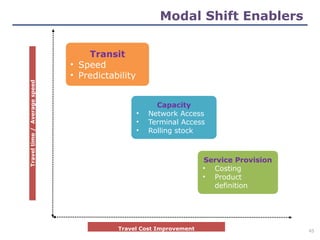
Transit
• Speed
• Predictability
Capacity
•Network Access
• Terminal Access
• Rolling stock
Service Provision
• Costing
• Product
definition
Modal Shift Enablers
Travel
time
/
Average
speed
Travel Cost Improvement 45
46.
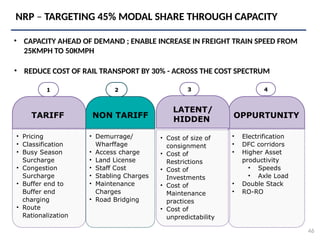
TARIFF
• Pricing
• Classification
•Busy Season
Surcharge
• Congestion
Surcharge
• Buffer end to
Buffer end
charging
• Route
Rationalization
1
NON TARIFF
2
• Demurrage/
Wharffage
• Access charge
• Land License
• Staff Cost
• Stabling Charges
• Maintenance
Charges
• Road Bridging
OPPURTUNITY
• Electrification
• DFC corridors
• Higher Asset
productivity
• Speeds
• Axle Load
• Double Stack
• RO-RO
4
• CAPACITY AHEAD OF DEMAND ; ENABLE INCREASE IN FREIGHT TRAIN SPEED FROM
25KMPH TO 50KMPH
46
• Cost of size of
consignment
• Cost of
Restrictions
• Cost of
Investments
• Cost of
Maintenance
practices
• Cost of
unpredictability
LATENT/
HIDDEN
3
NRP – TARGETING 45% MODAL SHARE THROUGH CAPACITY
• REDUCE COST OF RAIL TRANSPORT BY 30% - ACROSS THE COST SPECTRUM