FP Growth - last 5 years
•Download as DOCX, PDF•
0 likes•90 views
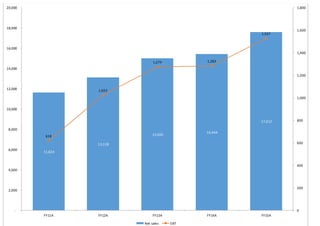
This document contains a line graph showing the net sales and earnings before tax (EBT) for a company over 5 fiscal years from FY11A to FY15A. Net sales increased each year from approximately $11,000 to over $17,000. EBT also increased most years but remained under $2,000.
Report
Share
Report
Share
Recommended
David Norton - My Ah-Ha Moment with Big Data - Data Summit
David Norton - My Ah-Ha Moment with Big Data - Data SummitAmerican Association of Advertising Agencies
David Norton, EVP, Analytics & Consumer Insights, MDC Partners Inc.
His presentation at the 4A's Data Summit on October 16 in NYC. For more info: http://datasummit.aaaa.org/CEVA Q1 2018 Earnings Infographic
CEVA, Inc. reported Q1 2018 earnings of $17.6 million and non-GAAP EPS of $0.04. Non-handset baseband unit shipments and royalty revenues were up 58% and 39%, respectively, over first quarter 2017 actual shipments. Fourteen new agreements were signed, including two lead customers each for CEVA's NeuPro AI processor and CEVA's ClearVox noise suppression and beamforming technologies. For more information and highlights, view the infographic.
Life hack: How to buy a used car - by hour
This is our class that explains how to navigate the car buying experience. The information contains how much you should spend buy using hourly income as a point of reference.
Life hack: How to buy a used car for those who serve!
This is our class that explains how to navigate the car buying experience. The information contains how much you should spend buy using hourly income as a point of reference.
FHC CHINA ASIA 2017
YOUR BUSINESS IS YOUR PROFITABILITY IN CONCEPT HOTEL FUTURIST. SEE YOUR FUTURE AS YOUR PRESENT AND INVEST IN CREATIVITY THAT MAKES SENSE AND REALITY FOR BOTH GUESTS, MANAGEMENT AND STAFF. A NEW VISION AT SHORT TERM, MID TERM OR LONG TERM QUALITY AND TECHNOLOGY HOSPITALITY INDUSTRY.
Survey Performance Improvement Construct FP-Growth Tree
Construction of a compact FP-tree ensures that subsequent mining can be performed with a rather compact data structure. This does not automatically guarantee that it will be highly efficient since one may still encounter the combinatorial problem of candidate generation if one simply uses this FP-tree to generate and check all the candidate patterns. we study how to explore the compact information stored in an FP-tree, develop the principles of frequent-pattern growth by examination of our running example, explore how to perform further optimization when there exit a single prefix path in an FP-tree, and propose a frequent- pattern growth algorithm, FP-growth, for mining the complete set of frequent patterns using FP-tree.
Mining of Prevalent Ailments in a Health Database Using Fp-Growth Algorithm
Health databases are characterised by large number of attributes such as personal biological and diagnosis information, health history, prescription, billing information and so on. The increasing need for providing enhanced medical system has necessitated the need for adopting an efficient data mining technique for extracting hidden and useful information from health database. In the past, many data mining algorithms such as Apriori, Eclat, H-Mine have been developed with deficiency in time-space trade off. In this work, an enhanced FP-growth frequent pattern mining algorithm coined FP-Ail is applied to students’ health database with a view to provide information about prevalent ailments and suggestions for managing the identified ailments. FP-Ail is tested on a student’s health database of a tertiary institution in Nigeria and the results obtained could be used by the management of the health centre for enhanced strategic decision making about health care. FP-Ail also provides the possibility to refine the minimum support threshold interactively, and to see the changes instantly.
Fp growth
An efficient and scalable method to complete set of frequent patterns.
It allow frequent item set discovery without candidate item set generation.
Practical Data Mining: FP-Growth
Practical Data Mining: FP-GrowthBig Data Engineering, Faculty of Engineering, Dhurakij Pundit University
This slide presents FP-Growth technique.The comparative study of apriori and FP-growth algorithm
This ppt will surely help to understand Apriori and FP-growth algorithm.
Data mining fp growth
A simple graphical presentation of the implementation of FP Growth Algorithm for mining frequent pattern in a database
Frequent Pattern growth algorithm
Frequent Pattern growth algorithm provides better performance than Apriori algorithm. This approach used to detect frequent itemsets in database. It has two phase. In first phase, it constructs a suffix tree and in next, it starts mining recursively.
The recursion process is shown in details in presentation with figure.
More Related Content
What's hot
Life hack: How to buy a used car - by hour
This is our class that explains how to navigate the car buying experience. The information contains how much you should spend buy using hourly income as a point of reference.
Life hack: How to buy a used car for those who serve!
This is our class that explains how to navigate the car buying experience. The information contains how much you should spend buy using hourly income as a point of reference.
FHC CHINA ASIA 2017
YOUR BUSINESS IS YOUR PROFITABILITY IN CONCEPT HOTEL FUTURIST. SEE YOUR FUTURE AS YOUR PRESENT AND INVEST IN CREATIVITY THAT MAKES SENSE AND REALITY FOR BOTH GUESTS, MANAGEMENT AND STAFF. A NEW VISION AT SHORT TERM, MID TERM OR LONG TERM QUALITY AND TECHNOLOGY HOSPITALITY INDUSTRY.
What's hot (7)
Life hack: How to buy a used car for those who serve!
Life hack: How to buy a used car for those who serve!
Viewers also liked
Survey Performance Improvement Construct FP-Growth Tree
Construction of a compact FP-tree ensures that subsequent mining can be performed with a rather compact data structure. This does not automatically guarantee that it will be highly efficient since one may still encounter the combinatorial problem of candidate generation if one simply uses this FP-tree to generate and check all the candidate patterns. we study how to explore the compact information stored in an FP-tree, develop the principles of frequent-pattern growth by examination of our running example, explore how to perform further optimization when there exit a single prefix path in an FP-tree, and propose a frequent- pattern growth algorithm, FP-growth, for mining the complete set of frequent patterns using FP-tree.
Mining of Prevalent Ailments in a Health Database Using Fp-Growth Algorithm
Health databases are characterised by large number of attributes such as personal biological and diagnosis information, health history, prescription, billing information and so on. The increasing need for providing enhanced medical system has necessitated the need for adopting an efficient data mining technique for extracting hidden and useful information from health database. In the past, many data mining algorithms such as Apriori, Eclat, H-Mine have been developed with deficiency in time-space trade off. In this work, an enhanced FP-growth frequent pattern mining algorithm coined FP-Ail is applied to students’ health database with a view to provide information about prevalent ailments and suggestions for managing the identified ailments. FP-Ail is tested on a student’s health database of a tertiary institution in Nigeria and the results obtained could be used by the management of the health centre for enhanced strategic decision making about health care. FP-Ail also provides the possibility to refine the minimum support threshold interactively, and to see the changes instantly.
Fp growth
An efficient and scalable method to complete set of frequent patterns.
It allow frequent item set discovery without candidate item set generation.
Practical Data Mining: FP-Growth
Practical Data Mining: FP-GrowthBig Data Engineering, Faculty of Engineering, Dhurakij Pundit University
This slide presents FP-Growth technique.The comparative study of apriori and FP-growth algorithm
This ppt will surely help to understand Apriori and FP-growth algorithm.
Data mining fp growth
A simple graphical presentation of the implementation of FP Growth Algorithm for mining frequent pattern in a database
Frequent Pattern growth algorithm
Frequent Pattern growth algorithm provides better performance than Apriori algorithm. This approach used to detect frequent itemsets in database. It has two phase. In first phase, it constructs a suffix tree and in next, it starts mining recursively.
The recursion process is shown in details in presentation with figure.
Viewers also liked (11)
Survey Performance Improvement Construct FP-Growth Tree
Survey Performance Improvement Construct FP-Growth Tree
Mining of Prevalent Ailments in a Health Database Using Fp-Growth Algorithm
Mining of Prevalent Ailments in a Health Database Using Fp-Growth Algorithm
The comparative study of apriori and FP-growth algorithm
The comparative study of apriori and FP-growth algorithm