The document provides guidance and discusses operational performance for Yamana Gold for the fourth quarter and full year 2016. Key highlights include:
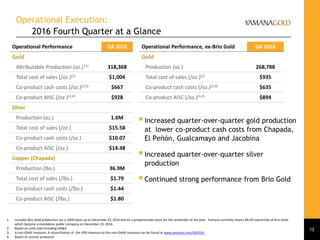
- Gold production for Q4 2016 was 318,368 ounces at an AISC of $928 per ounce. Silver production was 1.6 million ounces at an AISC of $14.48 per ounce.
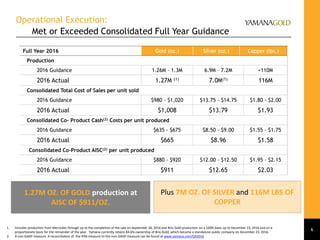
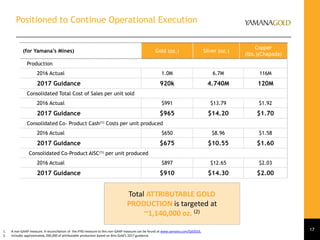
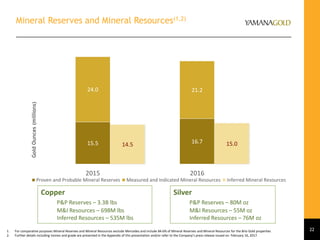
- For the full year, Yamana met or exceeded its guidance for gold, silver and copper production and costs. Production came in at 1.27 million ounces of gold, 7 million ounces of silver and 116 million pounds of copper.
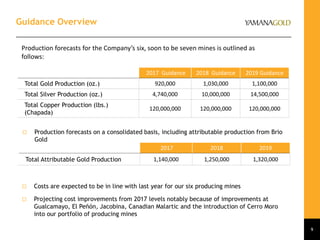
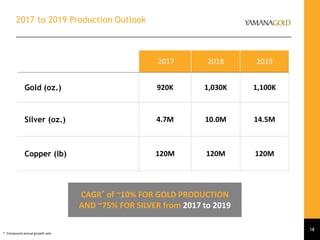
- Yamayo provides guidance for 2017-2019 that forecasts increasing gold and silver production over that period at expected lower costs