- The document is Yamana Gold's first quarter report from 2017, which provides an overview of the company's performance and outlook.
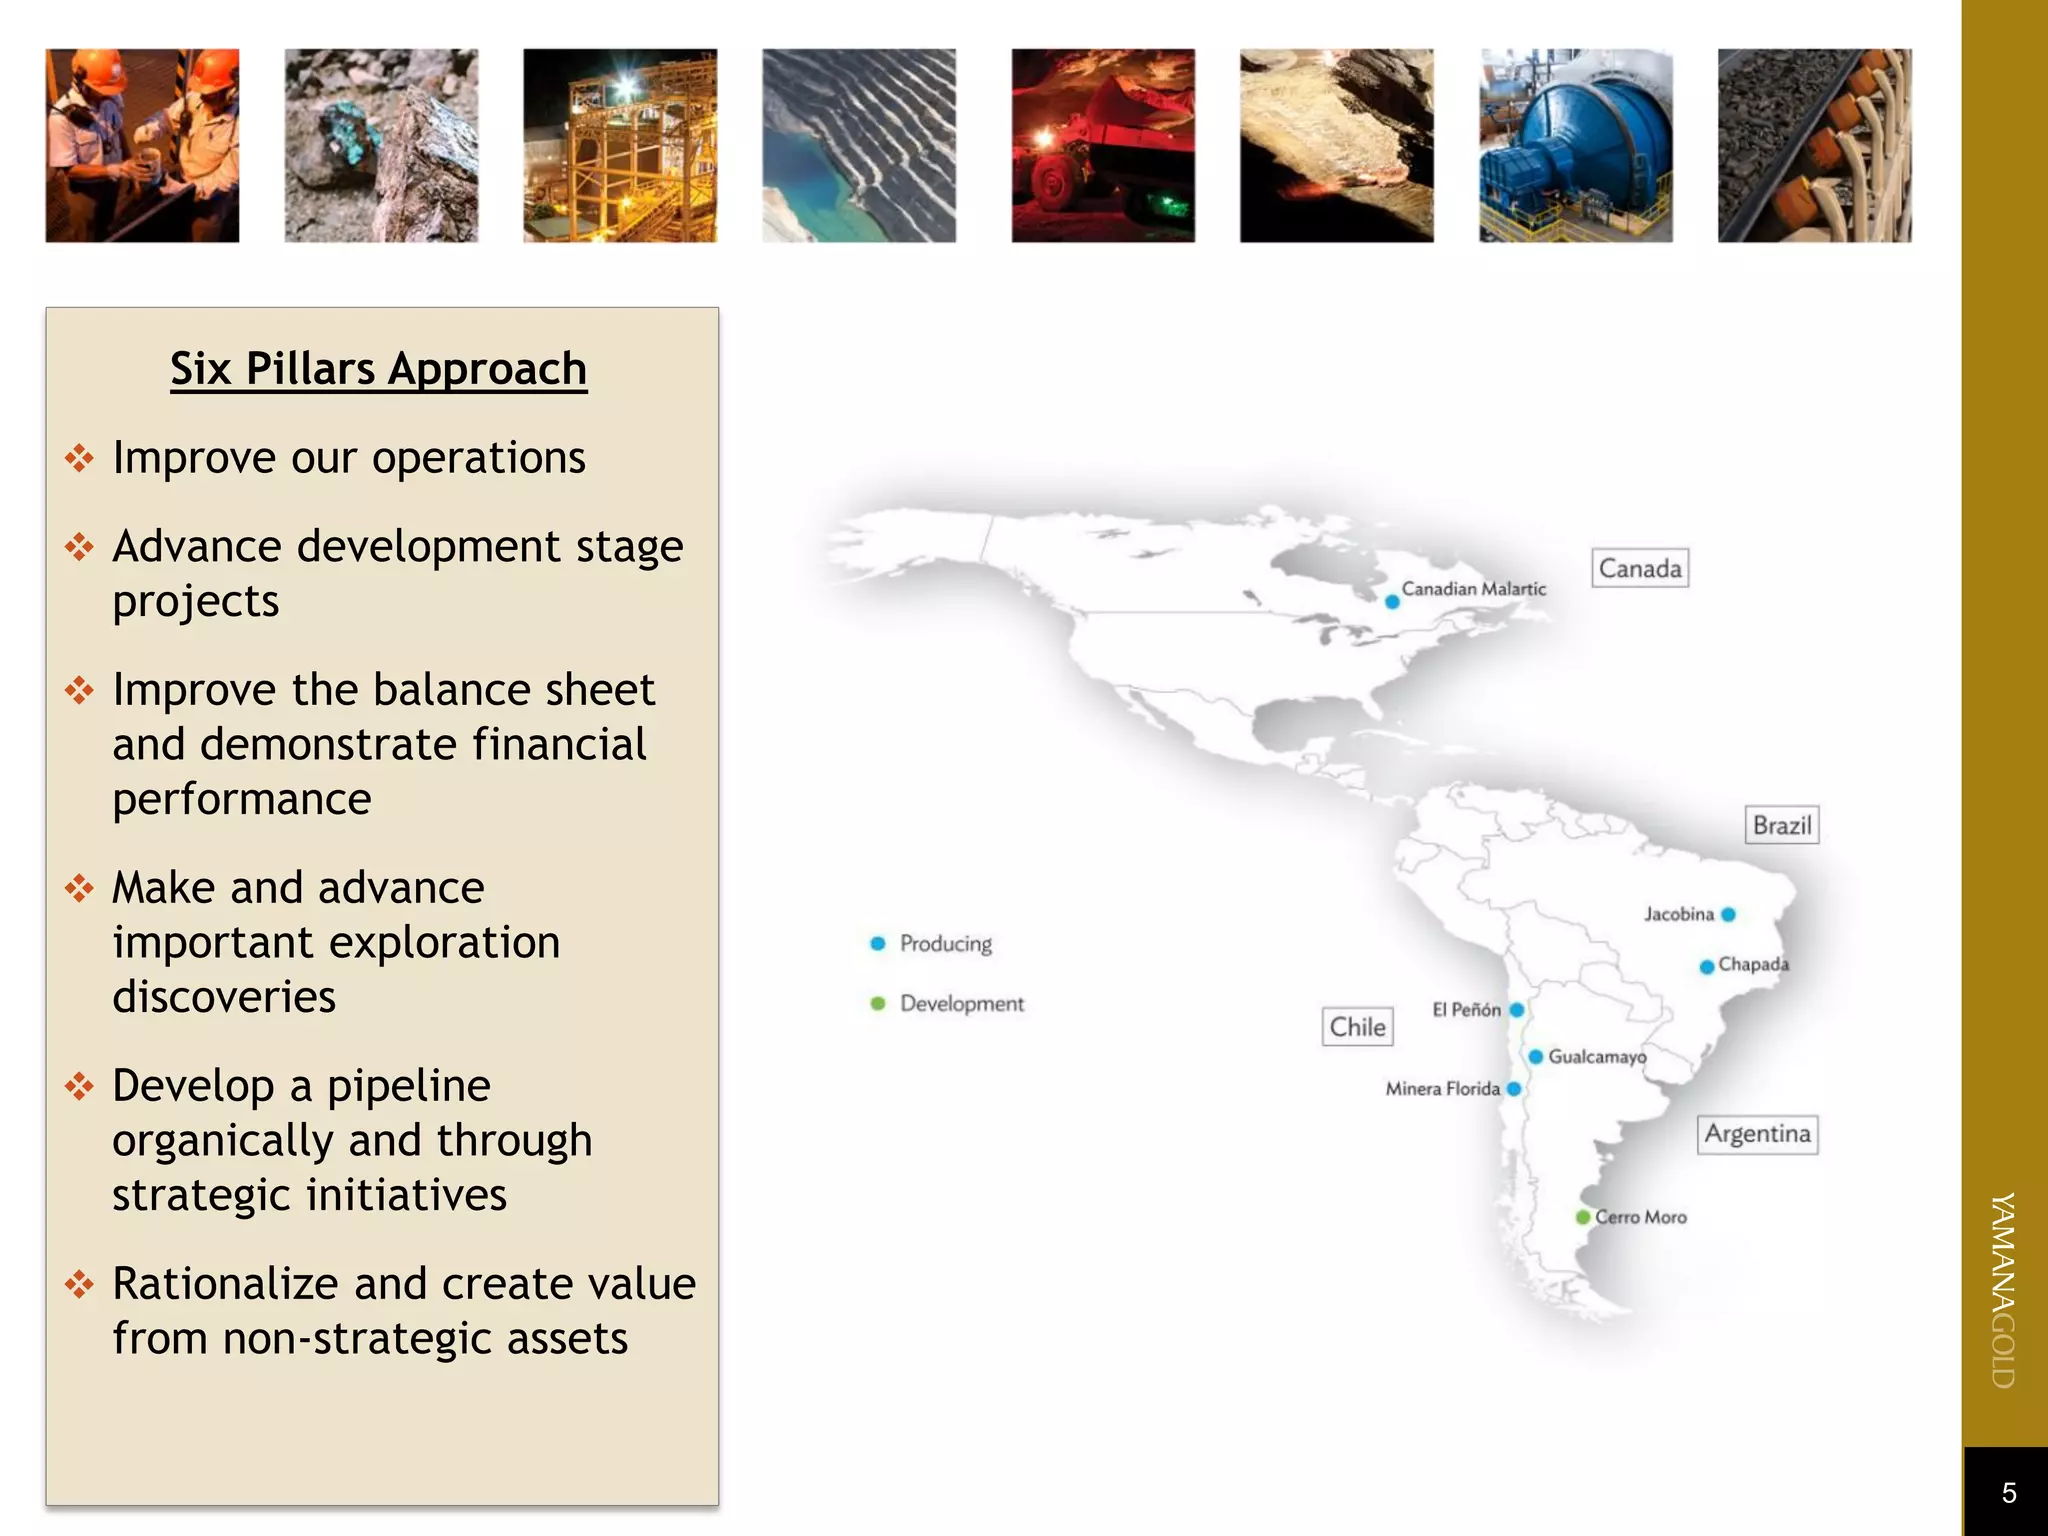
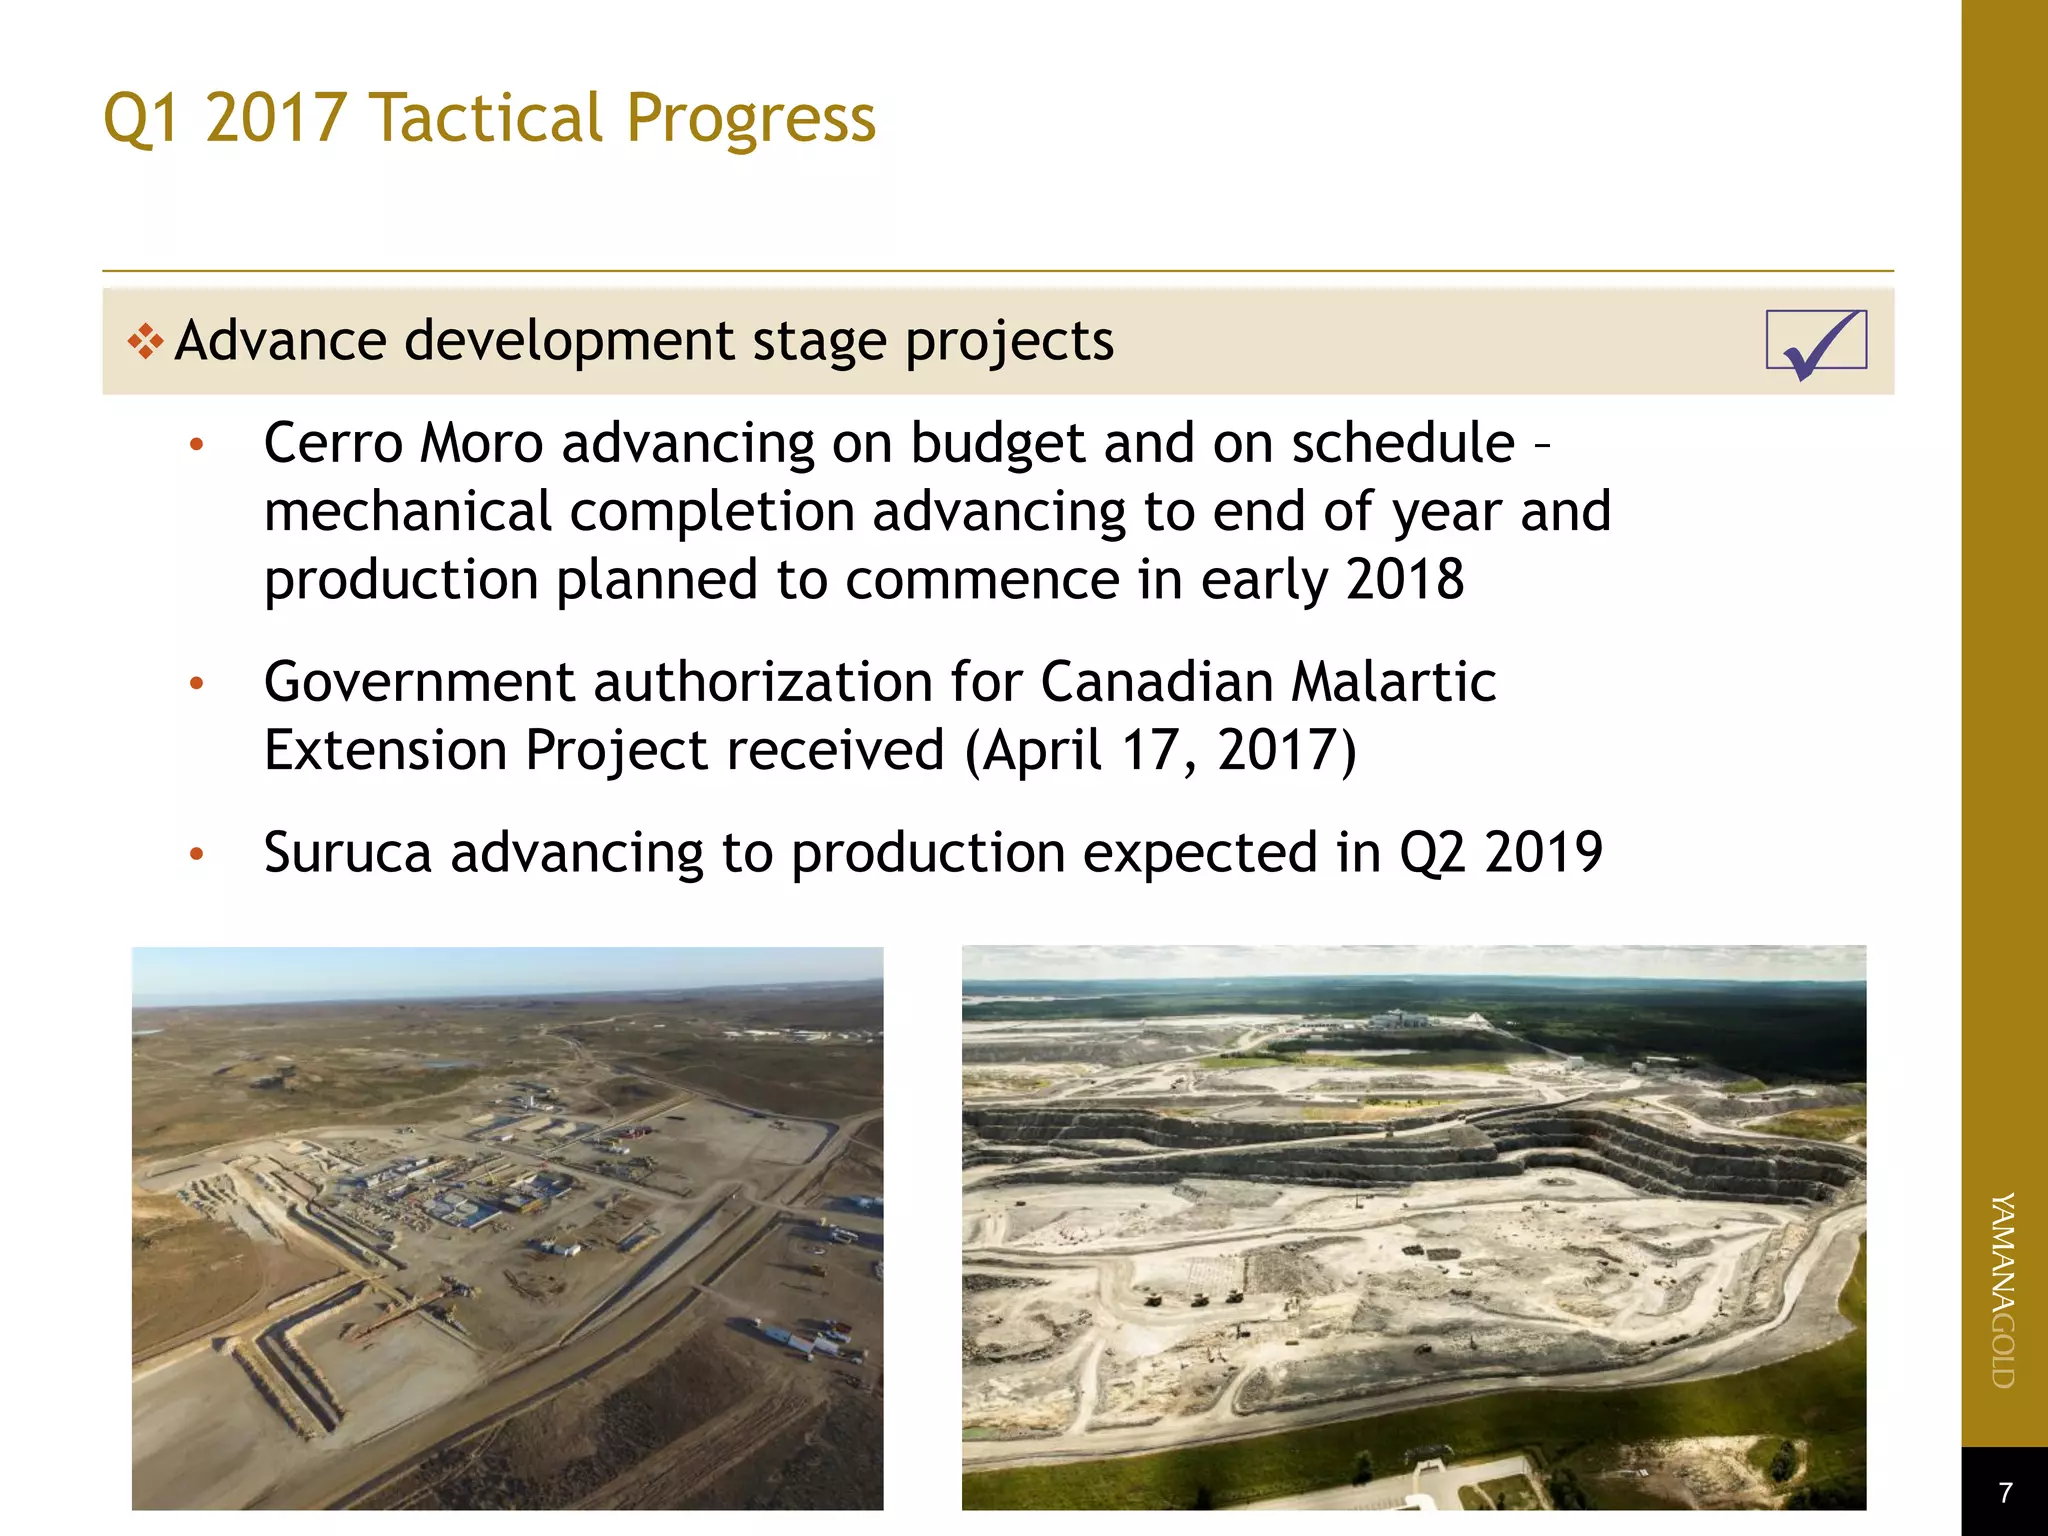
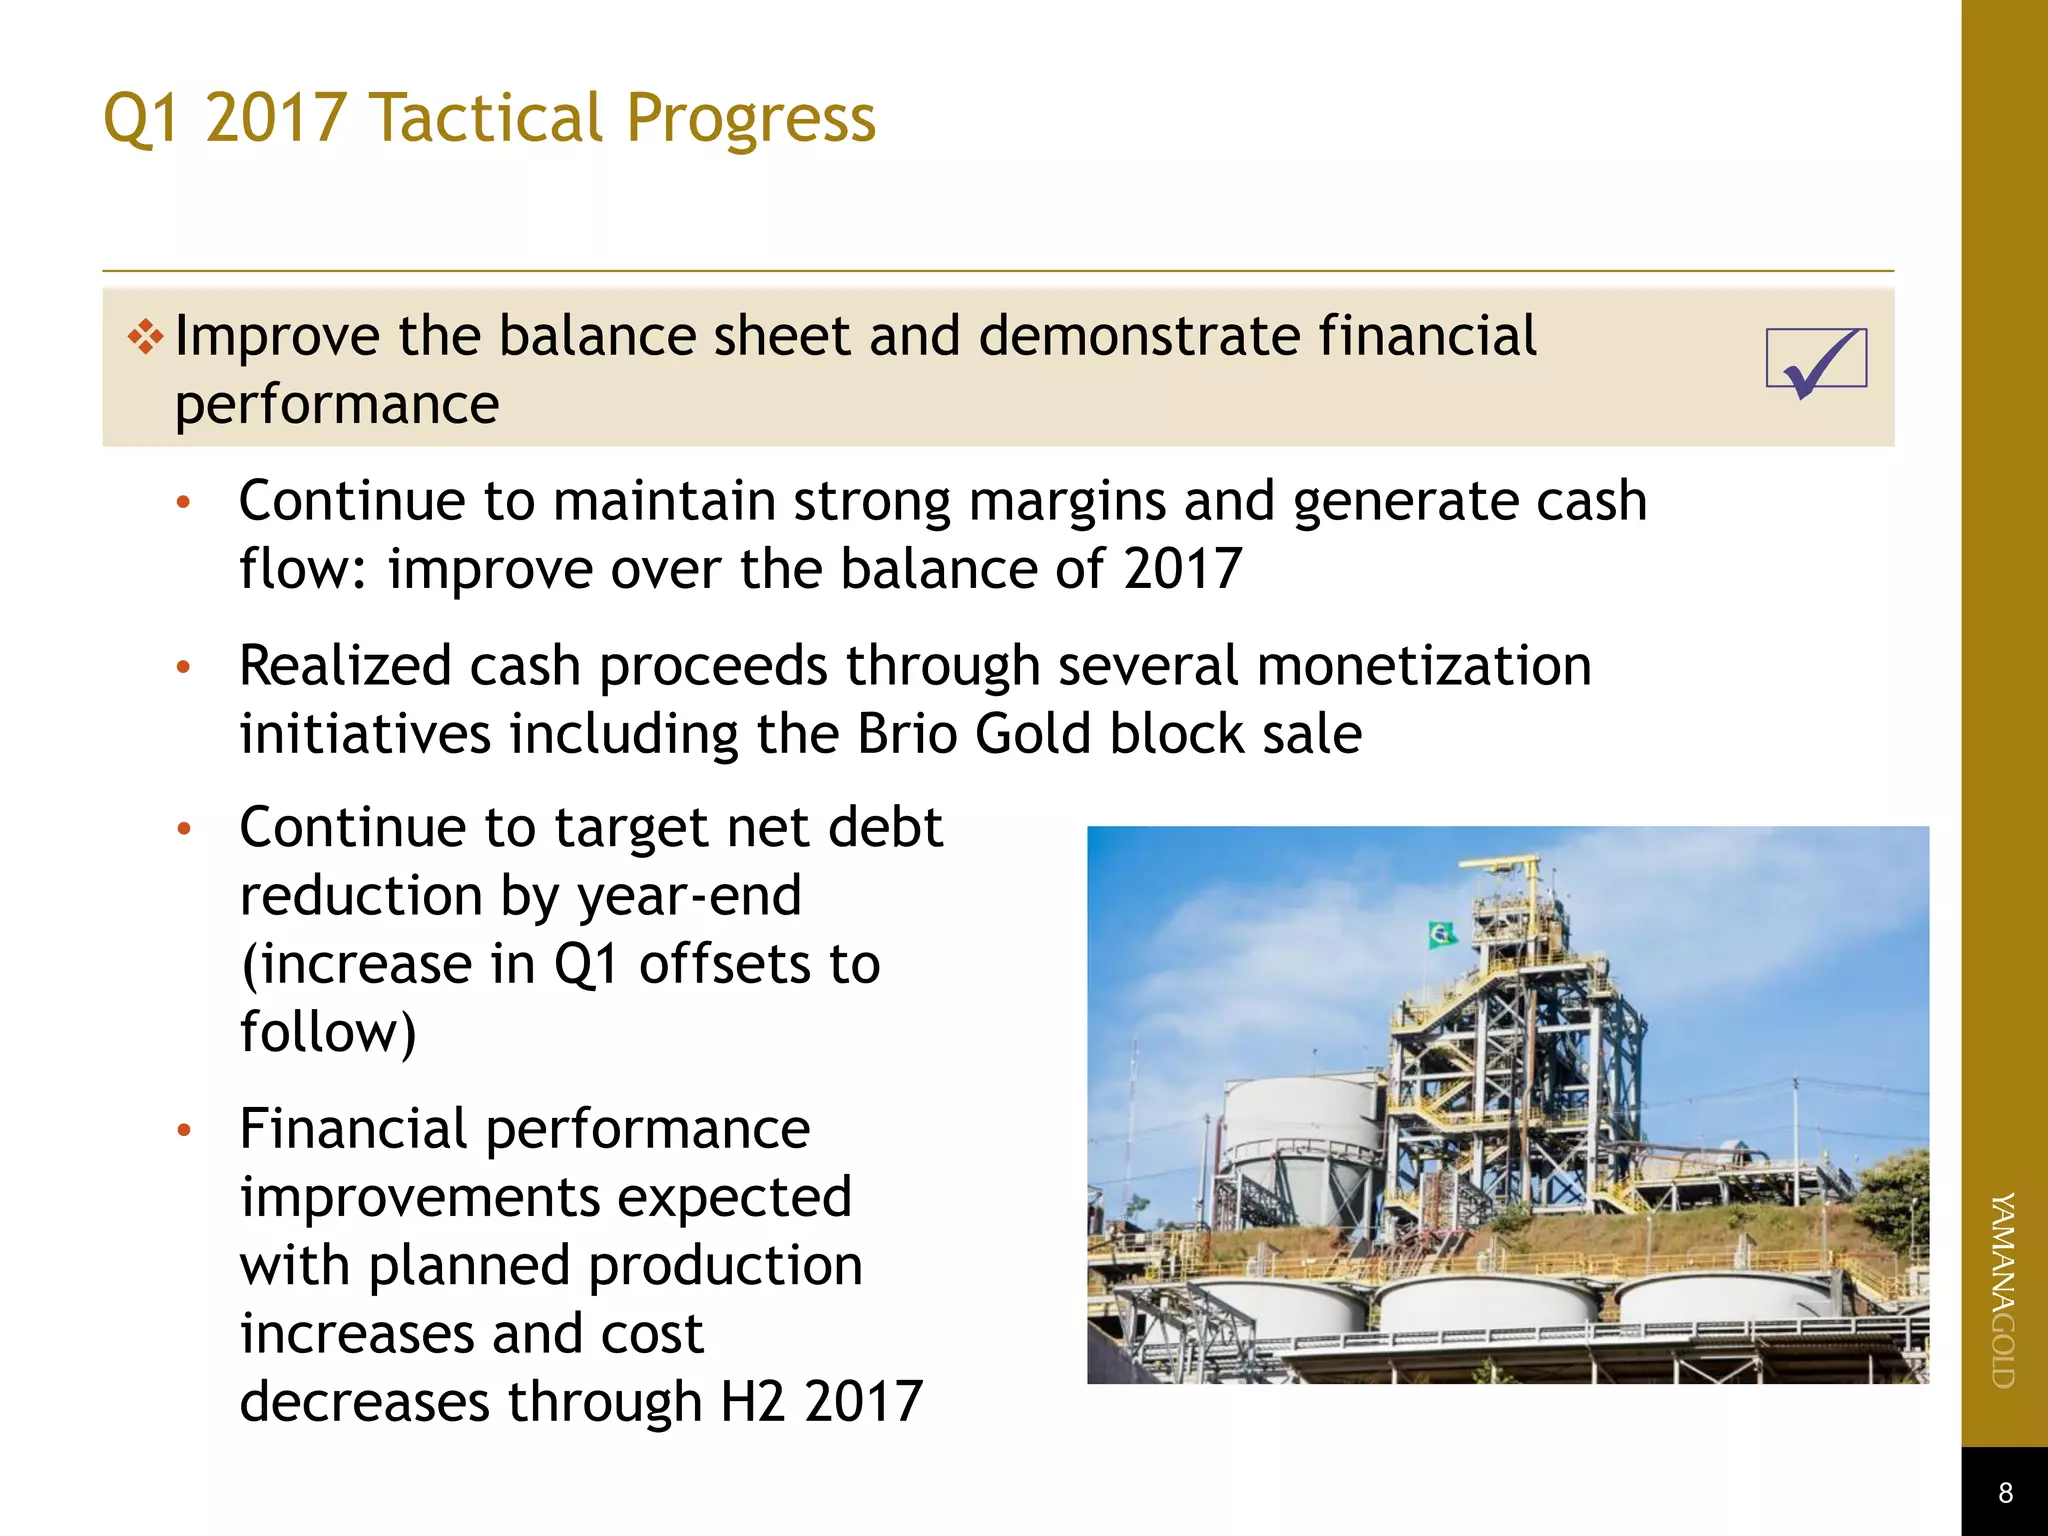
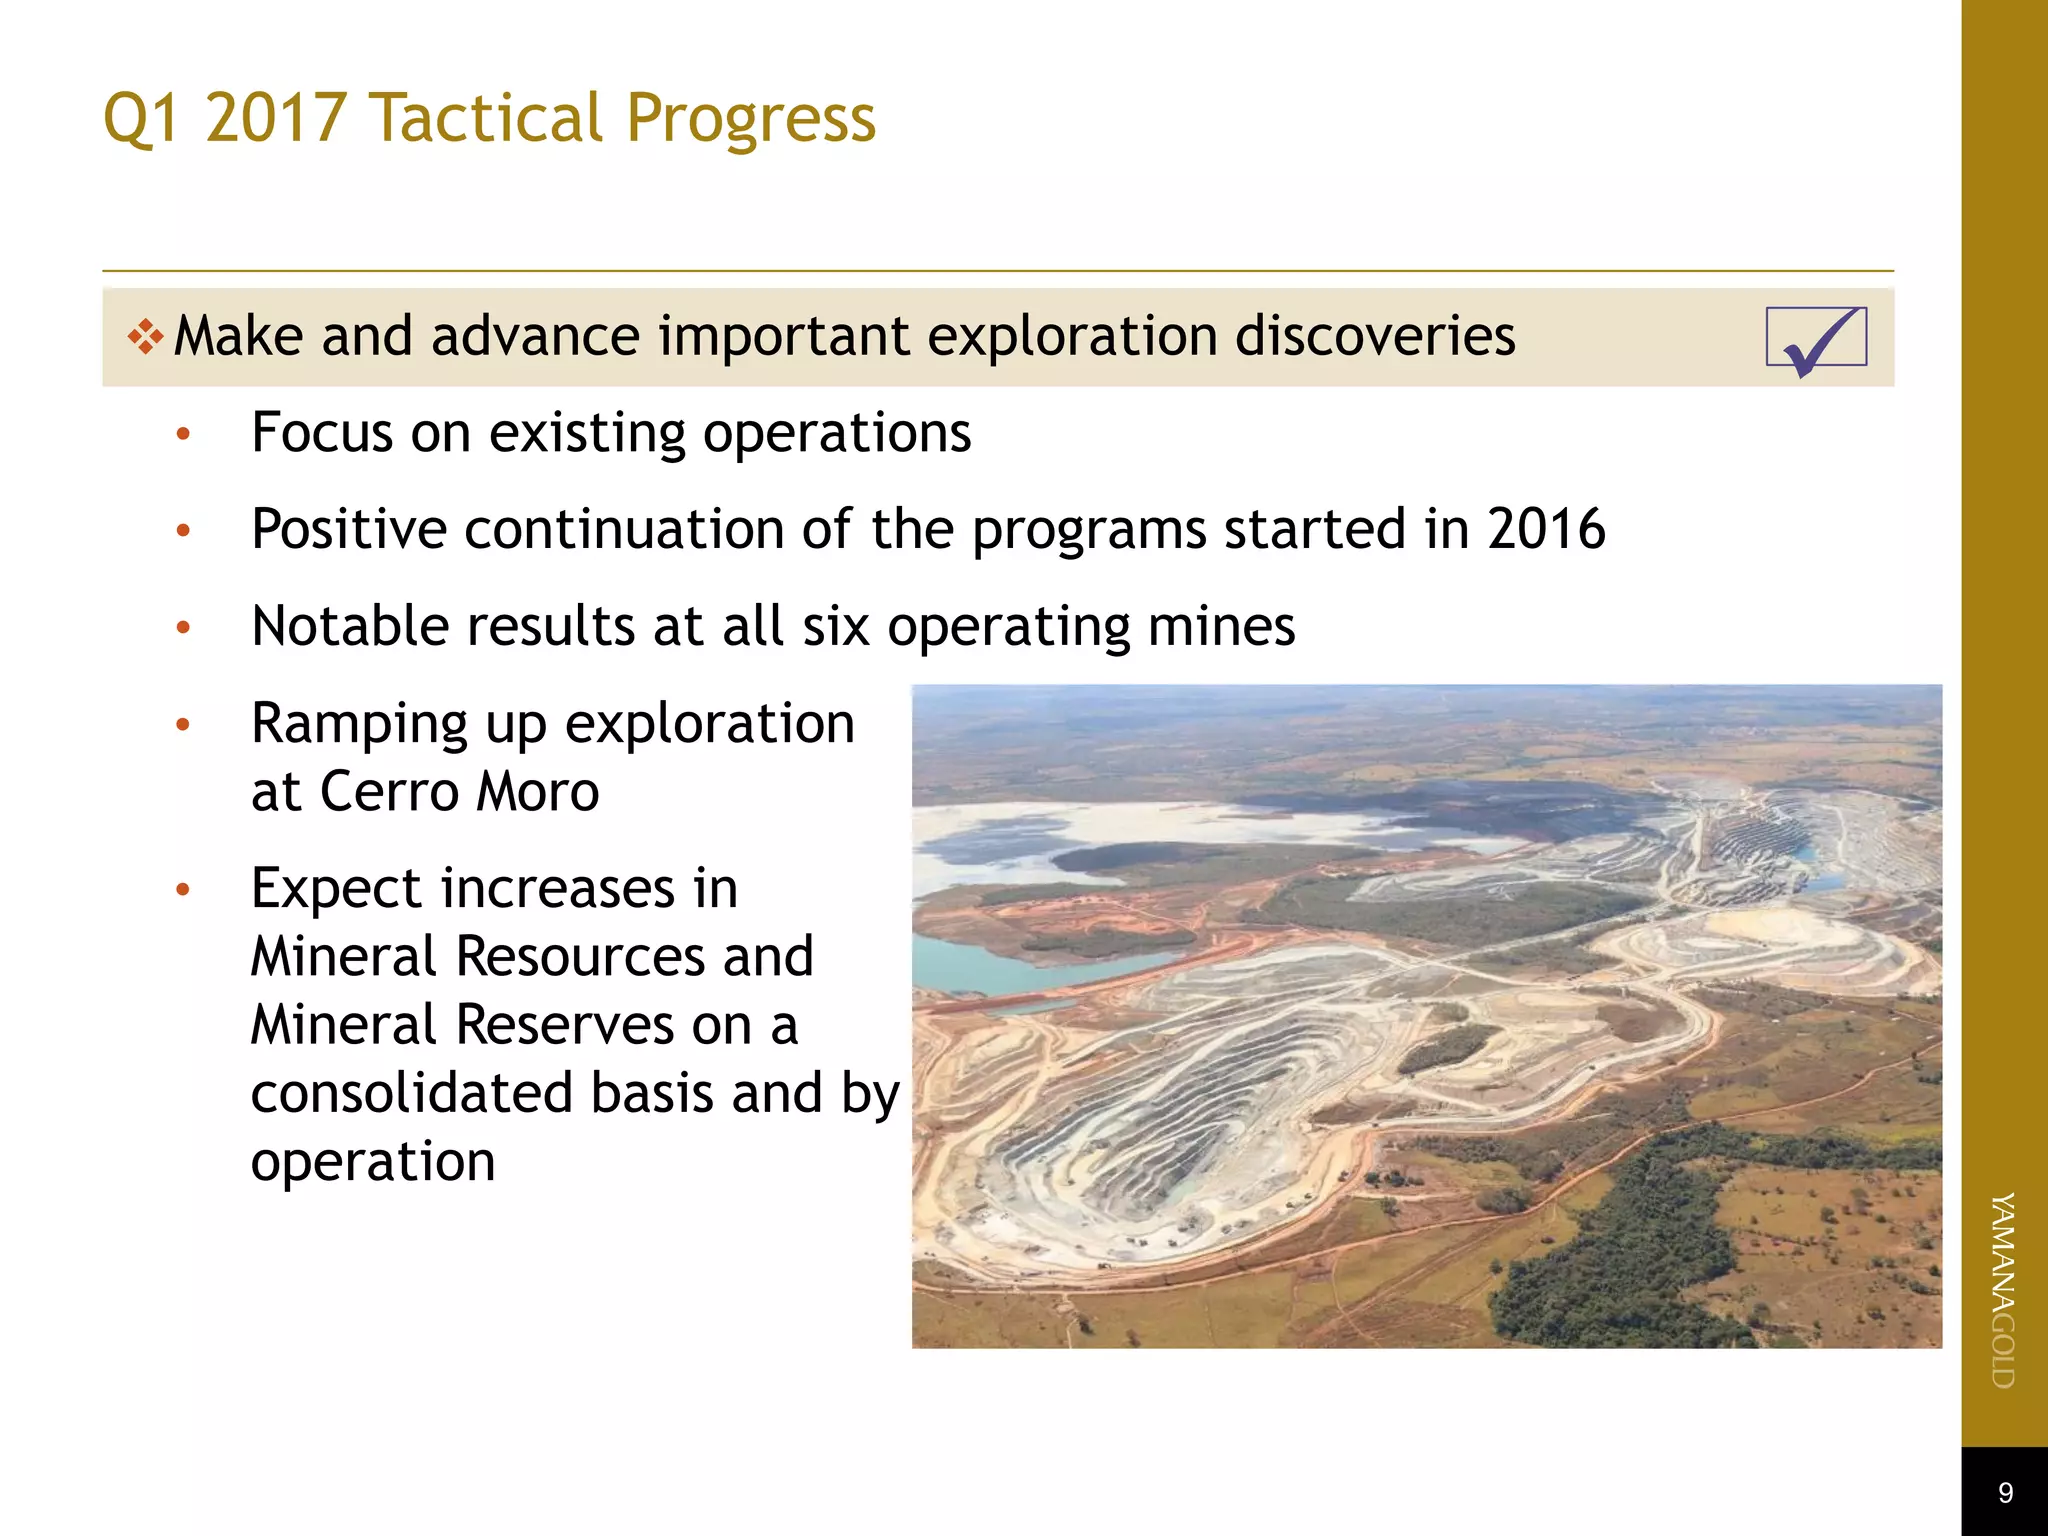
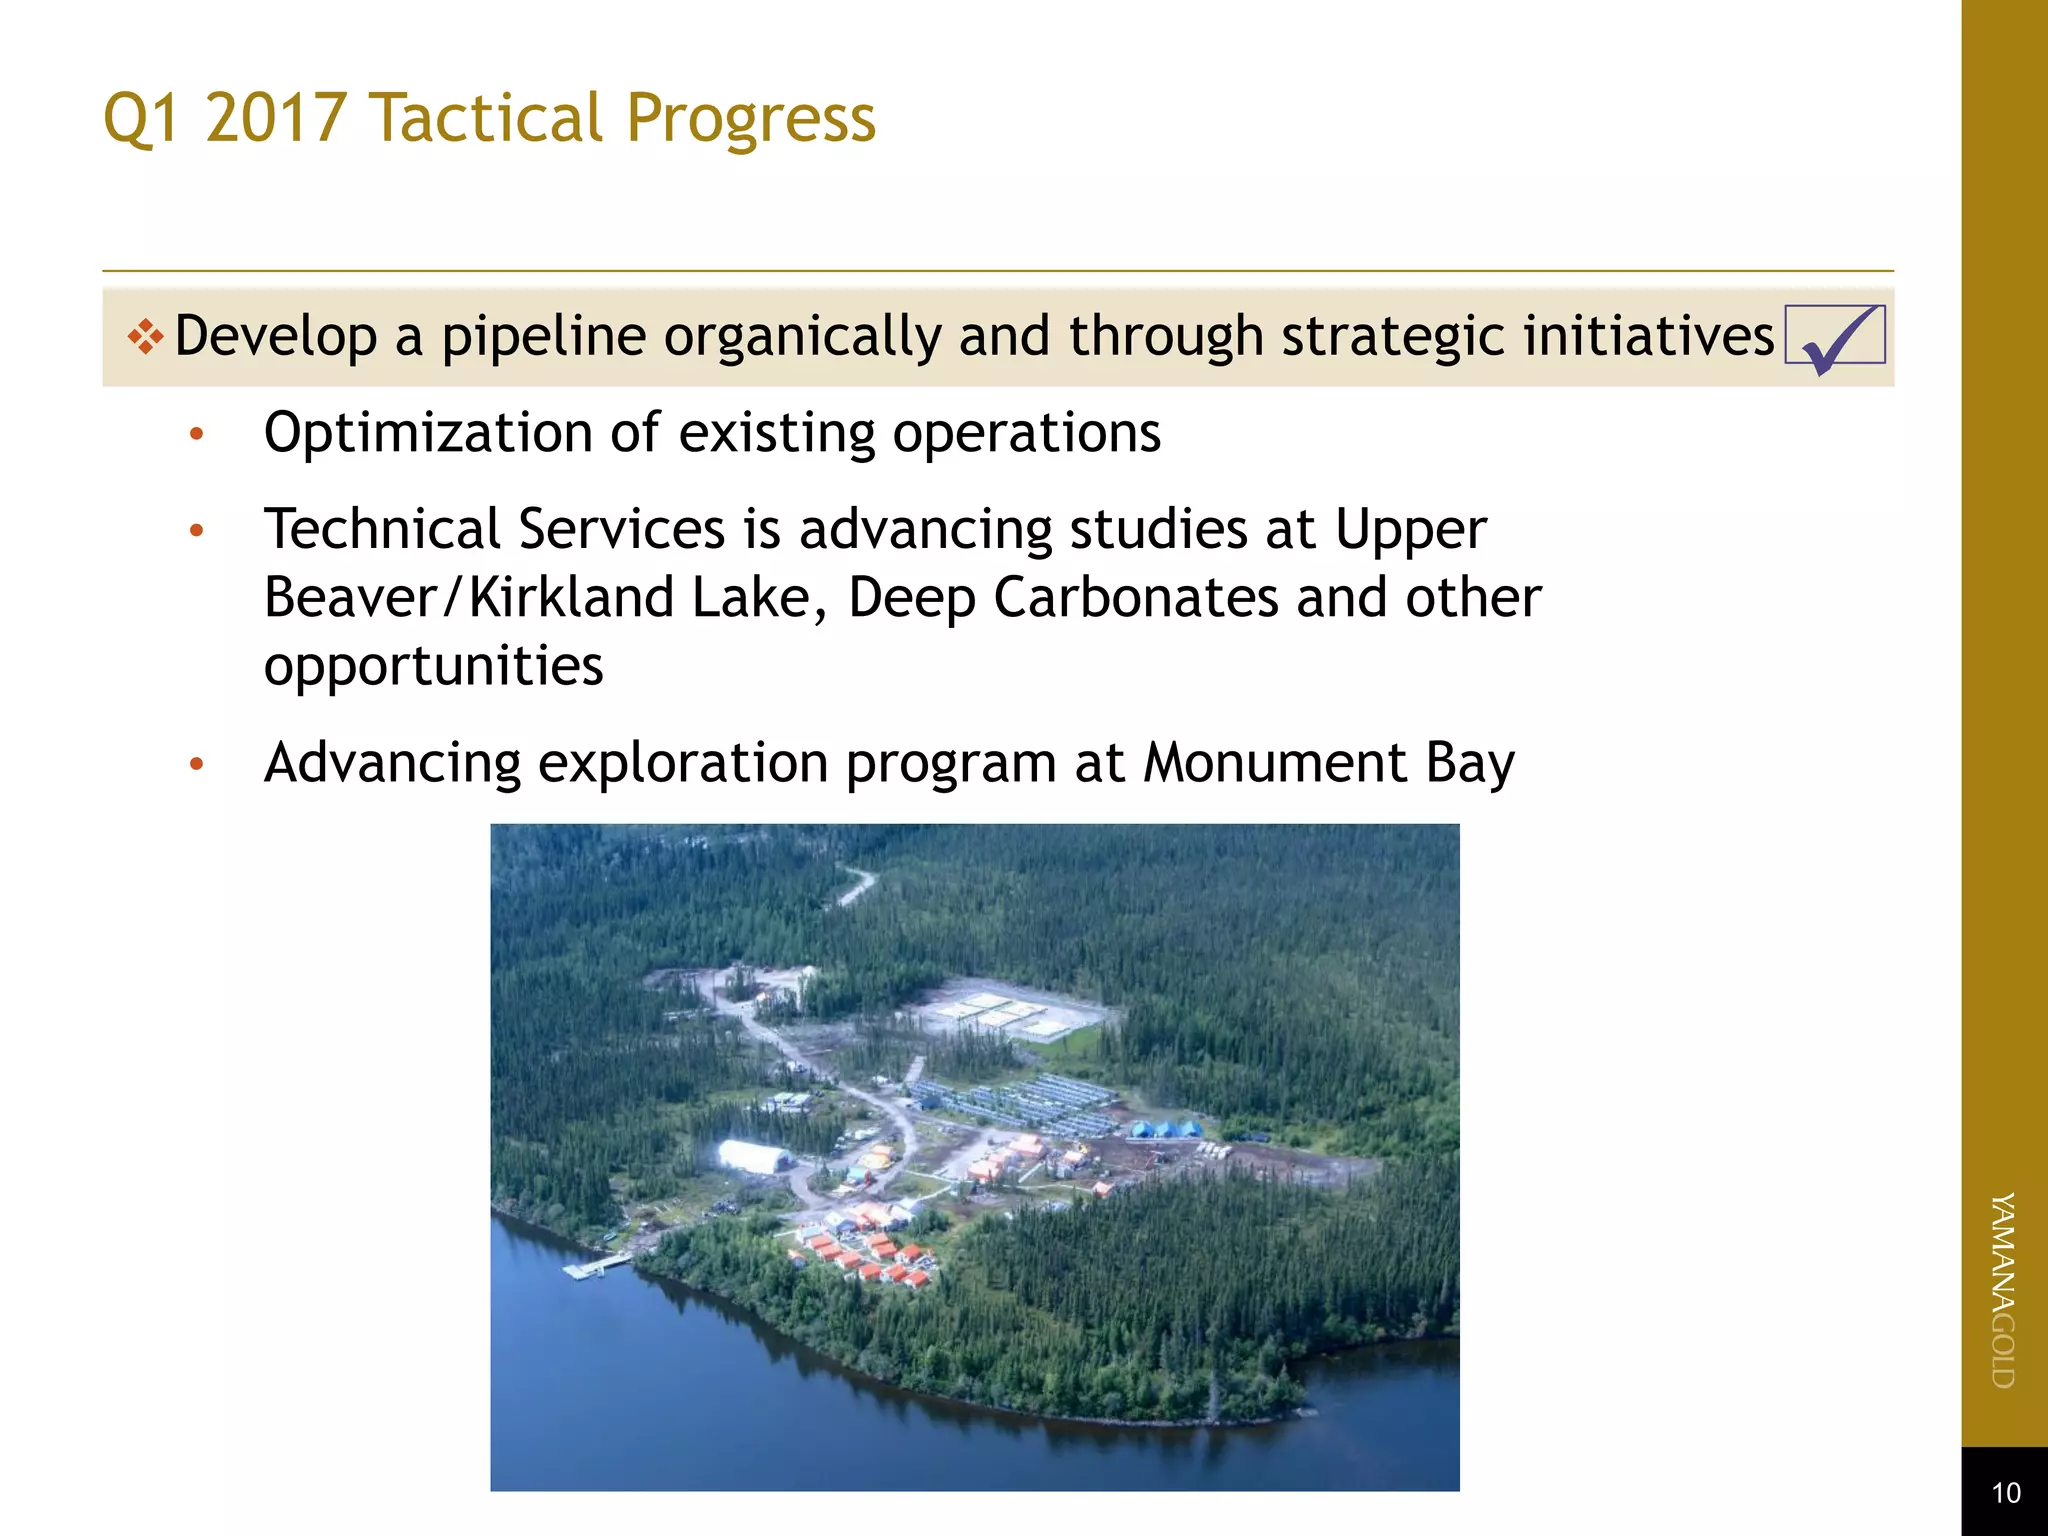
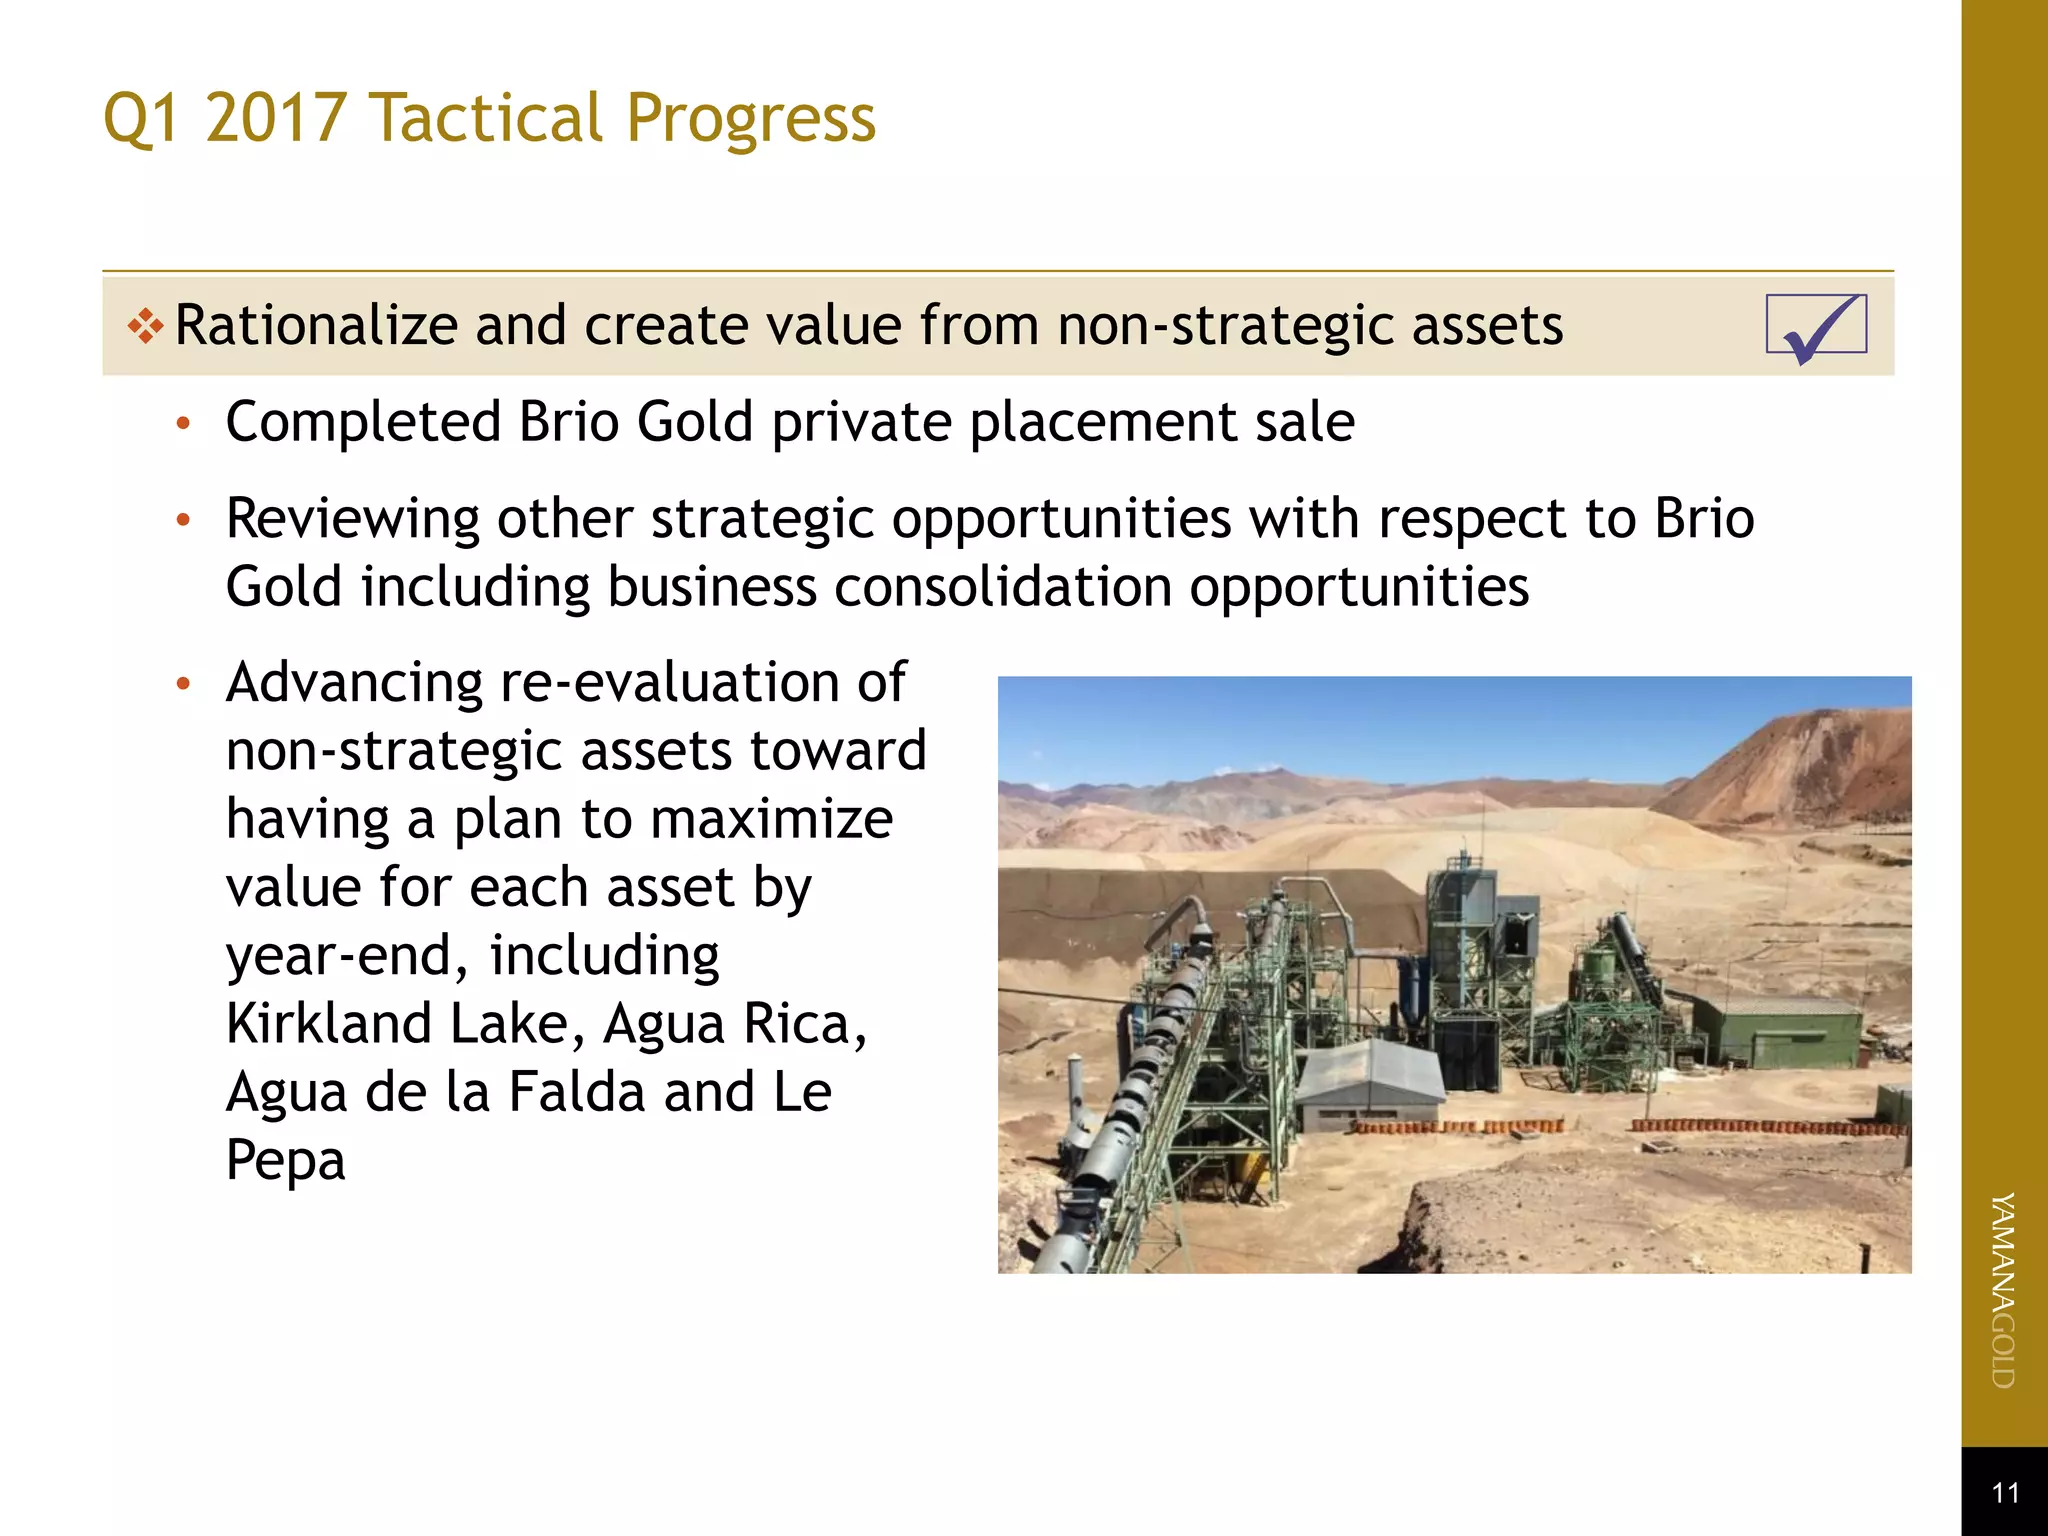
- It discusses Yamana's progress on its six pillar approach, including improving operations, advancing development projects, strengthening its balance sheet, making exploration discoveries, growing its pipeline, and rationalizing non-core assets.
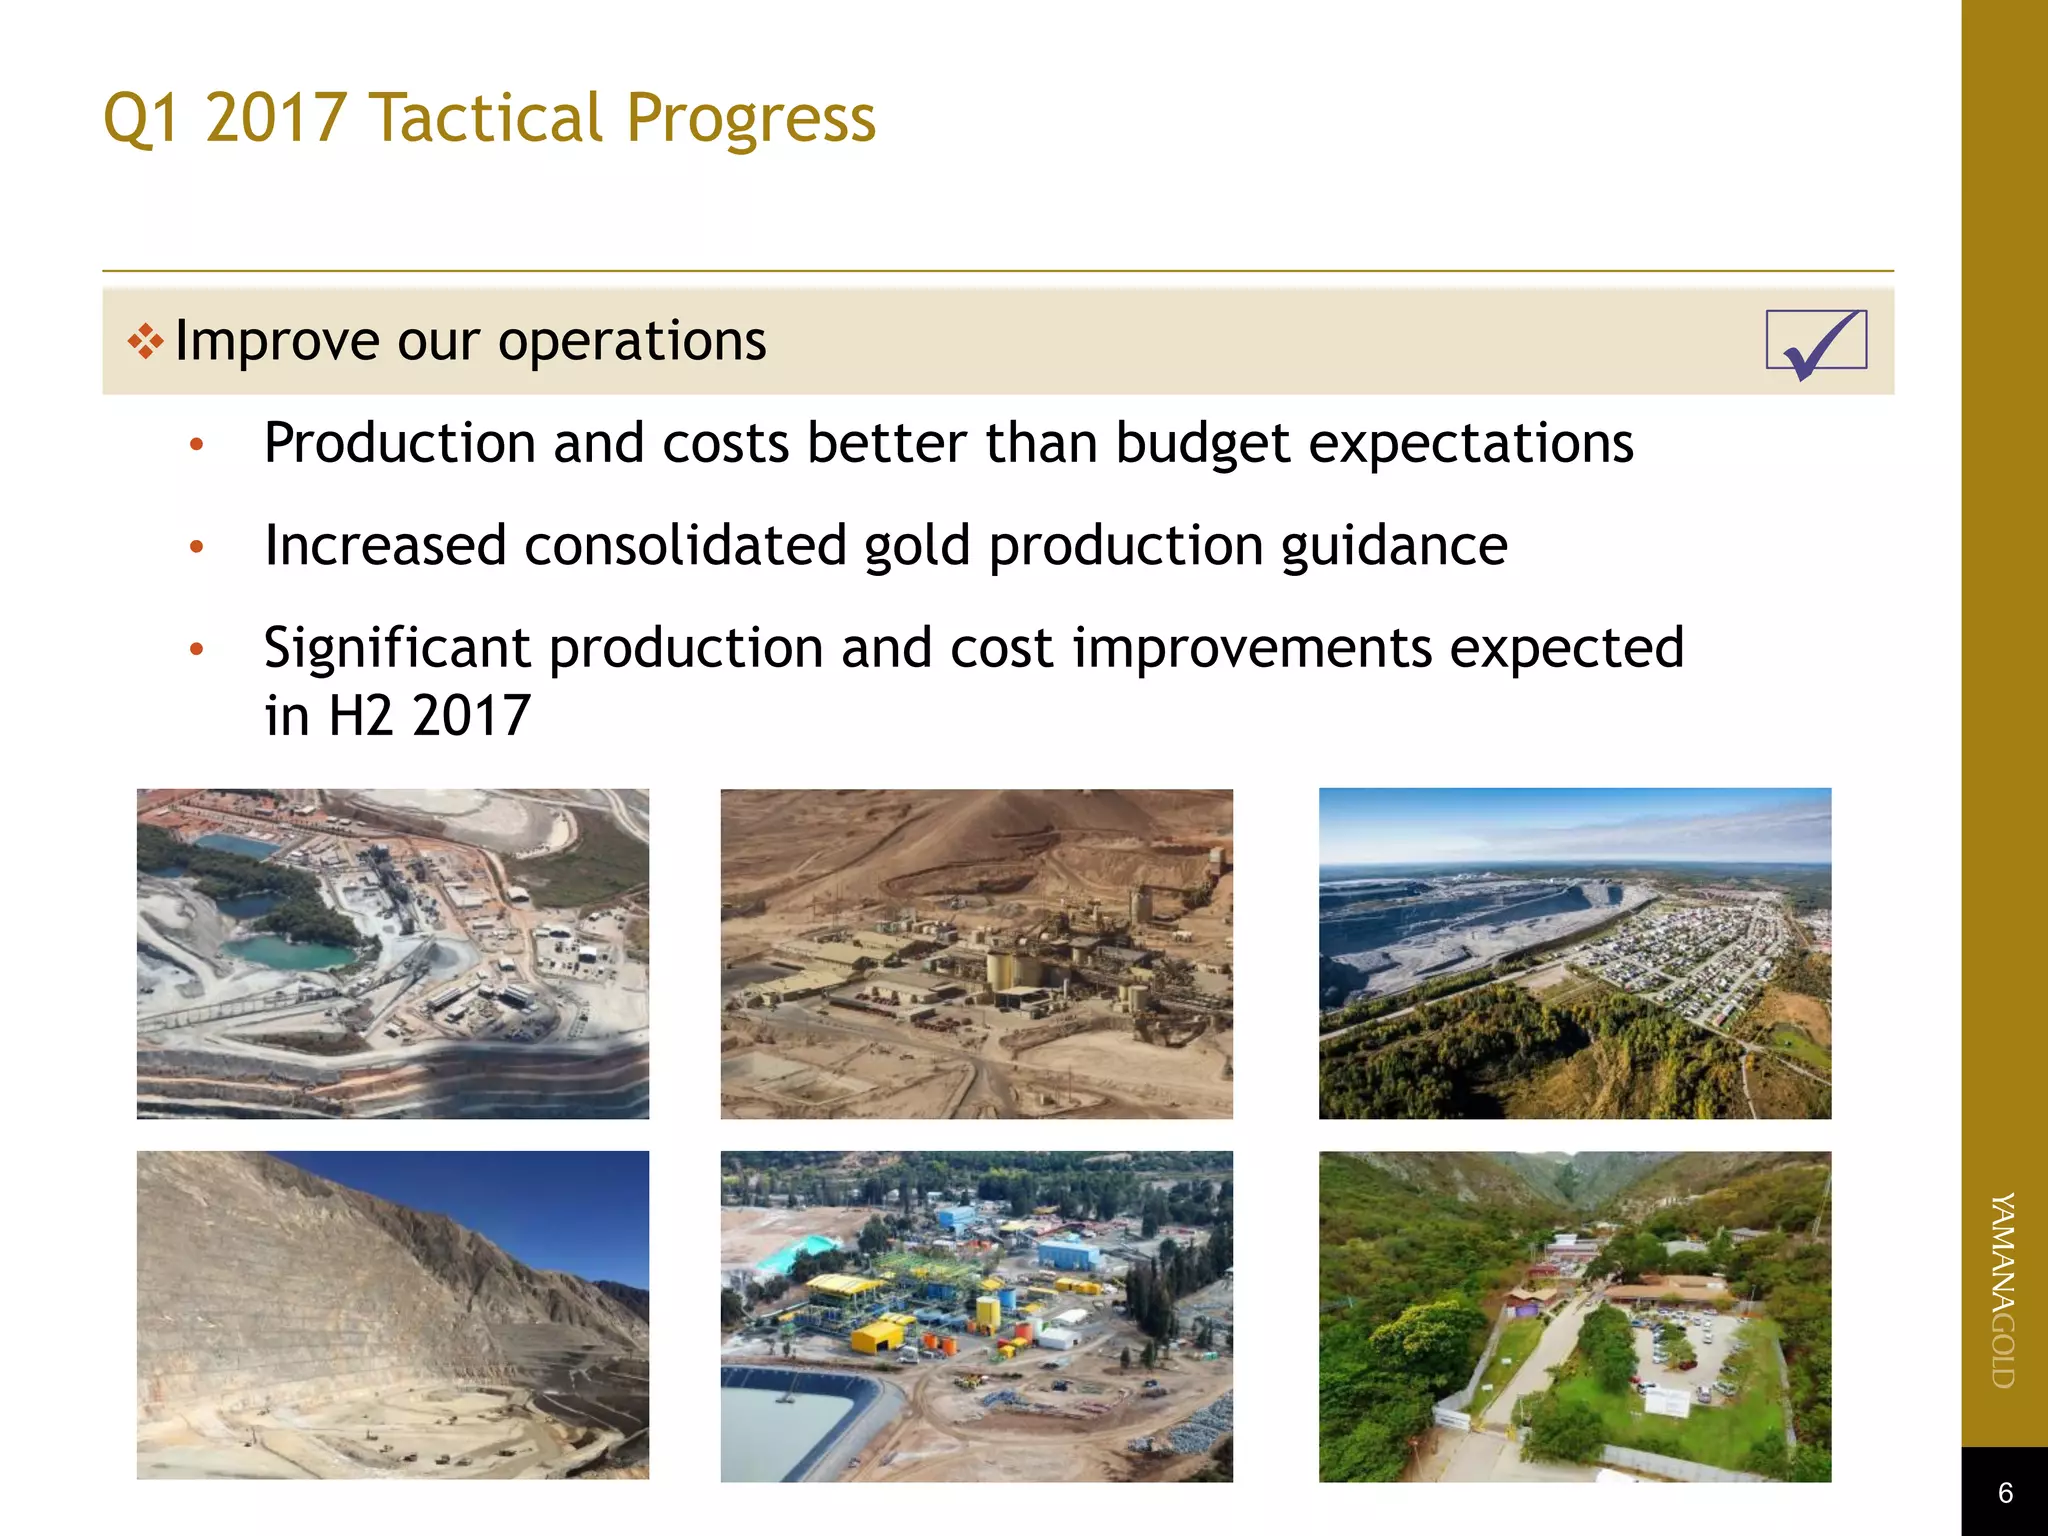
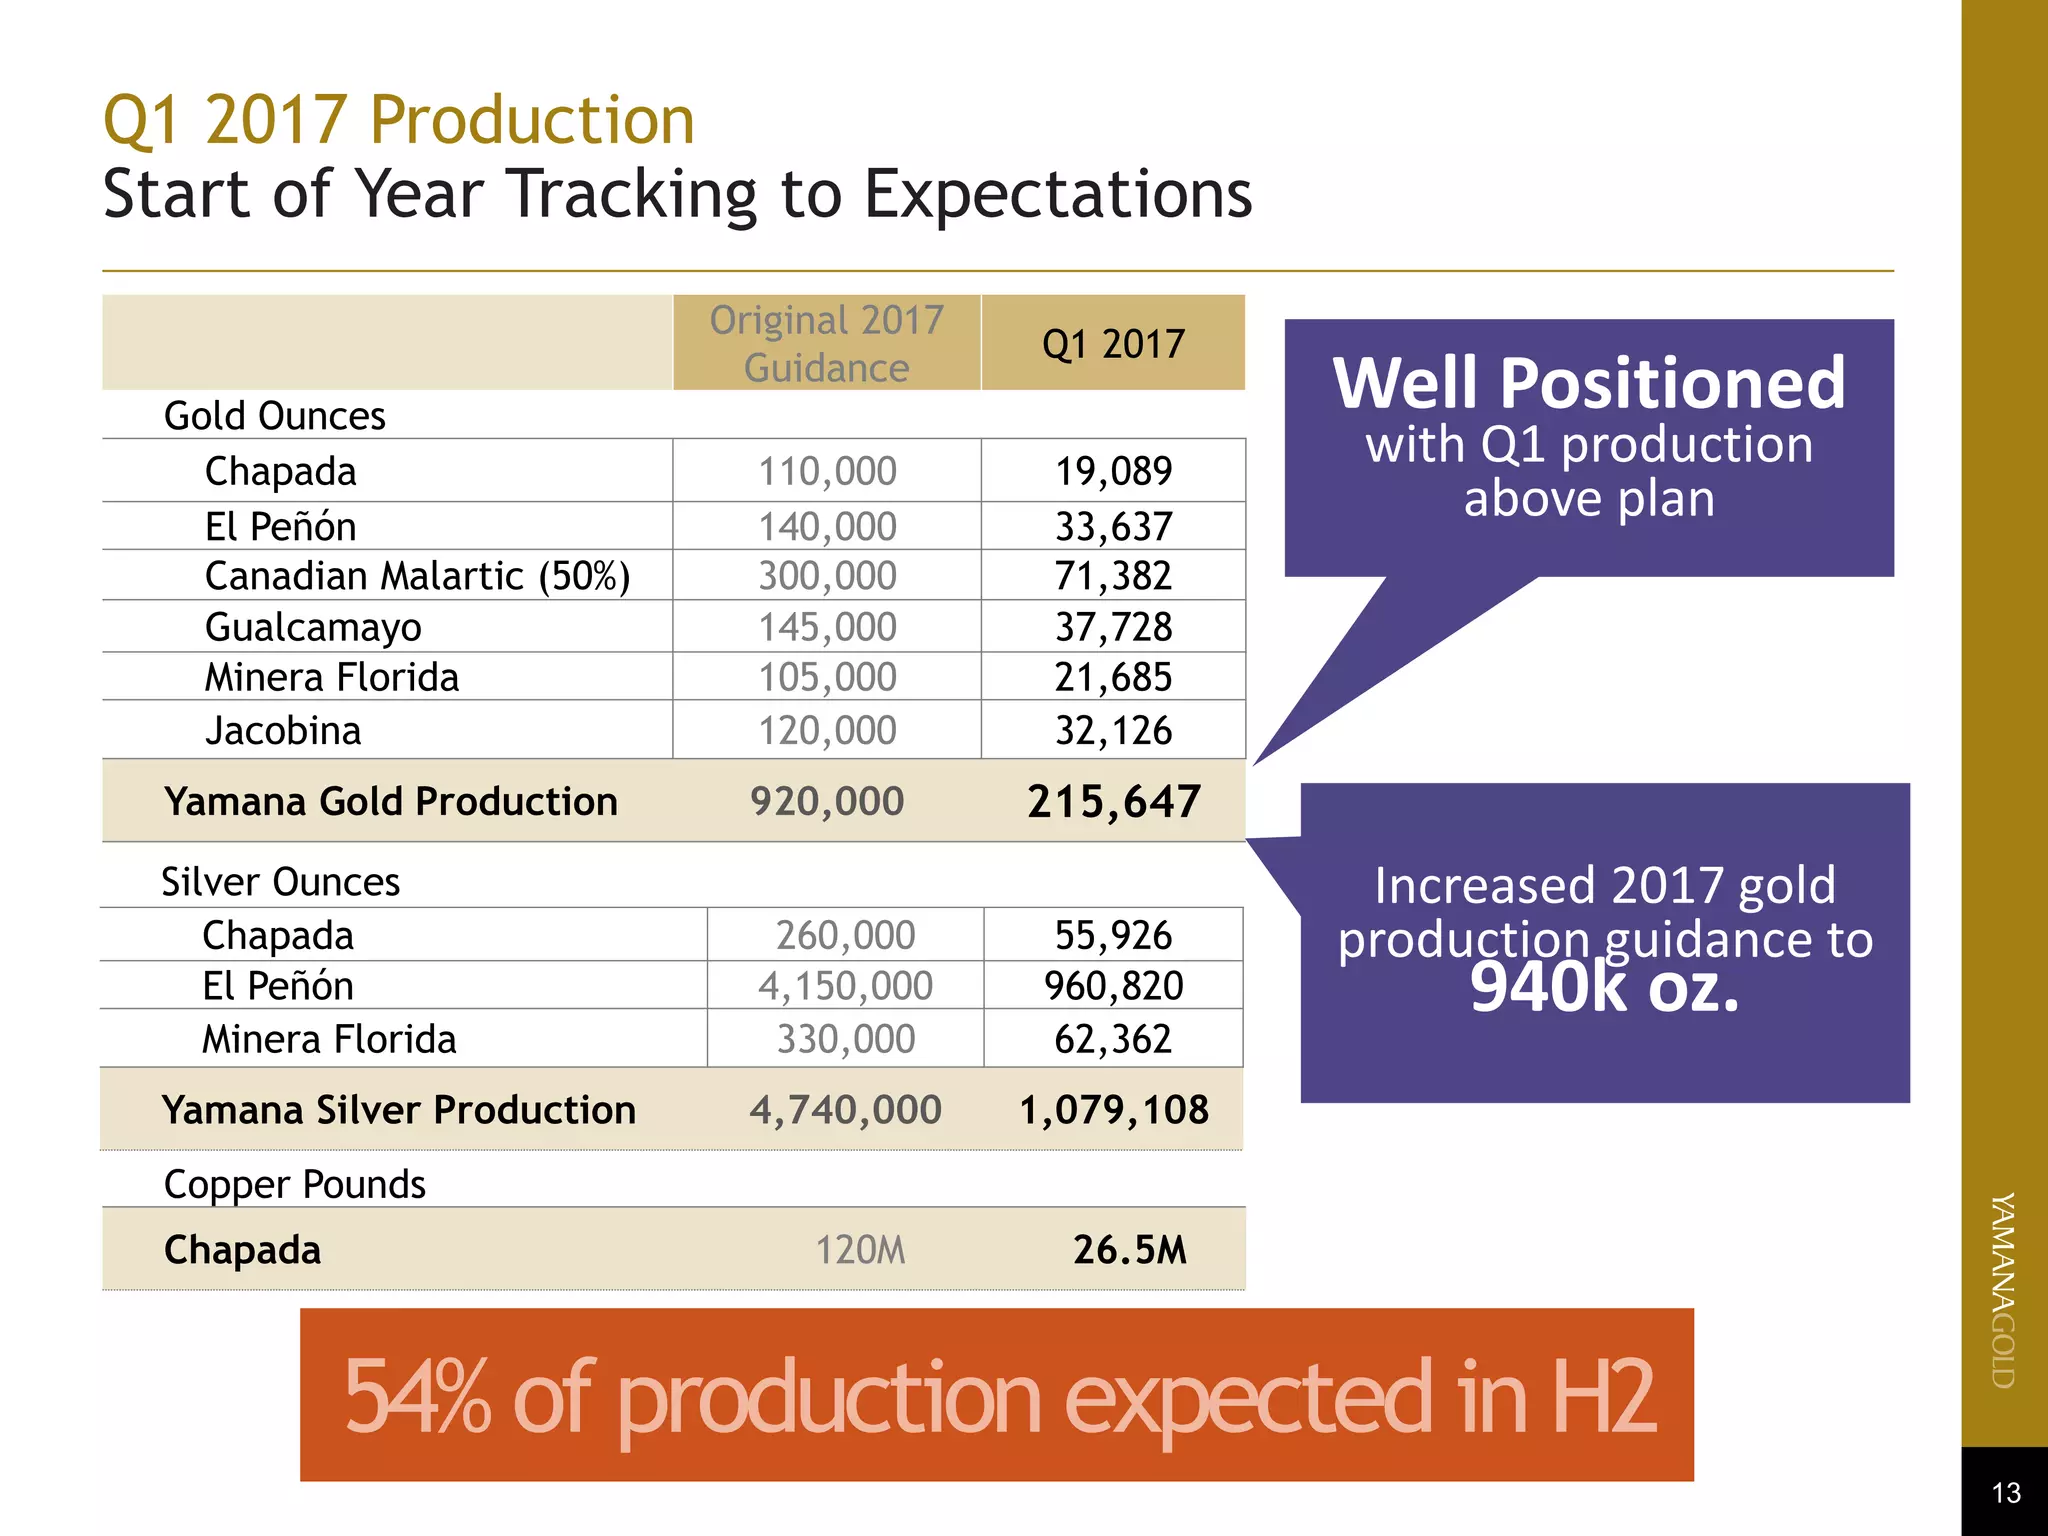
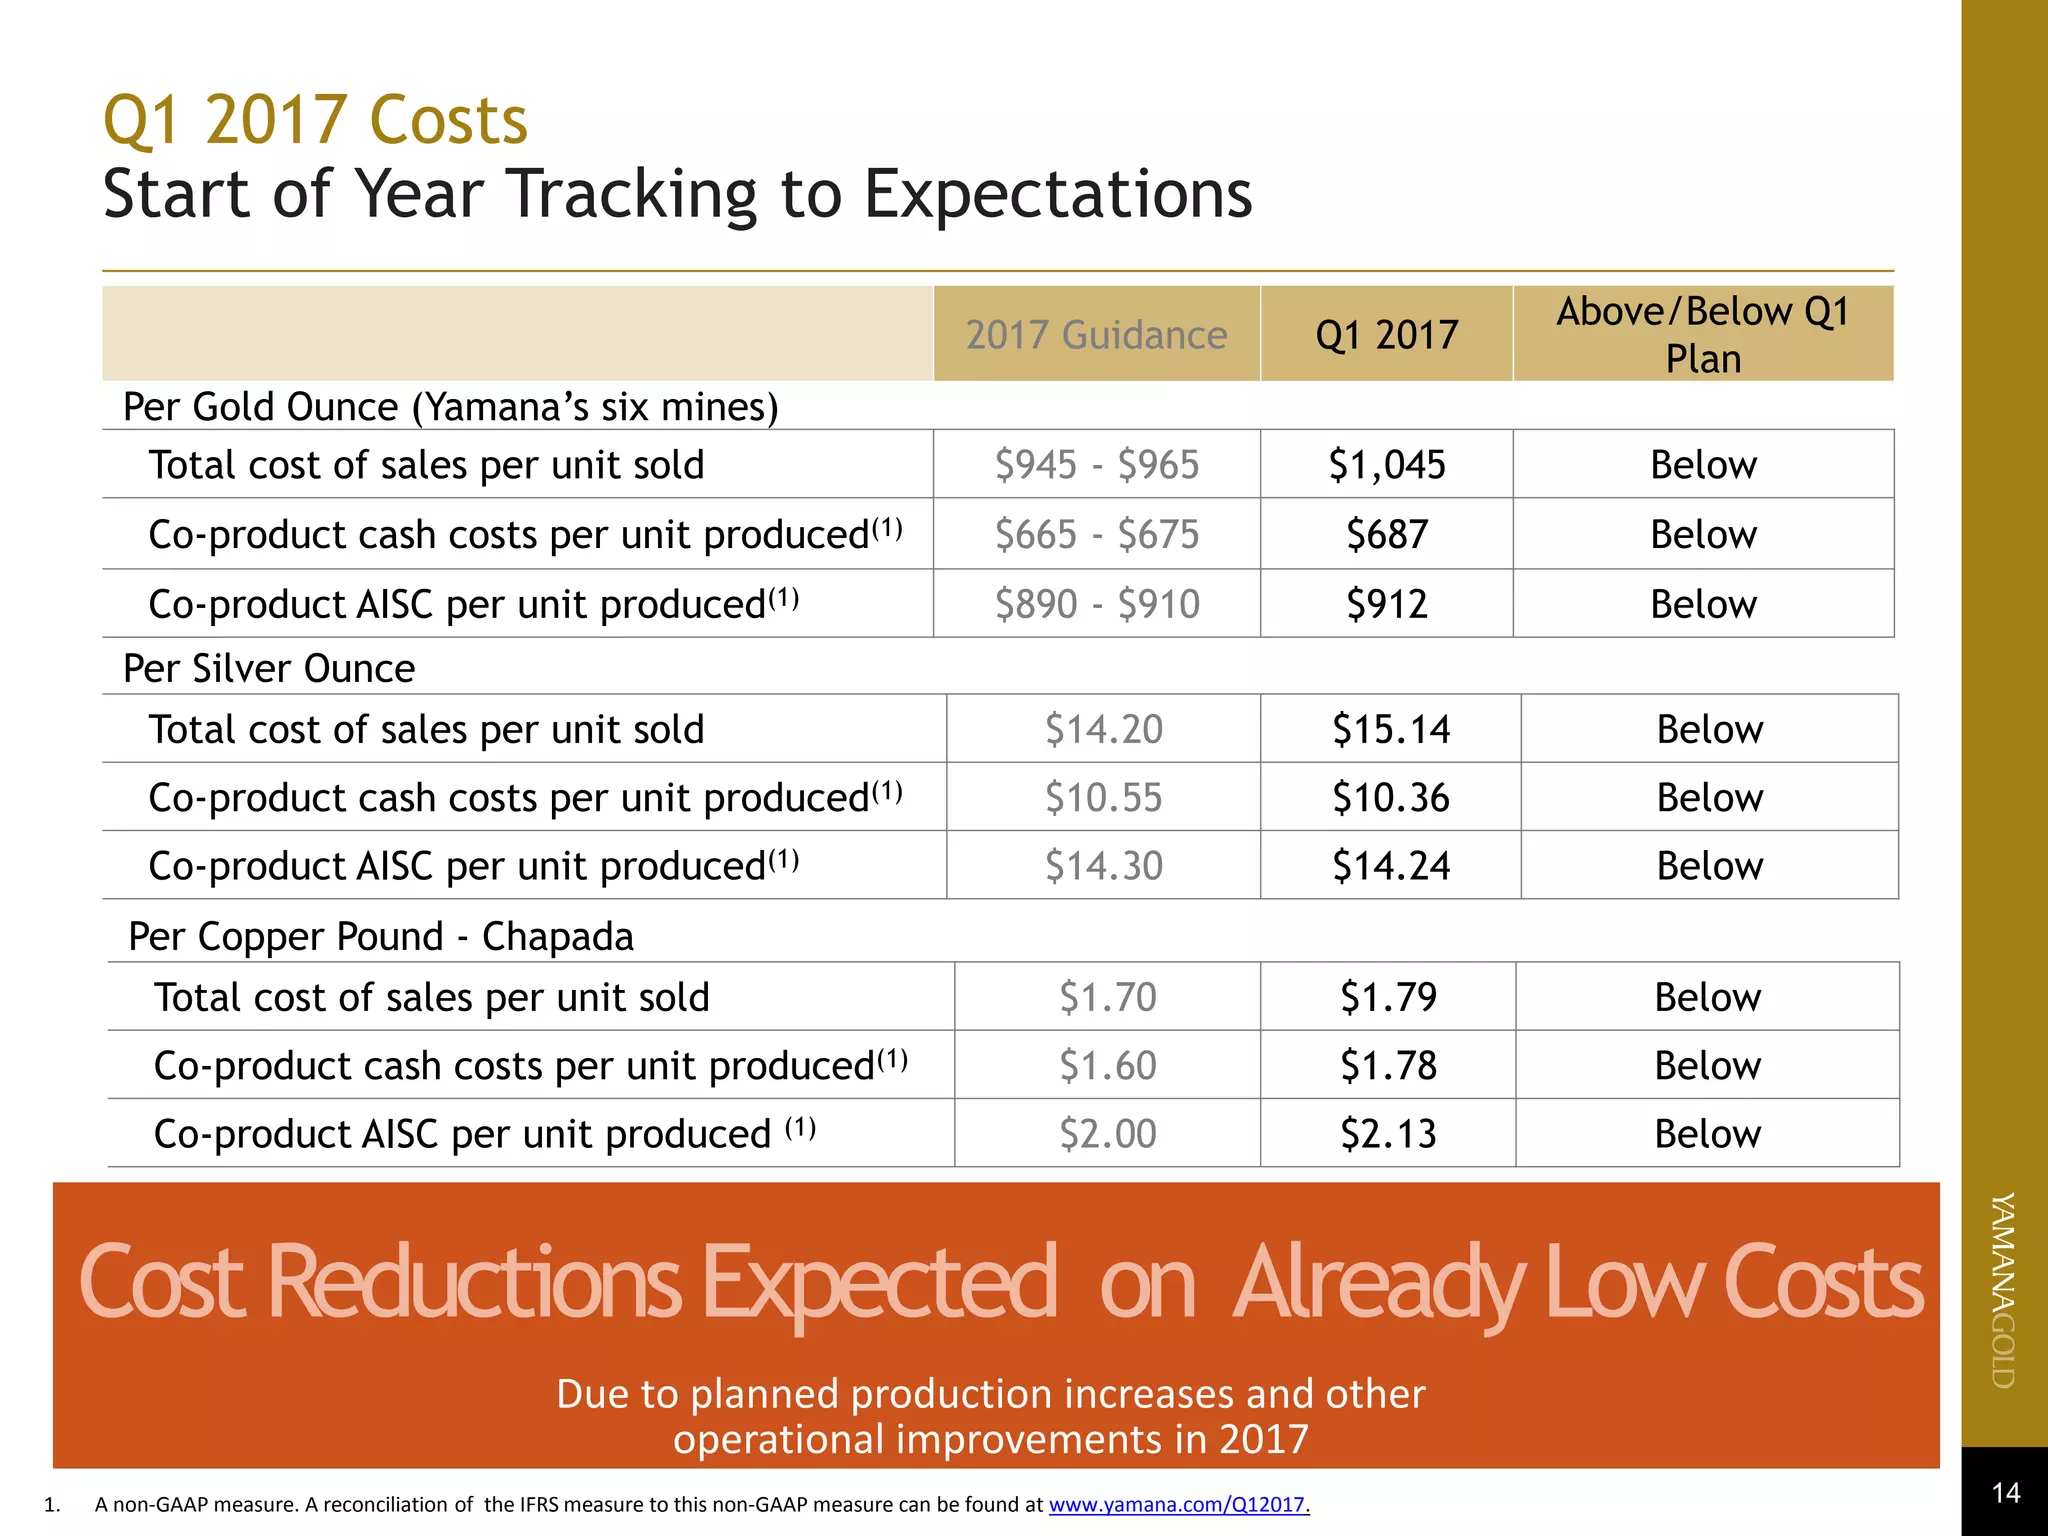
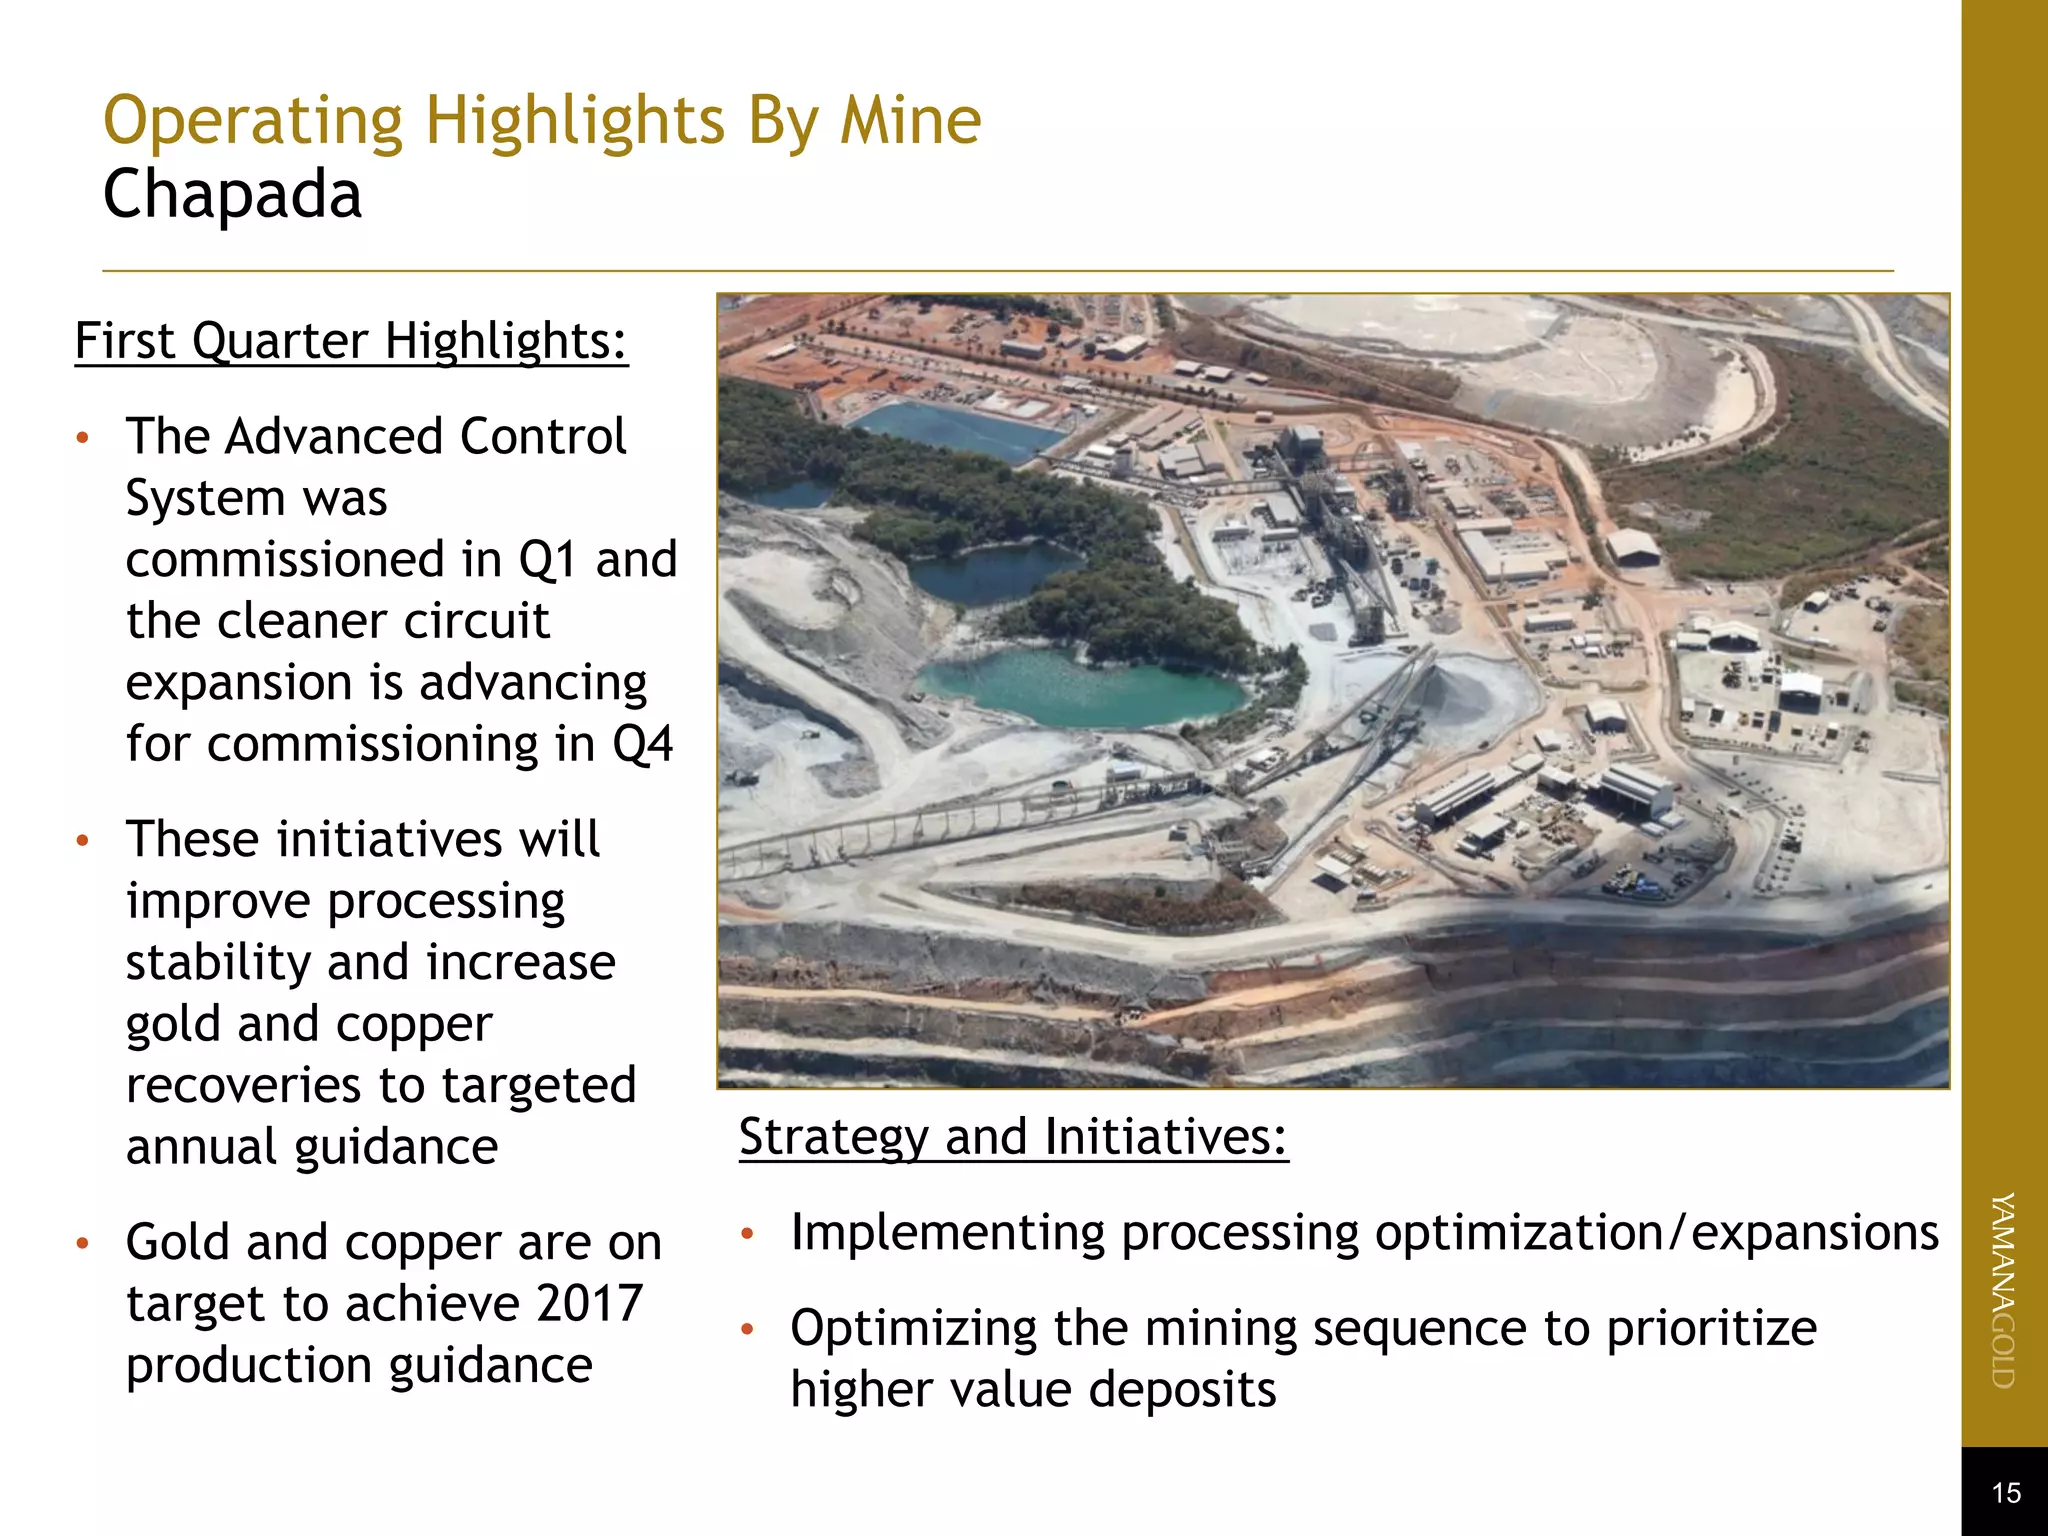
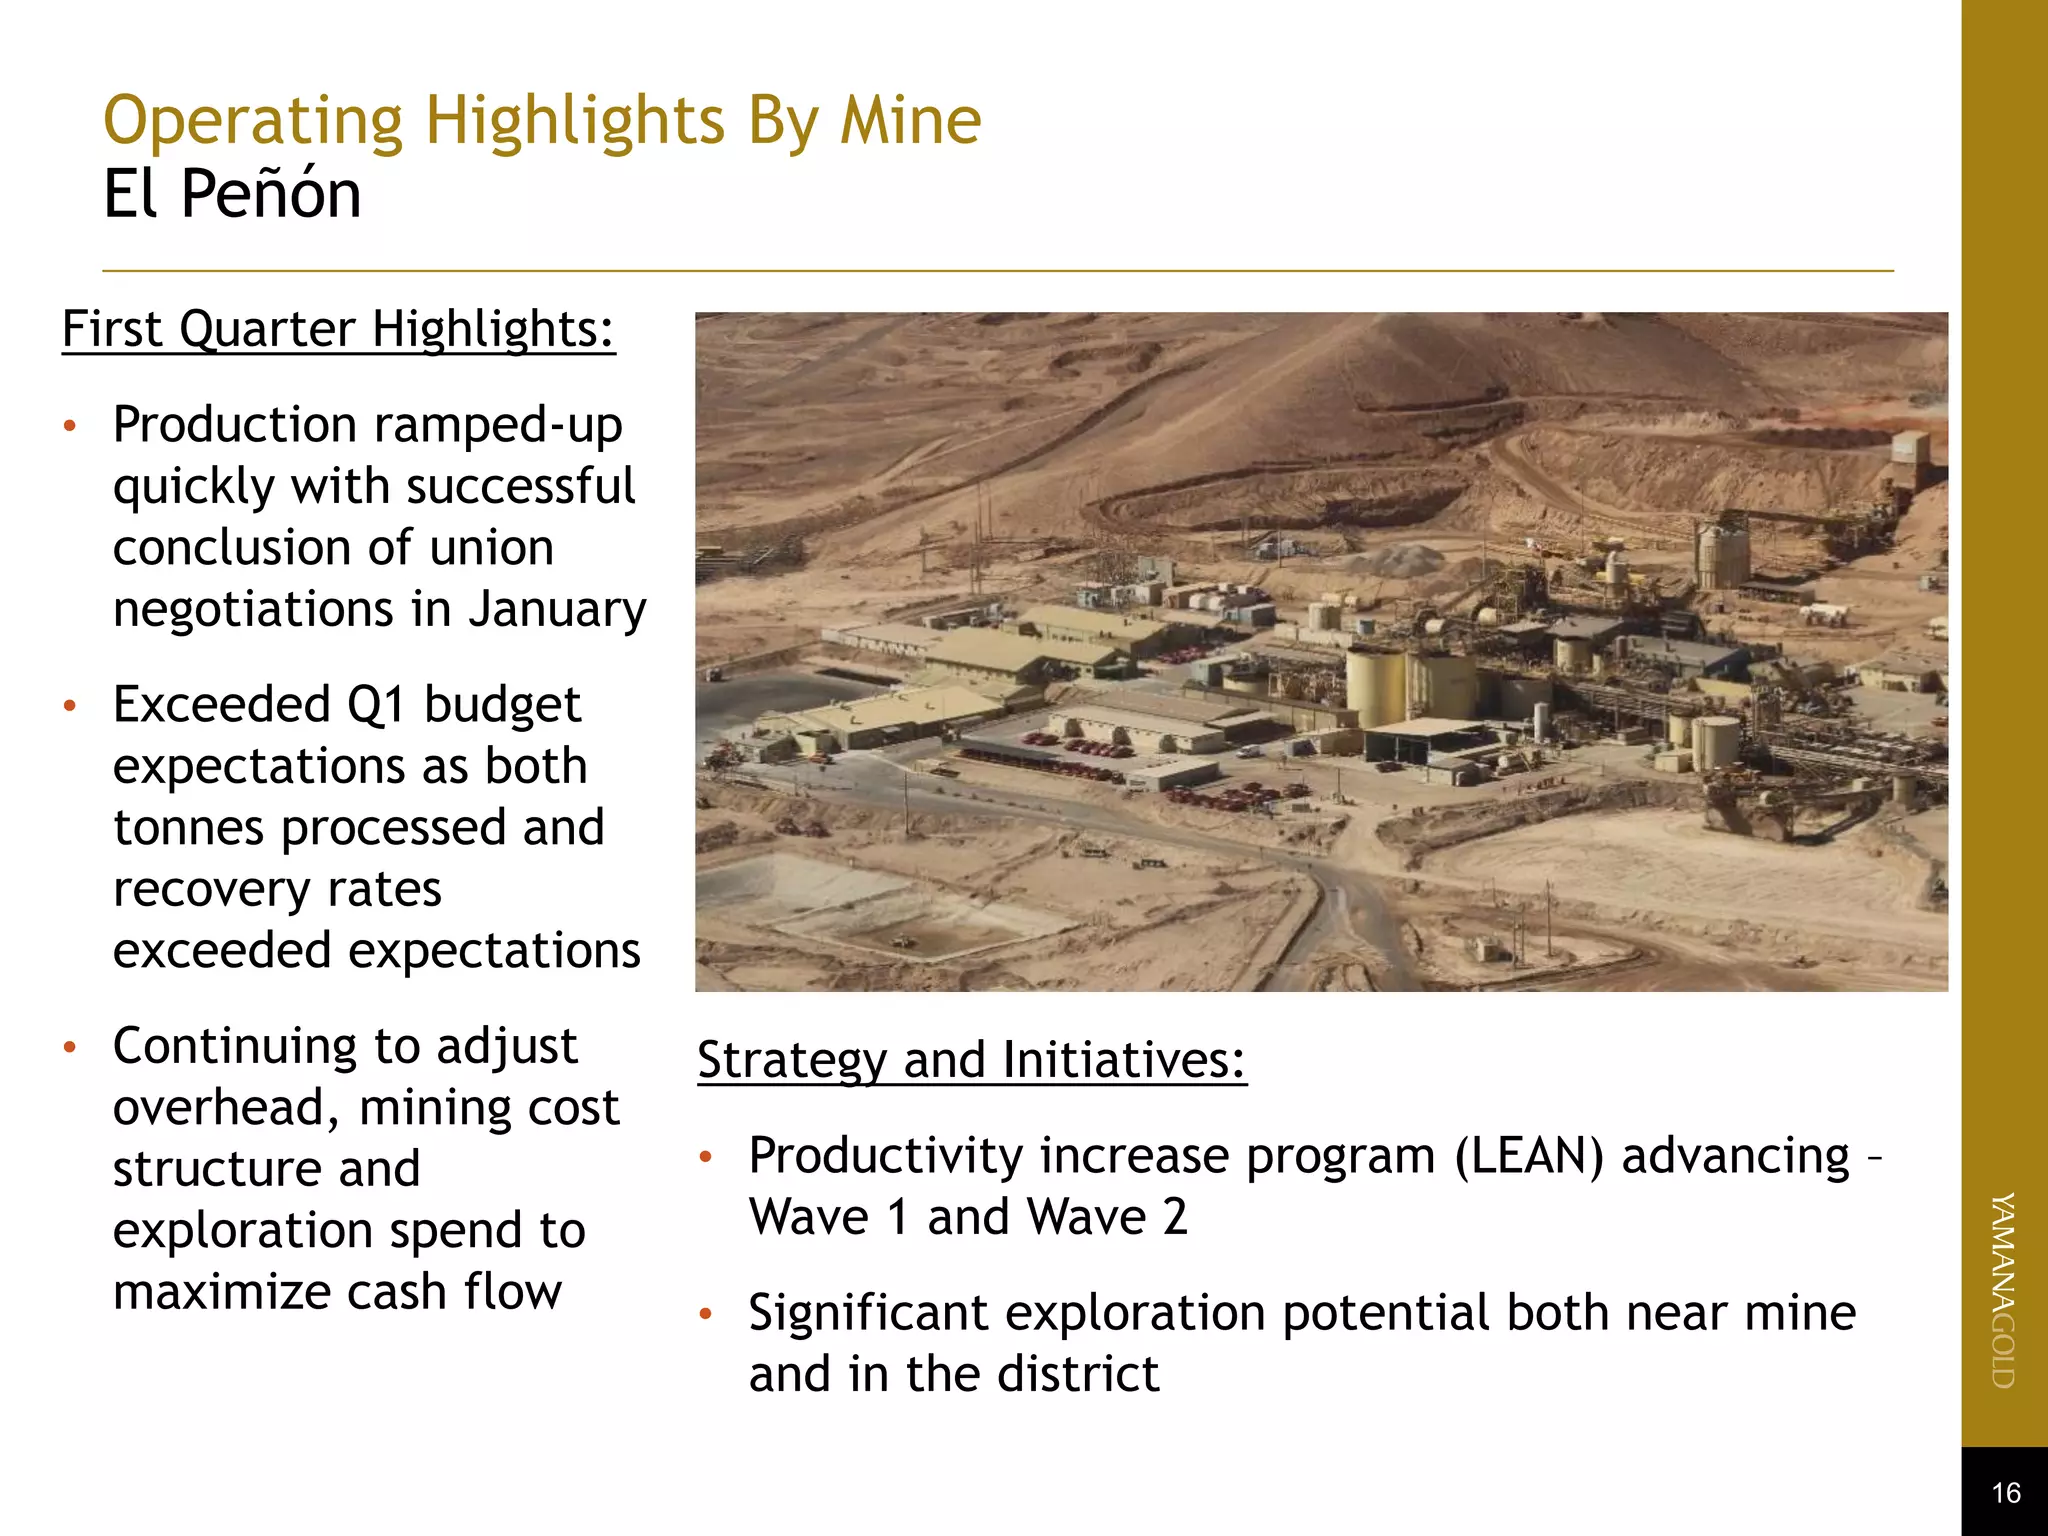
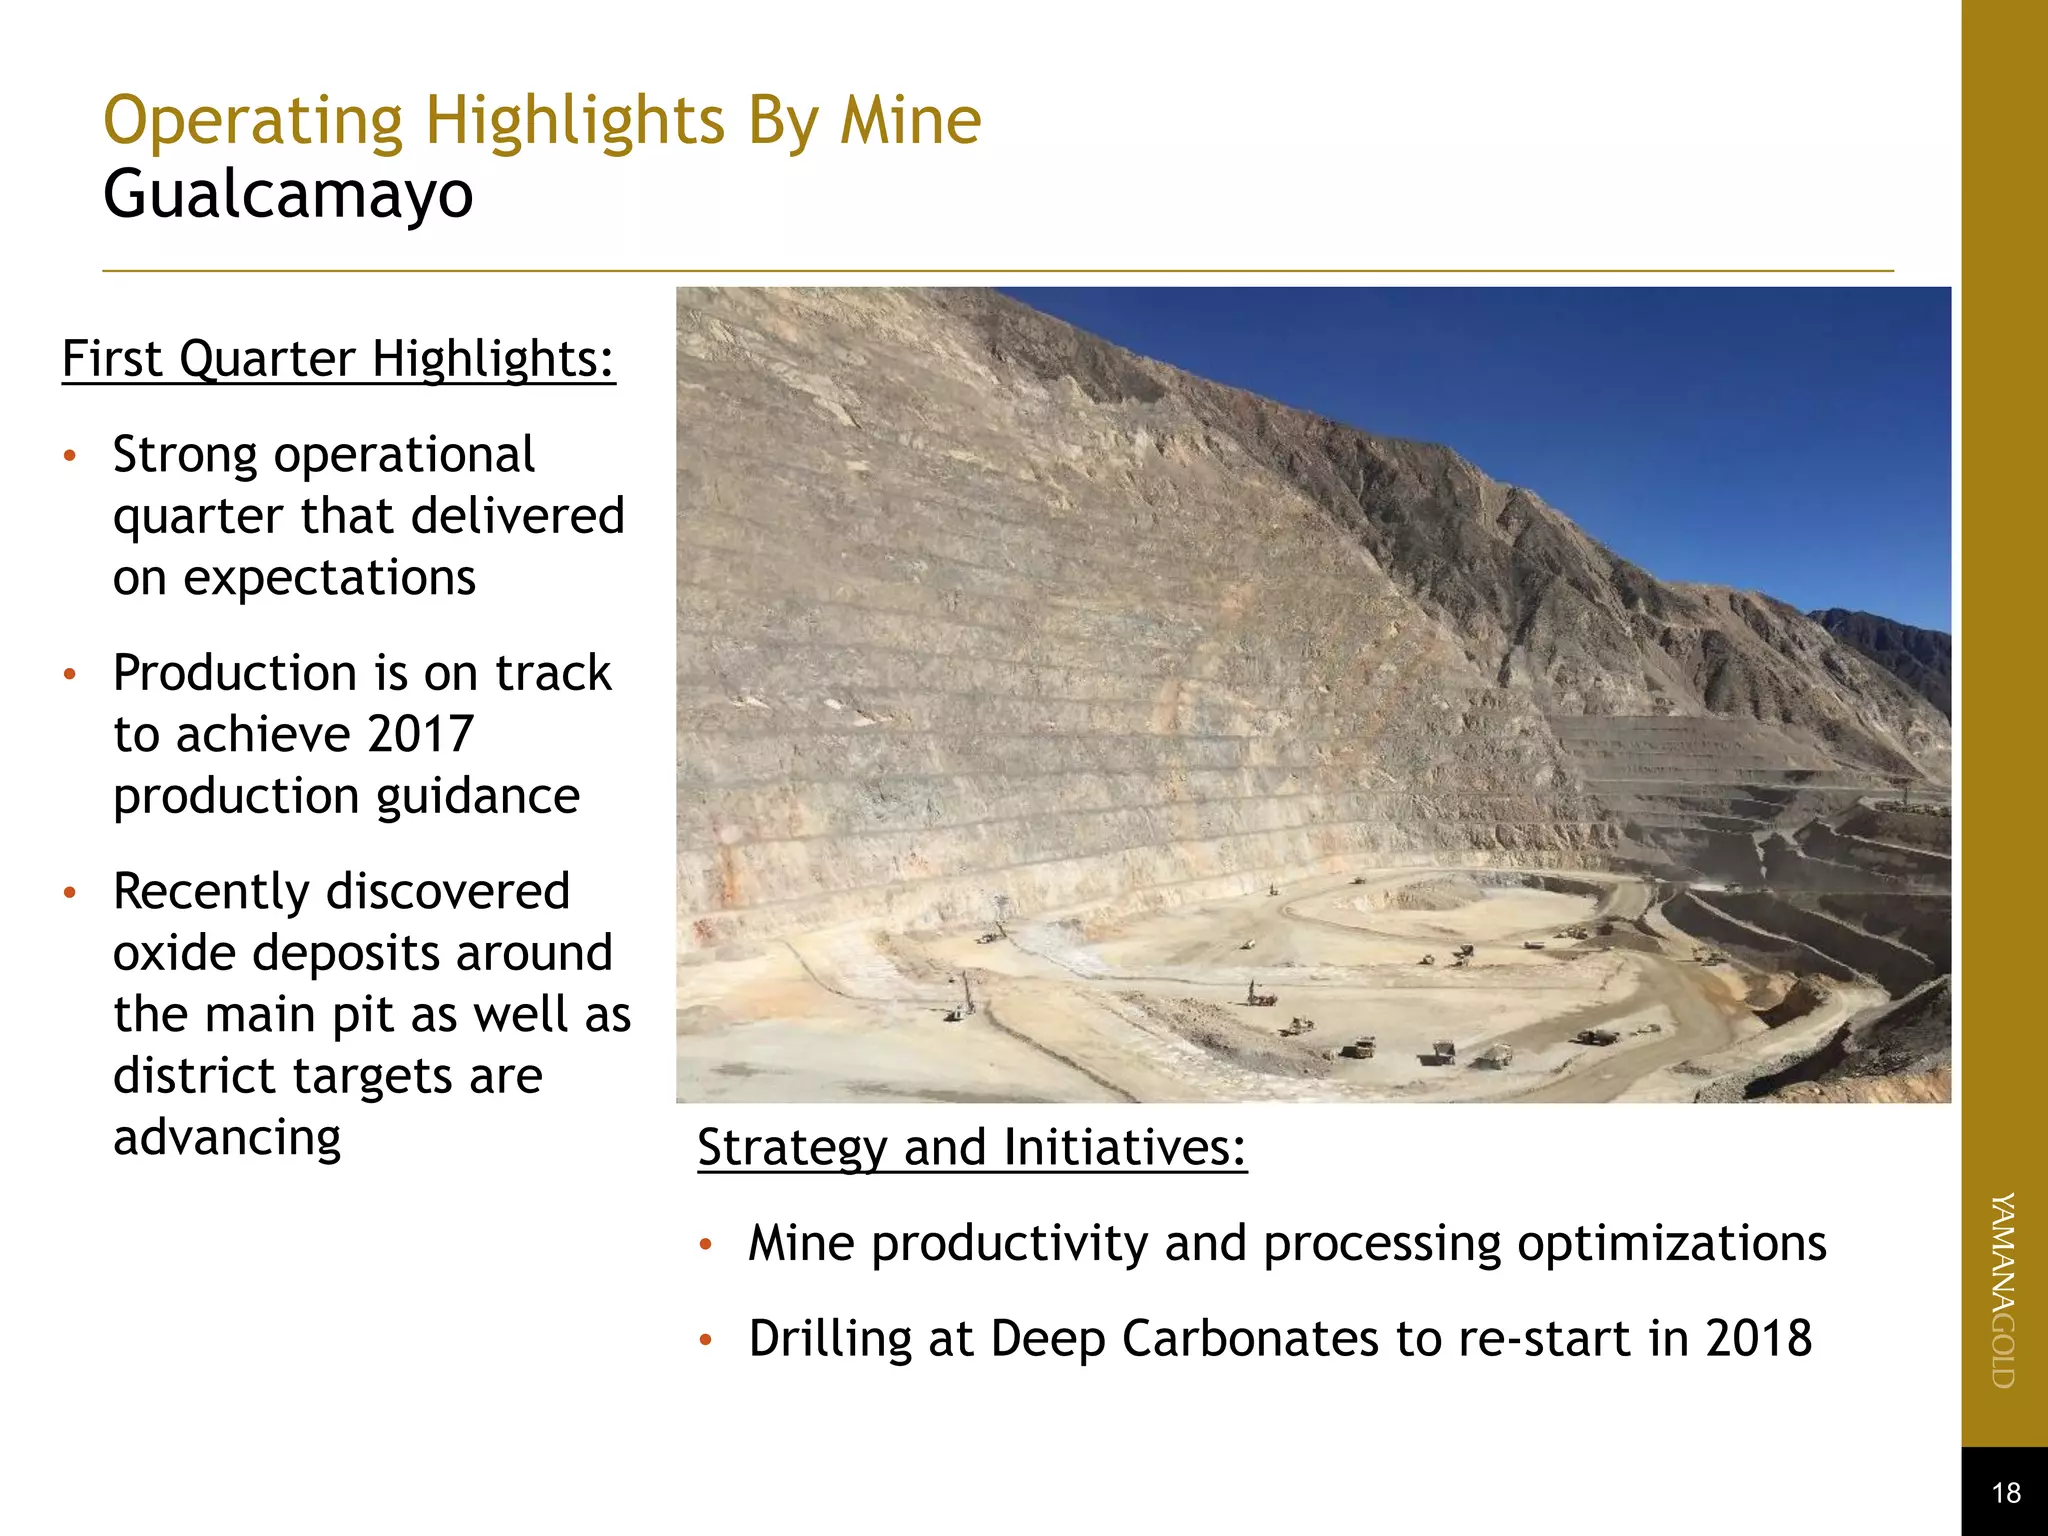
- Key highlights mentioned are that production and costs were better than budget in Q1, consolidated gold production guidance was increased, and significant improvements are expected in the second half of 2017 across various operations.