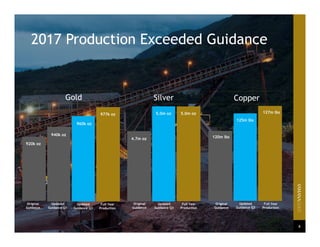
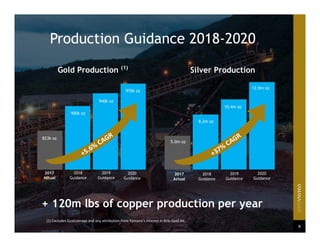
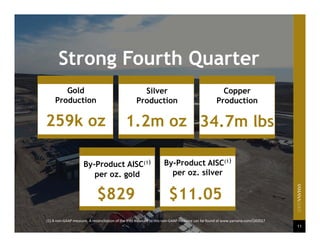
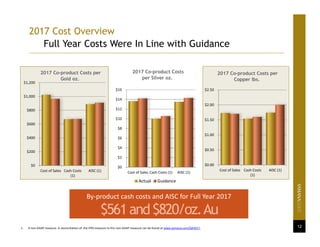
- Yamana Gold exceeded its 2017 production guidance for gold, silver, and copper. Production costs were in line with or better than guidance.
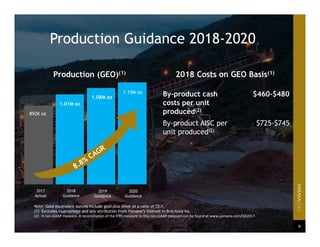
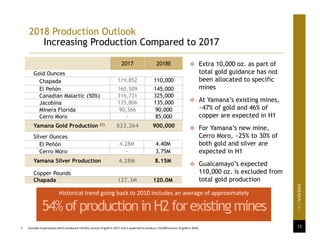
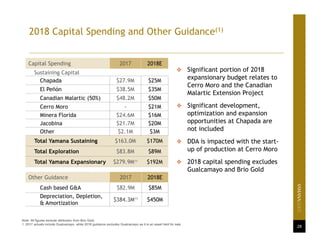
- In 2018, Yamana expects to increase gold and silver production compared to 2017, with gold production guidance of 900,000 ounces and silver production guidance of 8.15 million ounces. Copper production is expected to remain steady at 120 million pounds.
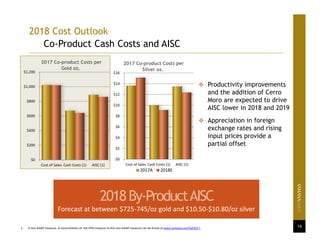
- All-in sustaining costs for 2018 are forecast to be between $725-745 per ounce of gold and $10.50-$10.80 per ounce of silver, expected to decrease in 2019 with the ramp-up of Cerro Moro and productivity improvements.