Downloaded 151 times
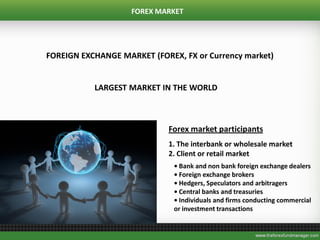
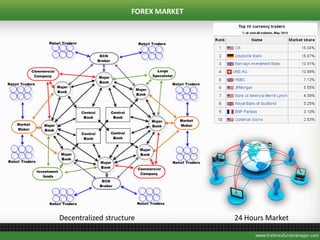
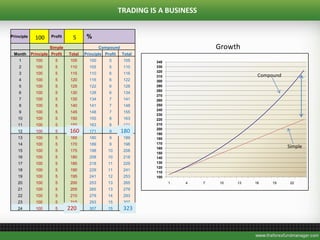
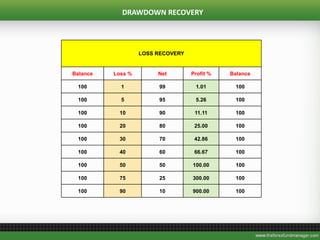
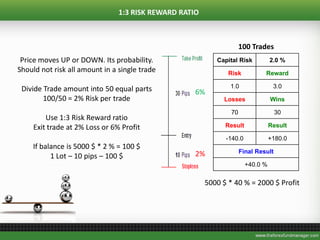
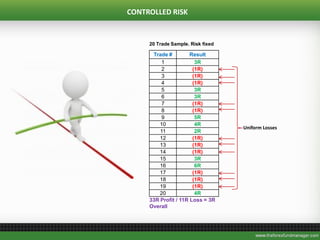
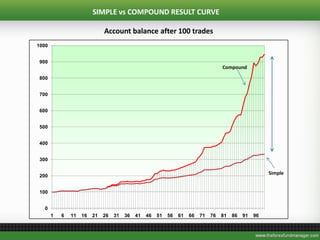
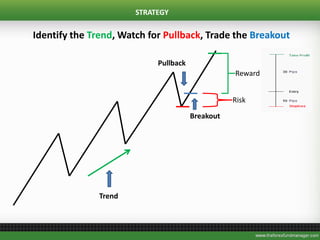
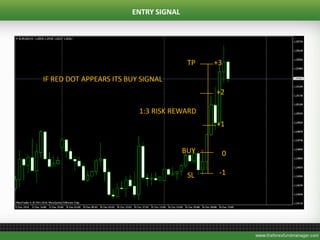
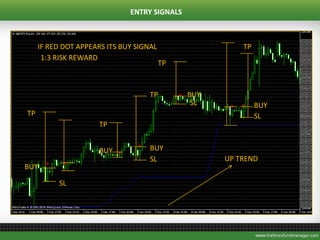
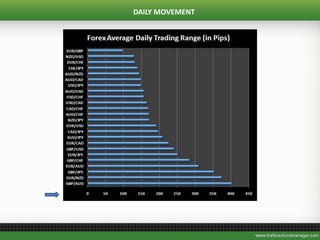
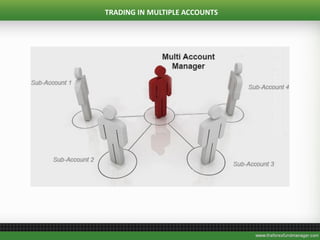
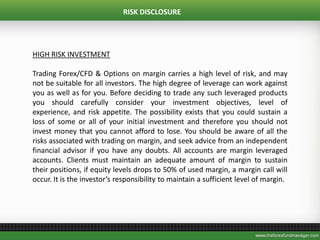

The document discusses the foreign exchange (forex) market, which is the largest and most liquid financial market in the world. It operates globally and around the clock. The document provides information on major currency pairs, how to trade forex using leverage and managing risk through strategies like risk-reward ratios and stop losses. It also discusses growing an account through compounding profits and maintaining consistency in trading over time.