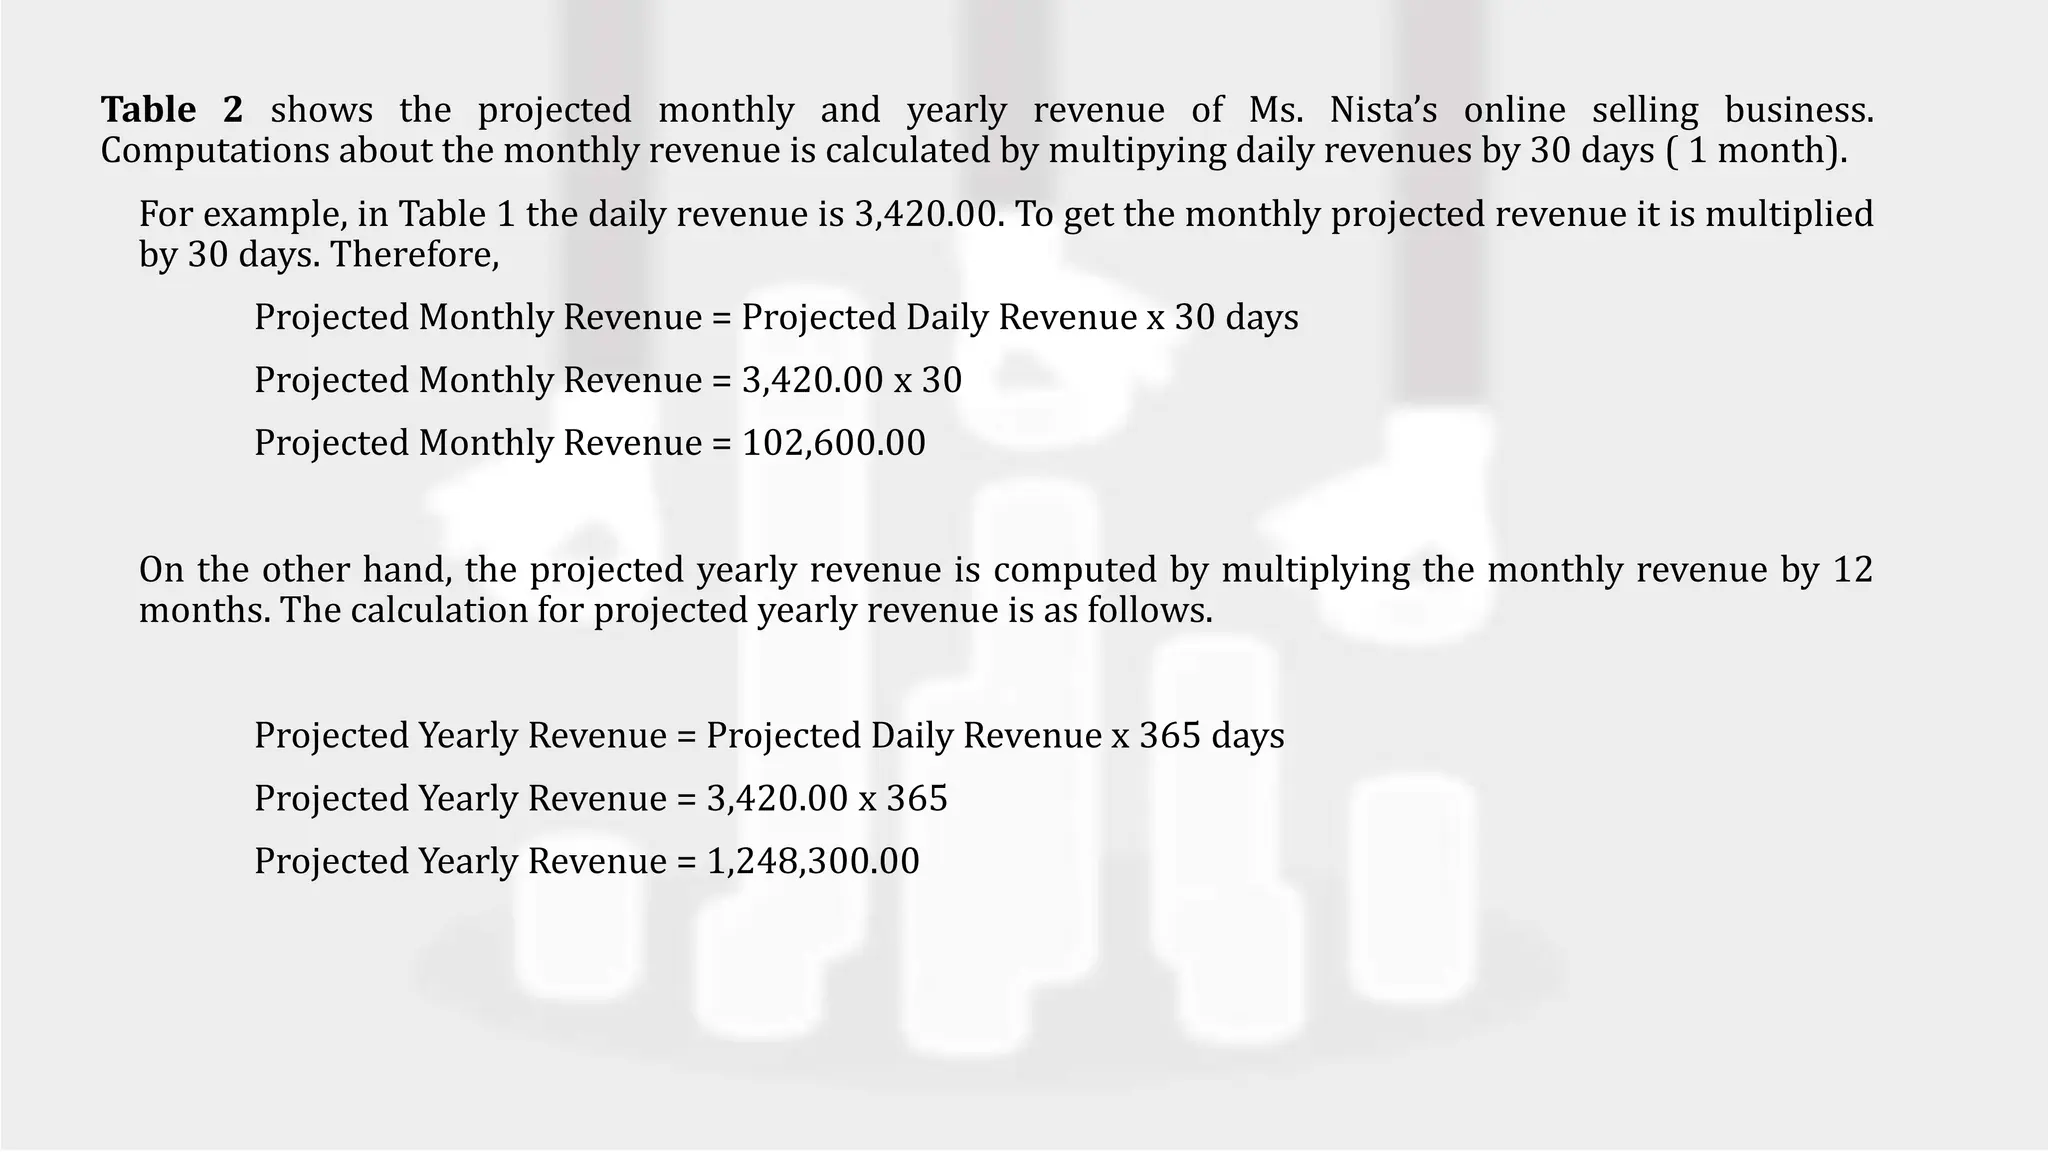
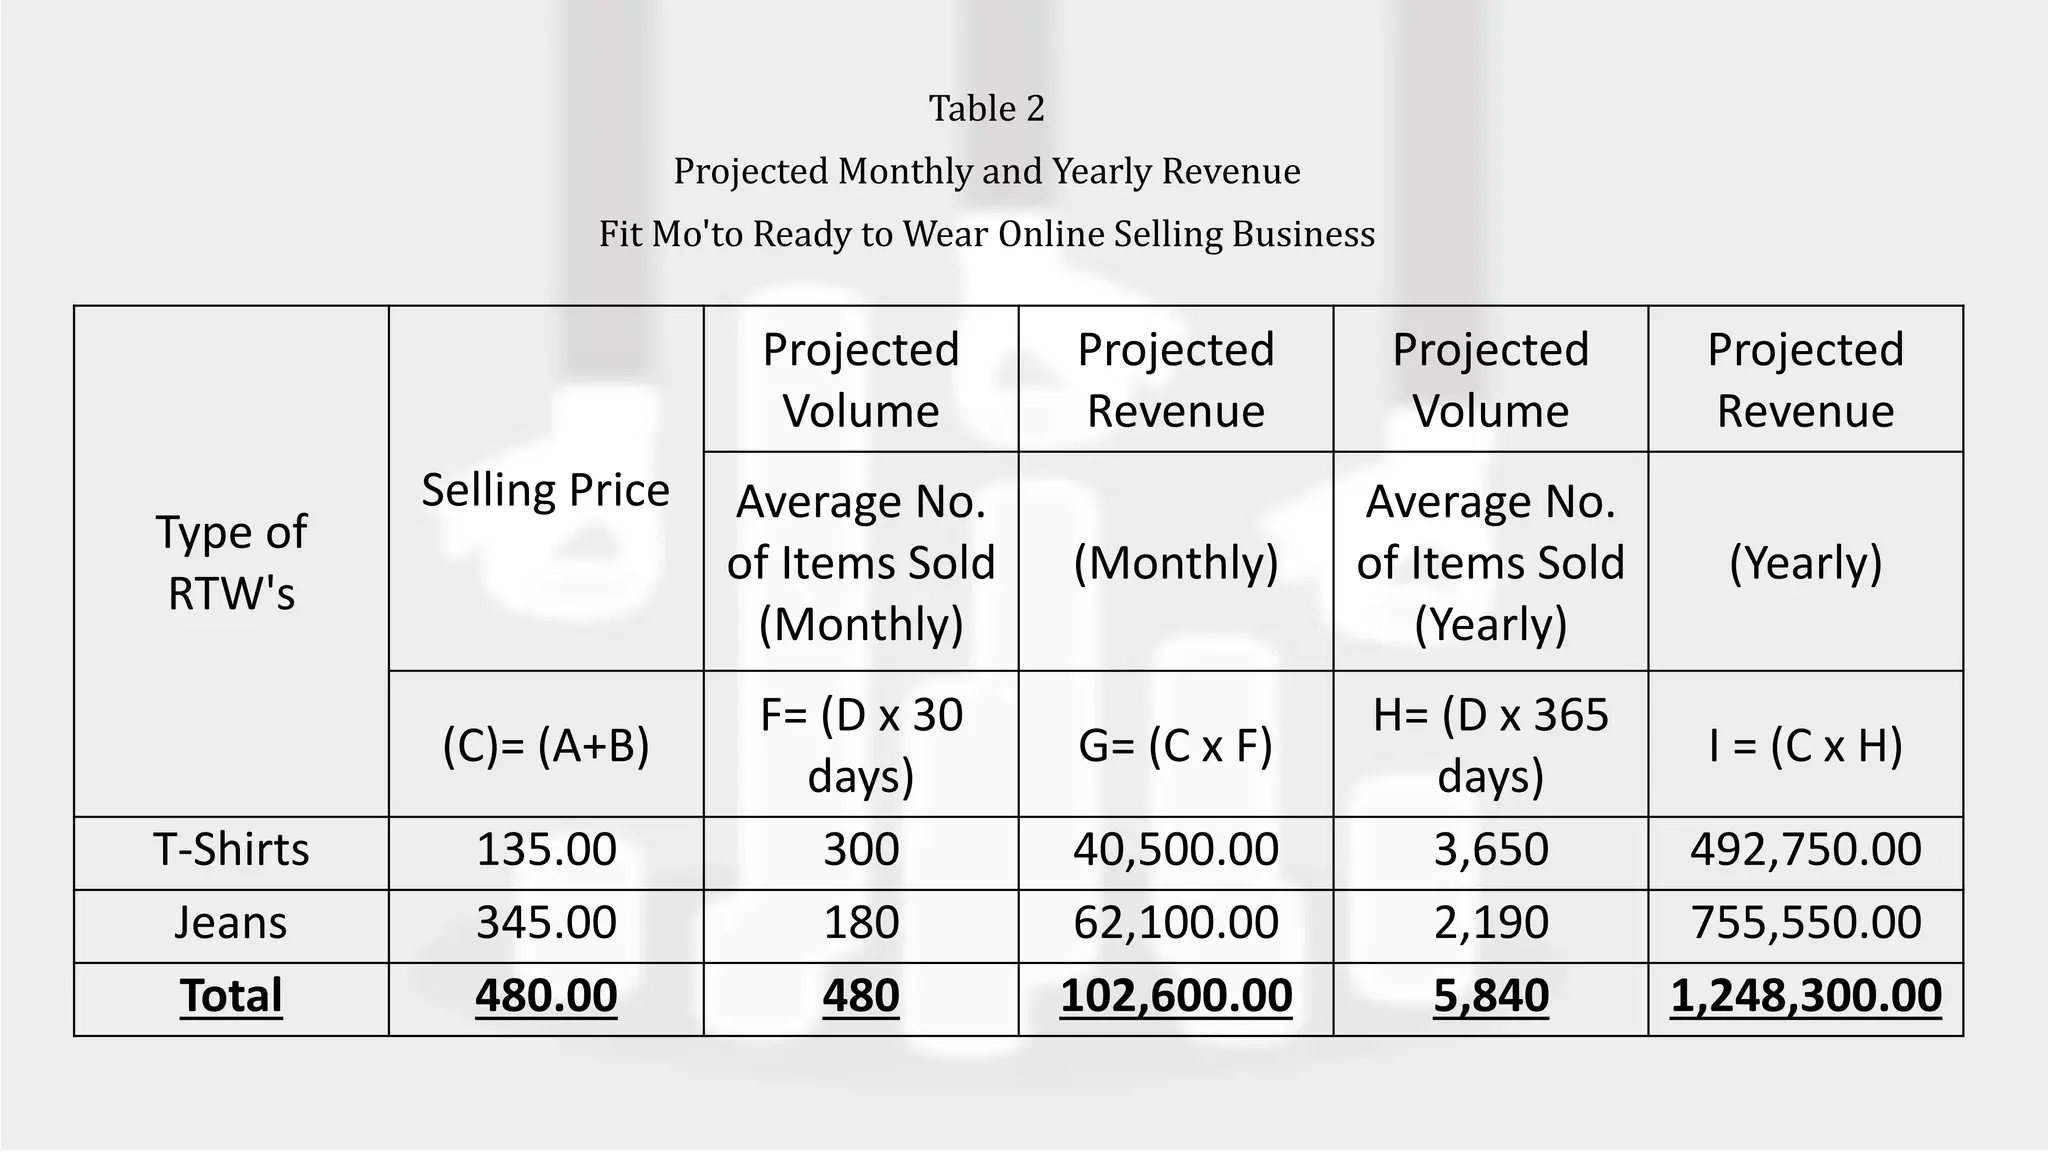
The document provides information on forecasting revenues and costs for a business. It defines revenue and forecasting. It then shows an example of a business owner, Ms. Nista, forecasting the projected daily, monthly, and yearly revenues of her new online clothing business. Tables show the projected revenues based on expected sales and costs of t-shirts and jeans. The document also provides a table projecting monthly revenues over one year, with assumed monthly increases and decreases in revenue at different times of the year.
Activity sheet for the topic on intersubjectivity using the presentation of Mr. Antonio Delgado
https://www.slideshare.net/kazekage15/philosophy-of-the-human-person-intersubjectivity
Social and Political Stratification Definition
Systems of Stratification
Theoretical Perspectives on Social Stratification
Social MObility and Social Inequality
Analyze and describe your current budget and budget variance..docxrossskuddershamus
Analyze and describe your current budget and budget variance.
Budgeted plans offer business visionaries some assistance with setting financial objectives – and audit genuine execution against these objectives. Since a financial plan is an appraisal of future numbers in view of current data, your business' real execution ought to be like the budgeted sums. Real execution, be that as it may, will never be precisely the same as the financial backing. It will approach, miss the mark, or surpass the financial backing.
The financial backing ought to be observed frequently consistently: quarterly, month to month, or even week after week. Inspecting the monetary allowance will offer you some assistance with identifying issues before they cost the business an excess of time or cash. How frequently you audit the financial backing relies on upon your trust in the figures and the danger connected with not meeting the monetary allowance. For instance, in the event that you should meet a specific spending plan so as to meet your credit commitments, the danger of missing the mark is high. You should think about modifying the present year's financial plan at different interims consistently. Numerous organizations re-assess their financial plans part of the way through the year. Along these lines they can survey the genuine results so far and modify the monetary allowance to all the more precisely speak to genuine desires.
At the point when your business does not meet budgeted figures, begin by exploring the business methodology that shaped the premise for the financial backing. Some part of executing your business technique did not happen not surprisingly. You additionally need to investigate the financial backing figures, giving careful consideration to the real parts of benefit—Sales, Cost of Goods Sold, and Operating Expenses. Perhaps you met your Sales objectives and comprehended the Cost of Goods Sold, however misconstrued Operating Expenses. Assess the progressions you should make to future spending plans to incorporate this new information.
While making a business budget plan, there are a great deal of things that you have to mull over. A financial plan is continually changing and being adjusted, in light of the fact that your business is always developing, changing, and making strides. In any case, there are additionally outer impacts that you have to mull over while making or altering your business spending plan. There are bunches of various types of outer impacts. Here is a rundown of a portion of the outer impacts that there are on a business spending plan:
Political and lawful outside impacts: There are two or three distinct ways that legislative issues and lawful arrangements can influence your business. Maybe a standout amongst the most widely recognized political and legitimate outside elements is the creation and change of expenses. As a business, you truly have no influence over the amount of cash the administration chooses to duty you f.
Monthly Sales Scorecard PowerPoint Presentation Slides is a highly visual tool tailor-made for sales executives and management. Showcase the opportunities created with the help of monthly sales BSC PPT theme. Our balanced scorecard for sales PowerPoint slideshow also assists users to assess unique visitors for each month. Demonstrate monthly performance scorecard of the regional sales team using this sales scorecard PPT template deck. You can even illustrate the performance of your sales staff through the strategic management sales BSC PowerPoint theme. Elucidate products monthly sales with respect to the service line and cumulative sales using our sales dashboard PPT templates. Designers of this eye-catching sales BSC PowerPoint theme follow a content-driven approach. The audience can skim the whole company sales scenario in a glance. Competitor based monthly sales forecast scorecard layout is loaded with pie charts, and bar graphs. Download our sales balanced scorecard PPT slideshow to showcase the sales endeavors of your organization in real-time. https://bit.ly/3koJ2tB
The European Unemployment Puzzle: implications from population agingGRAPE
We study the link between the evolving age structure of the working population and unemployment. We build a large new Keynesian OLG model with a realistic age structure, labor market frictions, sticky prices, and aggregate shocks. Once calibrated to the European economy, we quantify the extent to which demographic changes over the last three decades have contributed to the decline of the unemployment rate. Our findings yield important implications for the future evolution of unemployment given the anticipated further aging of the working population in Europe. We also quantify the implications for optimal monetary policy: lowering inflation volatility becomes less costly in terms of GDP and unemployment volatility, which hints that optimal monetary policy may be more hawkish in an aging society. Finally, our results also propose a partial reversal of the European-US unemployment puzzle due to the fact that the share of young workers is expected to remain robust in the US.
The Evolution of Non-Banking Financial Companies (NBFCs) in India: Challenges...beulahfernandes8
Role in Financial System
NBFCs are critical in bridging the financial inclusion gap.
They provide specialized financial services that cater to segments often neglected by traditional banks.
Economic Impact
NBFCs contribute significantly to India's GDP.
They support sectors like micro, small, and medium enterprises (MSMEs), housing finance, and personal loans.
The secret way to sell pi coins effortlessly.DOT TECH
Well as we all know pi isn't launched yet. But you can still sell your pi coins effortlessly because some whales in China are interested in holding massive pi coins. And they are willing to pay good money for it. If you are interested in selling I will leave a contact for you. Just telegram this number below. I sold about 3000 pi coins to him and he paid me immediately.
Telegram: @Pi_vendor_247
how to swap pi coins to foreign currency withdrawable.DOT TECH
As of my last update, Pi is still in the testing phase and is not tradable on any exchanges.
However, Pi Network has announced plans to launch its Testnet and Mainnet in the future, which may include listing Pi on exchanges.
The current method for selling pi coins involves exchanging them with a pi vendor who purchases pi coins for investment reasons.
If you want to sell your pi coins, reach out to a pi vendor and sell them to anyone looking to sell pi coins from any country around the globe.
Below is the contact information for my personal pi vendor.
Telegram: @Pi_vendor_247
when will pi network coin be available on crypto exchange.DOT TECH
There is no set date for when Pi coins will enter the market.
However, the developers are working hard to get them released as soon as possible.
Once they are available, users will be able to exchange other cryptocurrencies for Pi coins on designated exchanges.
But for now the only way to sell your pi coins is through verified pi vendor.
Here is the telegram contact of my personal pi vendor
@Pi_vendor_247
how to sell pi coins in all Africa Countries.DOT TECH
Yes. You can sell your pi network for other cryptocurrencies like Bitcoin, usdt , Ethereum and other currencies And this is done easily with the help from a pi merchant.
What is a pi merchant ?
Since pi is not launched yet in any exchange. The only way you can sell right now is through merchants.
A verified Pi merchant is someone who buys pi network coins from miners and resell them to investors looking forward to hold massive quantities of pi coins before mainnet launch in 2026.
I will leave the telegram contact of my personal pi merchant to trade with.
@Pi_vendor_247
BYD SWOT Analysis and In-Depth Insights 2024.pptxmikemetalprod
Indepth analysis of the BYD 2024
BYD (Build Your Dreams) is a Chinese automaker and battery manufacturer that has snowballed over the past two decades to become a significant player in electric vehicles and global clean energy technology.
This SWOT analysis examines BYD's strengths, weaknesses, opportunities, and threats as it competes in the fast-changing automotive and energy storage industries.
Founded in 1995 and headquartered in Shenzhen, BYD started as a battery company before expanding into automobiles in the early 2000s.
Initially manufacturing gasoline-powered vehicles, BYD focused on plug-in hybrid and fully electric vehicles, leveraging its expertise in battery technology.
Today, BYD is the world’s largest electric vehicle manufacturer, delivering over 1.2 million electric cars globally. The company also produces electric buses, trucks, forklifts, and rail transit.
On the energy side, BYD is a major supplier of rechargeable batteries for cell phones, laptops, electric vehicles, and energy storage systems.
how to sell pi coins on Bitmart crypto exchangeDOT TECH
Yes. Pi network coins can be exchanged but not on bitmart exchange. Because pi network is still in the enclosed mainnet. The only way pioneers are able to trade pi coins is by reselling the pi coins to pi verified merchants.
A verified merchant is someone who buys pi network coins and resell it to exchanges looking forward to hold till mainnet launch.
I will leave the telegram contact of my personal pi merchant to trade with.
@Pi_vendor_247
Yes of course, you can easily start mining pi network coin today and sell to legit pi vendors in the United States.
Here the telegram contact of my personal vendor.
@Pi_vendor_247
#pi network #pi coins #legit #passive income
#US
Even tho Pi network is not listed on any exchange yet.
Buying/Selling or investing in pi network coins is highly possible through the help of vendors. You can buy from vendors[ buy directly from the pi network miners and resell it]. I will leave the telegram contact of my personal vendor.
@Pi_vendor_247
What price will pi network be listed on exchangesDOT TECH
The rate at which pi will be listed is practically unknown. But due to speculations surrounding it the predicted rate is tends to be from 30$ — 50$.
So if you are interested in selling your pi network coins at a high rate tho. Or you can't wait till the mainnet launch in 2026. You can easily trade your pi coins with a merchant.
A merchant is someone who buys pi coins from miners and resell them to Investors looking forward to hold massive quantities till mainnet launch.
I will leave the telegram contact of my personal pi vendor to trade with.
@Pi_vendor_247
Abhay Bhutada Leads Poonawalla Fincorp To Record Low NPA And Unprecedented Gr...Vighnesh Shashtri
Under the leadership of Abhay Bhutada, Poonawalla Fincorp has achieved record-low Non-Performing Assets (NPA) and witnessed unprecedented growth. Bhutada's strategic vision and effective management have significantly enhanced the company's financial health, showcasing a robust performance in the financial sector. This achievement underscores the company's resilience and ability to thrive in a competitive market, setting a new benchmark for operational excellence in the industry.
2. LEARNING SKILLS FROM MELCs
• Identify essential factors in forecasting revenues and
costs;
• calculate mark-up and selling price of a product or
merchandise;
• compute projected revenues;
• compute projected costs; and
• create a table showing projected revenue and costs.
• appreciate the significance of forecasting revenues an
costs to a business.
3. What is Revenue?
Revenue is recognized when earned, whether paid
in cash or charged to the account of the customer.
Other terms related to revenue include Sales and
Service Income. Sales is used especially when the
nature of business is merchandising or retailing,
while Service Income is used to record revenues
earned by rendering services.
4. What is Forecasting?
• Forecasting is an attempt to predict what may happen in the
future.
• The entrepreneur would want his/her forecasting for his/her
small business as credible and as accurate as possible to avoid
complications in the future. In estimating potential revenue for
the business, factors such as external and internal factors that
can affect the business must be considered. These factors should
serve as basis in forecasting revenues of the business
5. These factors are:
1. The economic condition of the country. When the economy grows, its growth is
experienced by the consumers. Consumers are more likely to buy products and services. The
entrepreneur must be able to identify the overall health of the economy in order to make
informed estimates. A healthy economy makes good business.
2. The competing businesses or competitors. Observe how your competitors are doing
business. Since you share the same market with them, information about the number of
products sold daily or the number of items they are carrying will give you idea as to how
much your competitors are selling.
3. Changes happening in the community. Changes happening in the environment such as
customer demographic, lifestyle and buying behavior give the entrepreneur a better
perspective about the market.
4. The internal aspect of the business. Another factor that affects forecasting revenues in the
business itself. Plant capacity often plays a very important role in forecasting. For example, a
“Puto” maker can only make 250 pieces of puto every day; therefore, he can only sell as
much as 250 pieces of puto every day.
6. • Example: Ms. Fashion Nista recently opened her dream business
and named it Fit Mo’to Ready to Wear Online Selling Business, an
online selling business which specializes in ready to wear clothes
for teens and young adults. Based on her initial interview among
several online selling businesses, the average number of t-shirts
sold every day is 10 and the average pair of fashion jeans sold every
day is 6. From the information gathered, Ms. Nista projected the
revenue of her Fit Mo’to Ready to Wear Online Selling Business.
She gets her supplies at a local RTW dealer in the city. The cost per
piece of t-shirt is 90 pesos, while a pair of fashion jeans costs 230
pesos per piece. She then adds a 50 percent mark up to every piece
of RTW sold.
7. Mark up refers to the amount added to the cost to come up with the selling
price. The formula for getting the mark up price is as follows:
Mark Up Price = ( Cost x Desired Mark Up Percentage)
Mark Up for T-shirt = ( 90.00 x .50)
Mark Up for T-shirt = 45.00
In calculating for the selling price, the formula is as follows:
Selling Price = Cost + Mark Up
Selling Price = 90.00 + 45.00
Selling Price for T-shirt = 135.00
8. Table 1 shows the projected daily revenue of Ms. Nista’s online selling business. Computations regarding the
projected revenue is presented in letters in upper case A, B, C, D, and E.
Table 1
Projected Daily Revenue
Fit Mo'to Ready to Wear Online Selling Business
Type of
RTW's
Cost per Unit
(A)
Mark-up
50% (B)
Selling Price
(C)
Projected
Volume (D)
Projected
Revenue (E)
Average No.
of Items Sold
(Daily)
(Daily)
(A) (B)= (A x .50) (C)= (A+B) (D) (E) =(C x D)
T-Shirts 90.00 45.00 135.00 10 1,350.00
Jeans 230.00 115.00 345.00 6 2,070.00
Total 320.00 160.00 480.00 16 3,420.00
9. Table 2 shows the projected monthly and yearly revenue of Ms. Nista’s online selling business.
Computations about the monthly revenue is calculated by multipying daily revenues by 30 days ( 1 month).
For example, in Table 1 the daily revenue is 3,420.00. To get the monthly projected revenue it is multiplied
by 30 days. Therefore,
Projected Monthly Revenue = Projected Daily Revenue x 30 days
Projected Monthly Revenue = 3,420.00 x 30
Projected Monthly Revenue = 102,600.00
On the other hand, the projected yearly revenue is computed by multiplying the monthly revenue by 12
months. The calculation for projected yearly revenue is as follows.
Projected Yearly Revenue = Projected Daily Revenue x 365 days
Projected Yearly Revenue = 3,420.00 x 365
Projected Yearly Revenue = 1,248,300.00
10. Table 2
Projected Monthly and Yearly Revenue
Fit Mo'to Ready to Wear Online Selling Business
Type of
RTW's
Selling Price
Projected
Volume
Projected
Revenue
Projected
Volume
Projected
Revenue
Average No.
of Items Sold
(Monthly)
(Monthly)
Average No.
of Items Sold
(Yearly)
(Yearly)
(C)= (A+B)
F= (D x 30
days)
G= (C x F)
H= (D x 365
days)
I = (C x H)
T-Shirts 135.00 300 40,500.00 3,650 492,750.00
Jeans 345.00 180 62,100.00 2,190 755,550.00
Total 480.00 480 102,600.00 5,840 1,248,300.00
11. Table 3 shows the projected monthly revenues covering one year of operation. The table shows an average
increase of revenue every month by 5 percent except June, July to October and December. While the month of June
has twice the increase from the previous month by 10 percent, let us consider that months covering July to October
are considered to be Off-Peak months, therefore sales from July to October are expected to decrease. It is assumed
that there is no increase in revenue from July to August, while from August to October the decrease in revenues is 5
percent from previous month. Since revenues from sales of RTW’s are considered to be seasonal, it assumed that
there is a 10 percent increase in revenue from November to December.
• Computation for assumed increase of revenue on specific months is as follows:
Projected Monthly Revenue (Increase) = Revenue (January) x 5 % Increase
Projected Monthly Revenue (Increase) = 102,600.00 x .05
Projected Monthly Revenue (Increase) = 5,130.00
Projected Revenue for February = Revenue (January) + Amount of Increase
Projected Revenue for February = 102,600.00 + 5,130.00
Projected Revenue for February = 107,730.00
12. Table 3 shows the projected monthly revenues covering one year of operation. The table shows an average
increase of revenue every month by 5 percent except June, July to October and December. While the month of June
has twice the increase from the previous month by 10 percent, let us consider that months covering July to October
are considered to be Off-Peak months, therefore sales from July to October are expected to decrease. It is assumed
that there is no increase in revenue from July to August, while from August to October the decrease in revenues is 5
percent from previous month. Since revenues from sales of RTW’s are considered to be seasonal, it assumed that
there is a 10 percent increase in revenue from November to December.
• On the other hand, decrease in revenue is computed as follows:
Projected Monthly Revenue (Decrease) = Revenue (August) x 5 % Increase
Projected Monthly Revenue (Increase) = 144,041.14 x .05
Projected Monthly Revenue (Increase) = 7,202.06
Projected Revenue for September = Revenue (August) - Amount of Decrease
Projected Revenue for September = 144,041.14 – 7,202.06
Projected Revenue for September = 136,839.08
13. Table 3
Projected Monthly Revenue
Fit Mo'to Ready to Wear Online Selling Business
Important Assumptions:
February to May Increase of 5% from previous revenue
June Increase of 10% from previous revenue
July to August The same Revenue (5%)
September to October Loss of 5% from previous revenue
November Increase of 5% from previous revenue
December Increase of 10% from previous revenue
Month January February March April May June
Revenue 102,600.00 107,730 113,116.50 118,772.32 124,719.94 137,182.03
Month July August September October November December
Revenue 144,041.14 144,041.14 136,839.08 129,997.13 136,496.98 150,146.68
14. Table 3
Projected Monthly Revenue
Fit Mo'to Ready to Wear Online Selling Business
Important Assumptions:
February to May Increase of 5% from previous revenue
June Increase of 10% from previous revenue
July to August The same Revenue (5%)
September to October Loss of 5% from previous revenue
November Increase of 5% from previous revenue
December Increase of 10% from previous revenue
Month January February March April May June
Revenue 102,600.00 107,730.00 113,116.50 118,772.33 124,710.94 137,182.04
Month July August September October November December
Revenue 144,041.14 144,041.14 136,839.08 129,997.13 136,496.98 150,146.68