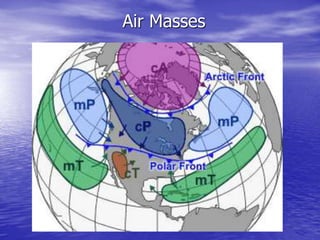
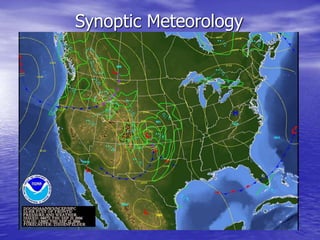
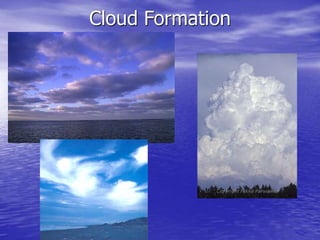
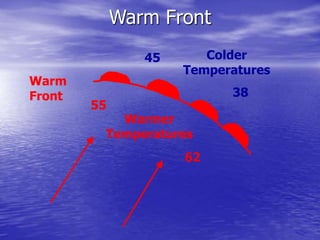
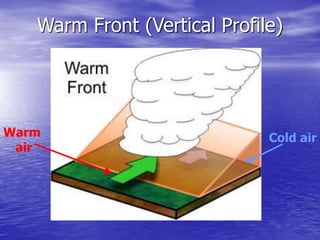
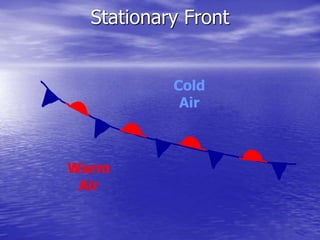
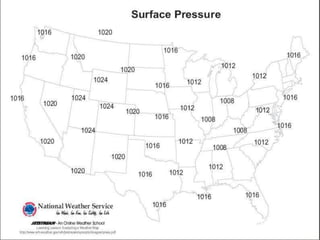
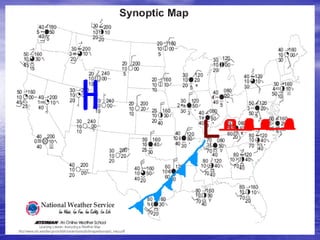
General Meteorology and
Their Application Towards
Forecasting
National Weather Service Shreveport, LA
www.srh.noaa.gov/shv
Air Masses
Synoptic Meteorology
Pressure and Wind
Origin of Wind
How Do Clouds Form?
 In order to understand this process, we
must first understand cold/warm air, and
their relationship with density.
 What is density??? (See experiment)
Cloud Formation
Cloud Formation (Cont’d)
Warm air rises (less
dense), and will
gradually cool. The
air will begin
condensing (when
the temperature and
dewpoint become
closer together), and
water droplets bond
onto condensation
nuclei. These nuclei
will collide with other
nuclei, eventually
forming a cloud.
Types of Clouds
Low clouds: Consist of stratoform (flat) clouds, or
cumuloform (puffy) clouds, lying on or just above the
surface (up to ~10,000 ft).
Stratus: Cumulus:
Types of Clouds (Cont’d)
Middle Clouds: Consist of altoform (meaning a middle
cloud) type clouds, extending from 10,000 – 20,000 feet
above the surface.
Altostratus: Altocumulus:
Types of Clouds (Cont’d)
High Clouds: Consists of mainly ice crystals suspended
above 20,000 feet from the surface. These clouds are
wispy/crisp/featherlike in appearance, and do not produce
precipitation.
Cirrus: Cirrostratus: Cirrocumulus:
How Does Rain Form???
 Through the collision/coalescence process,
water droplets continue to grow, forming
clouds. If enough lift is present in the
atmosphere (produced by fronts for
example), updrafts are created, which
forces the cloud to grow taller. The water
droplets continue to grow inside of clouds,
until they become too heavy to be
suspended by the updraft. It is then that
these droplets fall down to the earth as
rain.
Types of Fronts
 Now that we have learned the concepts of
density, we can better understand what fronts
are and how they affect the weather.
1) Cold Front: A transition zone where cold/dry,
and stable air, replaces warm/moist, and
unstable air. It is depicted by a blue line with
triangles pointing towards the direction of
movement.
Cold Front
Warmer
Temperatures
Colder
Temperatures
27
33
62
54
Cold Front (Vertical Profile)
Rising
Warm
air
Advancing
Cold air
Warm Front
55
62
Warm
Front
Warmer
Temperatures
Colder
Temperatures
45
38
Warm Front (Vertical Profile)
Cold air
Warm
air
Stationary Front
Warm
Air
Cold
Air
Mapping Exercise
 Draw and analyze a surface weather map
for pressure and temperature, and draw
the fronts that are indicated by these two
variables.
 Discuss our results.
Pressure/Front Map
Temperature/Front Map
Acknowledgments
• Jetstream website – Southern Region Headquarters ,
National Weather Service
www.srh.noaa.gov/srh/jetstream

Forecasting.ppt