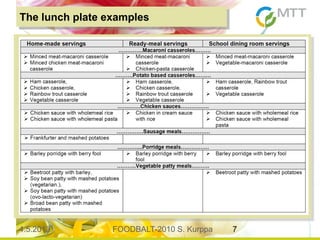
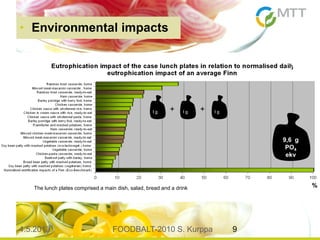
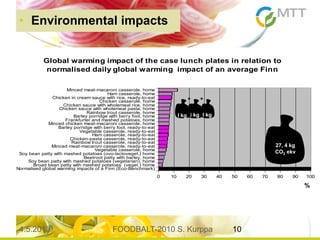
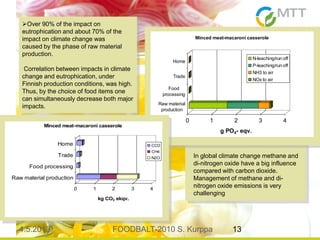
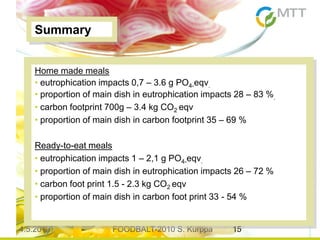
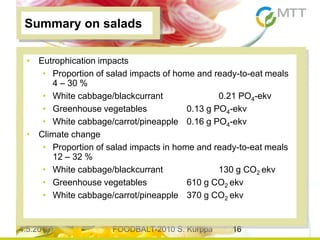
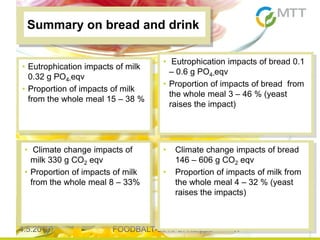
4.5.2013 1FOODBALT-2010 S. Kurppa
Sirpa Kurppa,
MTT Biotechnology and Food Research
LCA approach focusing to a functional unit of
food – a consumer based approach to
become proactive to Baltic sea environmental
problem
4.5.2013 FOODBALT-2010 S. Kurppa 2
Otsikon paikka
• Lorem ipsum dolor sit amet, consetetur sadipscing elitr
• sed diam nonumy eirmod tempor invidunt ut labore
• dolore magna aliquyam erat, sed diam voluptua.
4.5.2013 FOODBALT-2010 S. Kurppa 3
food
housing
passenger car
entertainment and
culture hotels,
cafes,
restaurants
Eutrofication
Climate change
Energy
Acidification
Ozon
Impact categories
100=Annual environmental impact per capita
64=Environmental impact per capita per annual
consumption
NISSINEN, A., GRÖNROOS, J., HEISKANEN, E., HONKANEN, A., KATAJAJUURI, J.-M., KURPPA, S., MÄKINEN, T.,
MÄENPÄÄ, I., SEPPÄLÄ, J. TIMONEN, P., USVA, K., VIRTANEN, Y. 2007. Developing benchmarks for consumer-
oriented life cycle assessment-based environmental information on products, services and consumption patterns.
Journal of Cleaner Production 15, 6/2007: 538-549.
4.5.2013 FOODBALT-2010 S. Kurppa 4
• decision processes of food supply chain have become completely
undependable of ecological framework functions, in terms of use of
resources and using ecological resilience to lessen the environmental
impact of our food supply chain.
• in a longer approach, our security will be inevitably threatened
because of the unbalance of functions caused in ecological
environment.
4.5.2013 FOODBALT-2010 S. Kurppa 5
Interest groups
 Fazer Bakeries
Ltd
 HK-Ruokatalo Ltd
 Raisio Ltd
 Kesko Food Ltd
 Saarioinen Ltd
Rai
sio
Elovena Snack Biscuit Oat-
Honey
CO2e 240g / 100g
•Cultivation 57%
•Manufacturing 28%
•Package 11%
•Transport 4%
Kesko continues on 'The Global
100 Most Sustainable Corporations
in the World' list
Kesko ranked 33rd on the 'The Global
100 Most Sustainable Corporations in
the World' list. In 2010, Sustainability
Yearbook, Kesko's responsibility work
qualified in the SAM Silver Class in the
Food & Drug Retailers sector.
Fazer Ltd
HK Ltd
Raisio Ltd
Saarioinen
 Fazer Bakeries
Ltd
 HK-Ruokatalo Ltd
 Raisio Ltd
 Kesko Food Ltd
 Saarioinen Ltd
4.5.2013 FOODBALT-2010 S. Kurppa 6
A plate model
The example lunch represented a
nutritional whole according to
recommendations for 1/3 of the
energy need and nutrients for daily
food consumption.
• A plate model - the principle of
dividing a plate into three parts;
• half of the plate consists of vegetables,
• one quarter of protein and
• one quarter of carbohydrate.
The portion is completed with bread and
milk or water.
• Shares of energy from proteins, fats
and carbohydrates
• protein should be 10–20 %,
• from fat 25–35 % and
• from carbohydrates 50–60 %.
4.5.2013 FOODBALT-2010 S. Kurppa 7
The lunch plate examples
4.5.2013 FOODBALT-2010 S. Kurppa 8
The Farm Accountancy
Data NetworkFADN data
MTT Economic Research
Viljelymallit
(MTT ELE)
The background data
Ympäristövaikutustieto
tuontirehuista (MTT ELE)
Viljelymallit
(MTT ELE)
Ympäristövaikutustieto
tuontirehuista (MTT ELE)
Viljelymallit
(MTT ELE)
Ympäristövaikutustieto
tuontirehuista (MTT ELE)
Data on environmental impacts of imported
food materials / databases of publications
Data on environmental impacts of imported
feed materials / databases of publications
Viljelymallit
(MTT ELE)
Ympäristövaikutustieto
tuontirehuista (MTT ELE)
Machinery
Viljelymallit
(MTT ELE)
Ympäristövaikutustieto
tuontirehuista (MTT ELE)
Machinery in
animal production
Environmental accounting
model Ketjuvastuu model
MTT Ecology of Food
Production Systems
Crop
production
models
MTT
Animal
production
models
(MTT ELE)
Leaching and
run off
models/The
Finnish
Environment
Institute, MTTProAgria Plot
Databank
information
Environmental impacts of
food processing The Finnish
Enterprises - MTT
Environmental impacts of
logistics and trading7
Finnish trading industry
MTT
Data on environmental impacts
of feed production /MTT
Data on environmental impacts
of fertilizer production/Yara Ltd
Commercial
feed
Other input
Specific
information
on other
inputs
Energy
Energy
Environmental
assessments on
customer and consumer
activities
National Input-output
statistics
Finnish Environment
Institute, University of Oulu
Thule-institute Assessment
of the environmental
impacts of material flows
caused by the Finnish
economy with the ENVIMAT
model
Machinery in
crop
production
Data on environmental impact of imported
feed materials/ databases of publications
Recipes of feed products/
Finnish feed production industry
4.5.2013 FOODBALT-2010 S. Kurppa 9
%The lunch plates comprised a main dish, salad, bread and a drink
9,6 g
PO4
ekv
I gI g I g+ +
• Environmental impacts• Environmental impacts
4.5.2013 FOODBALT-2010 S. Kurppa 10
0 10 20 30 40 50 60 70 80 90 100
Normalised global warming impacts of a Finn (Eco-Benchmark)
Broad bean patty with mashed potatoes (veget.) home
Soy bean patty with mashed potatoes (vegetarian), home
Beetroot patty with barley, home
Soy bean patty with mashed potatoes (ovo-lactoveget.) home
Vegetable casserole, home
Minced meat-macaroni casserole, ready-to-eat
Rainbow trout casserole, ready-to-eat
Chicken-pasta casserole, ready-to-eat
Ham casserole, ready-to-eat
Vegetable casserole, ready-to-eat
Barley porridge with berry fool, ready-to-eat
Minced chicken meat-macaroni casserole, home
Frankfurter and mashed potatoes, home
Barley porridge with berry fool, home
Rainbow trout casserole, home
Chicken sauce with wholemeal pasta, home
Chicken sauce with wholemeal rice, home
Chicken casserole, home
Chicken in cream sauce with rice, ready-to-eat
Ham casserole, home
Minced meat-macaroni casserole, home
Global warming impact of the case lunch plates in relation to
normalised daily global warming impact of an average Finn
27, 4 kg
CO2 ekv
+
I kgI kg I kg
+
%
• Environmental impacts
4.5.2013 FOODBALT-2010 S. Kurppa 11
A few examples of lunch plate portions, representative of the
lowest and the highest impact classes
4.5.2013 FOODBALT-2010 S. Kurppa 12
The two versions of the salads can be easily identified from the climate change
impact of a plate. Of the alternatives of salad made from tomato, cucumber and
lettuce and another made from cabbage and blackcurrants, the first had three times
higher climate change impact than the second
4.5.2013 FOODBALT-2010 S. Kurppa 13
0 1 2 3 4
g PO4- eqv.
Raw material
production
Food
processing
Trade
Home
Minced meat-macaroni casserole
N-leaching/run off
P-leaching/run off
NH3 to air
NOx to air
Over 90% of the impact on
eutrophication and about 70% of the
impact on climate change was
caused by the phase of raw material
production.
Correlation between impacts in climate
change and eutrophication, under
Finnish production conditions, was high.
Thus, by the choice of food items one
can simultaneously decrease both major
impacts.
0 1 2 3 4
kg CO2 ekqv.
Raw material production
Food processing
Trade
Home
Minced meat-macaroni casserole
CO2
CH4
N2O In global climate change methane and
di-nitrogen oxide have a big influence
compared with carbon dioxide.
Management of methane and di-
nitrogen oxide emissions is very
challenging
4.5.2013 FOODBALT-2010 S. Kurppa 14
0 0,2 0,4 0,6 0,8 1
kg CO2 eqv.
Raw material production
Food processing
Trade
Home
Vegetable casserole, redy-to-eat
CO2
CH4
N2O
0 0,2 0,4 0,6 0,8 1
kg CO2 ekqv.
Raw material production
Food processing
Trade
Home
Broad bean patty with mashed potatoes (veget.), home
CO2
CH4
N2O
0 0,2 0,4 0,6 0,8 1
kg CO2 eqv.
Raw material production
Food processing
Trade
Home
Vegetable casserole, home
CO2
CH4
N2O
In vegetarian dishes the
differences between
production phases balance
In vegetarian meals methane
has minor importance
With ready-to-eat dishes
importance of impacts from home
activities decrease and impacts
from food processing increase
4.5.2013 FOODBALT-2010 S. Kurppa 15
Summary
Home made meals
• eutrophication impacts 0,7 – 3.6 g PO4-eqv.
• proportion of main dish in eutrophication impacts 28 – 83 %.
• carbon footprint 700g – 3.4 kg CO2 eqv
• proportion of main dish in carbon footprint 35 – 69 %
Ready-to-eat meals
• eutrophication impacts 1 – 2,1 g PO4-eqv.
• proportion of main dish in eutrophication impacts 26 – 72 %
• carbon foot print 1.5 - 2.3 kg CO2 eqv
• proportion of main dish in carbon foot print 33 - 54 %
4.5.2013 FOODBALT-2010 S. Kurppa 16
Summary on salads
• Eutrophication impacts
• Proportion of salad impacts of home and ready-to-eat meals
4 – 30 %
• White cabbage/blackcurrant 0.21 PO4-ekv
• Greenhouse vegetables 0.13 g PO4-ekv
• White cabbage/carrot/pineapple 0.16 g PO4-ekv
• Climate change
• Proportion of salad impacts in home and ready-to-eat meals
12 – 32 %
• White cabbage/blackcurrant 130 g CO2 ekv
• Greenhouse vegetables 610 g CO2 ekv
• White cabbage/carrot/pineapple 370 g CO2 ekv
4.5.2013 FOODBALT-2010 S. Kurppa 17
• Climate change impacts of bread
146 – 606 g CO2 eqv
• Proportion of impacts of milk from
the whole meal 4 – 32 % (yeast
raises the impacts)
Summary on bread and drink
• Eutrophication impacts of milk
0.32 g PO4-eqv
• Proportion of impacts of milk
from the whole meal 15 – 38 %
• Eutrophication impacts of bread 0.1
– 0.6 g PO4-eqv
• Proportion of impacts of bread from
the whole meal 3 – 46 % (yeast
raises the impact)
• Climate change impacts of
milk 330 g CO2 eqv
• Proportion of impacts of milk
from the whole meal 8 – 33%
4.5.2013 FOODBALT-2010 S. Kurppa 18
4.5.2013 FOODBALT-2010 S. Kurppa 19
4.5.2013 FOODBALT-2010 S. Kurppa 20
Should we eat or not to eat?
4.5.2013 FOODBALT-2010 S. Kurppa 21
Final
• Environmental impacts of food can effectively be decreased by
focusing on plant-based proteins, outdoor-grown vegetables and
seasonal food.
• To make it simple: By balancing your diet you can have a food
plate that benefits health, environment and animal welfare.
• More vegetarian dishes
• Beans, lentils and peas as a protein source
• Locally produced vegetables and fruits
• Locally captured fish
• Seasonal food
• Sustainably produced meat
• Disposal of food waste is important especially because of the
impact caused by the production of unnecessary food and to a
minor extent because of bio-processing food waste.
4.5.2013 FOODBALT-2010 S. Kurppa 22
Thank you so much!
sirpa.kurppa@mtt.fi

Food balt kurppa

  • 1.
    4.5.2013 1FOODBALT-2010 S.Kurppa Sirpa Kurppa, MTT Biotechnology and Food Research LCA approach focusing to a functional unit of food – a consumer based approach to become proactive to Baltic sea environmental problem
  • 2.
    4.5.2013 FOODBALT-2010 S.Kurppa 2 Otsikon paikka • Lorem ipsum dolor sit amet, consetetur sadipscing elitr • sed diam nonumy eirmod tempor invidunt ut labore • dolore magna aliquyam erat, sed diam voluptua.
  • 3.
    4.5.2013 FOODBALT-2010 S.Kurppa 3 food housing passenger car entertainment and culture hotels, cafes, restaurants Eutrofication Climate change Energy Acidification Ozon Impact categories 100=Annual environmental impact per capita 64=Environmental impact per capita per annual consumption NISSINEN, A., GRÖNROOS, J., HEISKANEN, E., HONKANEN, A., KATAJAJUURI, J.-M., KURPPA, S., MÄKINEN, T., MÄENPÄÄ, I., SEPPÄLÄ, J. TIMONEN, P., USVA, K., VIRTANEN, Y. 2007. Developing benchmarks for consumer- oriented life cycle assessment-based environmental information on products, services and consumption patterns. Journal of Cleaner Production 15, 6/2007: 538-549.
  • 4.
    4.5.2013 FOODBALT-2010 S.Kurppa 4 • decision processes of food supply chain have become completely undependable of ecological framework functions, in terms of use of resources and using ecological resilience to lessen the environmental impact of our food supply chain. • in a longer approach, our security will be inevitably threatened because of the unbalance of functions caused in ecological environment.
  • 5.
    4.5.2013 FOODBALT-2010 S.Kurppa 5 Interest groups  Fazer Bakeries Ltd  HK-Ruokatalo Ltd  Raisio Ltd  Kesko Food Ltd  Saarioinen Ltd Rai sio Elovena Snack Biscuit Oat- Honey CO2e 240g / 100g •Cultivation 57% •Manufacturing 28% •Package 11% •Transport 4% Kesko continues on 'The Global 100 Most Sustainable Corporations in the World' list Kesko ranked 33rd on the 'The Global 100 Most Sustainable Corporations in the World' list. In 2010, Sustainability Yearbook, Kesko's responsibility work qualified in the SAM Silver Class in the Food & Drug Retailers sector. Fazer Ltd HK Ltd Raisio Ltd Saarioinen  Fazer Bakeries Ltd  HK-Ruokatalo Ltd  Raisio Ltd  Kesko Food Ltd  Saarioinen Ltd
  • 6.
    4.5.2013 FOODBALT-2010 S.Kurppa 6 A plate model The example lunch represented a nutritional whole according to recommendations for 1/3 of the energy need and nutrients for daily food consumption. • A plate model - the principle of dividing a plate into three parts; • half of the plate consists of vegetables, • one quarter of protein and • one quarter of carbohydrate. The portion is completed with bread and milk or water. • Shares of energy from proteins, fats and carbohydrates • protein should be 10–20 %, • from fat 25–35 % and • from carbohydrates 50–60 %.
  • 7.
    4.5.2013 FOODBALT-2010 S.Kurppa 7 The lunch plate examples
  • 8.
    4.5.2013 FOODBALT-2010 S.Kurppa 8 The Farm Accountancy Data NetworkFADN data MTT Economic Research Viljelymallit (MTT ELE) The background data Ympäristövaikutustieto tuontirehuista (MTT ELE) Viljelymallit (MTT ELE) Ympäristövaikutustieto tuontirehuista (MTT ELE) Viljelymallit (MTT ELE) Ympäristövaikutustieto tuontirehuista (MTT ELE) Data on environmental impacts of imported food materials / databases of publications Data on environmental impacts of imported feed materials / databases of publications Viljelymallit (MTT ELE) Ympäristövaikutustieto tuontirehuista (MTT ELE) Machinery Viljelymallit (MTT ELE) Ympäristövaikutustieto tuontirehuista (MTT ELE) Machinery in animal production Environmental accounting model Ketjuvastuu model MTT Ecology of Food Production Systems Crop production models MTT Animal production models (MTT ELE) Leaching and run off models/The Finnish Environment Institute, MTTProAgria Plot Databank information Environmental impacts of food processing The Finnish Enterprises - MTT Environmental impacts of logistics and trading7 Finnish trading industry MTT Data on environmental impacts of feed production /MTT Data on environmental impacts of fertilizer production/Yara Ltd Commercial feed Other input Specific information on other inputs Energy Energy Environmental assessments on customer and consumer activities National Input-output statistics Finnish Environment Institute, University of Oulu Thule-institute Assessment of the environmental impacts of material flows caused by the Finnish economy with the ENVIMAT model Machinery in crop production Data on environmental impact of imported feed materials/ databases of publications Recipes of feed products/ Finnish feed production industry
  • 9.
    4.5.2013 FOODBALT-2010 S.Kurppa 9 %The lunch plates comprised a main dish, salad, bread and a drink 9,6 g PO4 ekv I gI g I g+ + • Environmental impacts• Environmental impacts
  • 10.
    4.5.2013 FOODBALT-2010 S.Kurppa 10 0 10 20 30 40 50 60 70 80 90 100 Normalised global warming impacts of a Finn (Eco-Benchmark) Broad bean patty with mashed potatoes (veget.) home Soy bean patty with mashed potatoes (vegetarian), home Beetroot patty with barley, home Soy bean patty with mashed potatoes (ovo-lactoveget.) home Vegetable casserole, home Minced meat-macaroni casserole, ready-to-eat Rainbow trout casserole, ready-to-eat Chicken-pasta casserole, ready-to-eat Ham casserole, ready-to-eat Vegetable casserole, ready-to-eat Barley porridge with berry fool, ready-to-eat Minced chicken meat-macaroni casserole, home Frankfurter and mashed potatoes, home Barley porridge with berry fool, home Rainbow trout casserole, home Chicken sauce with wholemeal pasta, home Chicken sauce with wholemeal rice, home Chicken casserole, home Chicken in cream sauce with rice, ready-to-eat Ham casserole, home Minced meat-macaroni casserole, home Global warming impact of the case lunch plates in relation to normalised daily global warming impact of an average Finn 27, 4 kg CO2 ekv + I kgI kg I kg + % • Environmental impacts
  • 11.
    4.5.2013 FOODBALT-2010 S.Kurppa 11 A few examples of lunch plate portions, representative of the lowest and the highest impact classes
  • 12.
    4.5.2013 FOODBALT-2010 S.Kurppa 12 The two versions of the salads can be easily identified from the climate change impact of a plate. Of the alternatives of salad made from tomato, cucumber and lettuce and another made from cabbage and blackcurrants, the first had three times higher climate change impact than the second
  • 13.
    4.5.2013 FOODBALT-2010 S.Kurppa 13 0 1 2 3 4 g PO4- eqv. Raw material production Food processing Trade Home Minced meat-macaroni casserole N-leaching/run off P-leaching/run off NH3 to air NOx to air Over 90% of the impact on eutrophication and about 70% of the impact on climate change was caused by the phase of raw material production. Correlation between impacts in climate change and eutrophication, under Finnish production conditions, was high. Thus, by the choice of food items one can simultaneously decrease both major impacts. 0 1 2 3 4 kg CO2 ekqv. Raw material production Food processing Trade Home Minced meat-macaroni casserole CO2 CH4 N2O In global climate change methane and di-nitrogen oxide have a big influence compared with carbon dioxide. Management of methane and di- nitrogen oxide emissions is very challenging
  • 14.
    4.5.2013 FOODBALT-2010 S.Kurppa 14 0 0,2 0,4 0,6 0,8 1 kg CO2 eqv. Raw material production Food processing Trade Home Vegetable casserole, redy-to-eat CO2 CH4 N2O 0 0,2 0,4 0,6 0,8 1 kg CO2 ekqv. Raw material production Food processing Trade Home Broad bean patty with mashed potatoes (veget.), home CO2 CH4 N2O 0 0,2 0,4 0,6 0,8 1 kg CO2 eqv. Raw material production Food processing Trade Home Vegetable casserole, home CO2 CH4 N2O In vegetarian dishes the differences between production phases balance In vegetarian meals methane has minor importance With ready-to-eat dishes importance of impacts from home activities decrease and impacts from food processing increase
  • 15.
    4.5.2013 FOODBALT-2010 S.Kurppa 15 Summary Home made meals • eutrophication impacts 0,7 – 3.6 g PO4-eqv. • proportion of main dish in eutrophication impacts 28 – 83 %. • carbon footprint 700g – 3.4 kg CO2 eqv • proportion of main dish in carbon footprint 35 – 69 % Ready-to-eat meals • eutrophication impacts 1 – 2,1 g PO4-eqv. • proportion of main dish in eutrophication impacts 26 – 72 % • carbon foot print 1.5 - 2.3 kg CO2 eqv • proportion of main dish in carbon foot print 33 - 54 %
  • 16.
    4.5.2013 FOODBALT-2010 S.Kurppa 16 Summary on salads • Eutrophication impacts • Proportion of salad impacts of home and ready-to-eat meals 4 – 30 % • White cabbage/blackcurrant 0.21 PO4-ekv • Greenhouse vegetables 0.13 g PO4-ekv • White cabbage/carrot/pineapple 0.16 g PO4-ekv • Climate change • Proportion of salad impacts in home and ready-to-eat meals 12 – 32 % • White cabbage/blackcurrant 130 g CO2 ekv • Greenhouse vegetables 610 g CO2 ekv • White cabbage/carrot/pineapple 370 g CO2 ekv
  • 17.
    4.5.2013 FOODBALT-2010 S.Kurppa 17 • Climate change impacts of bread 146 – 606 g CO2 eqv • Proportion of impacts of milk from the whole meal 4 – 32 % (yeast raises the impacts) Summary on bread and drink • Eutrophication impacts of milk 0.32 g PO4-eqv • Proportion of impacts of milk from the whole meal 15 – 38 % • Eutrophication impacts of bread 0.1 – 0.6 g PO4-eqv • Proportion of impacts of bread from the whole meal 3 – 46 % (yeast raises the impact) • Climate change impacts of milk 330 g CO2 eqv • Proportion of impacts of milk from the whole meal 8 – 33%
  • 18.
  • 19.
  • 20.
    4.5.2013 FOODBALT-2010 S.Kurppa 20 Should we eat or not to eat?
  • 21.
    4.5.2013 FOODBALT-2010 S.Kurppa 21 Final • Environmental impacts of food can effectively be decreased by focusing on plant-based proteins, outdoor-grown vegetables and seasonal food. • To make it simple: By balancing your diet you can have a food plate that benefits health, environment and animal welfare. • More vegetarian dishes • Beans, lentils and peas as a protein source • Locally produced vegetables and fruits • Locally captured fish • Seasonal food • Sustainably produced meat • Disposal of food waste is important especially because of the impact caused by the production of unnecessary food and to a minor extent because of bio-processing food waste.
  • 22.
    4.5.2013 FOODBALT-2010 S.Kurppa 22 Thank you so much! sirpa.kurppa@mtt.fi