1. Case Study- Plastic Manufacturing Company
Turnover: USD 600 M, Employee-1500, Operation in India, SEA, Turkey, USA, 4th Largest in world
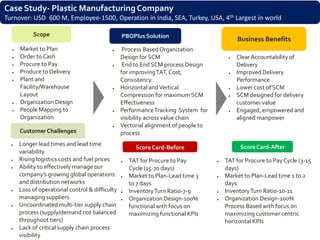
Scope PBOPlus Solution
Business Benefits
● Market to Plan ● Process Based Organization
● Order to Cash Design for SCM ● Clear Accountability of
● Procure to Pay ● End to End SCM process Design Delivery
● Produce to Delivery for improving TAT, Cost, ● Improved Delivery
● Plant and Consistency Performance
Facility/Warehouse ● Horizontal and Vertical ● Lower cost of SCM
Layout Compression for maximum SCM ● SCM designed for delivery
● Organization Design Effectiveness customer value
● People Mapping to ● Performance Tracking System for ● Engaged, empowered and
Organization visibility across value chain aligned manpower
● Vectorial alignment of people to
Customer Challenges process
● Longer lead times and lead time Score Card-After
Score Card-Before
variability
● Rising logistics costs and fuel prices ● TAT for Procure to Pay ● TAT for Procure to Pay Cycle (3-15
● Ability to effectively manage our Cycle (15-70 days) days)
company’s growing global operations ● Market to Plan-Lead time 3 ● Market to Plan-Lead time 1 to 2
and distribution networks to 7 days days
● Loss of operational control & difficulty ● Inventory Turn Ratio-7-9 ● Inventory Turn Ratio-10-11
managing suppliers ● Organization Design-100% ● Organization Design-100%
● Uncoordinated multi-tier supply chain functional with focus on Process Based with focus on
process (supply/demand not balanced maximizing functional KPIs maximizing customer centric
throughout tiers) horizontal KPIs
● Lack of critical supply chain process
visibility
2. Case Study- Explosive Manufacturing Company
Turnover: USD 200 M, Employee-700, Operation in India, largest Manufacturing of Explosive and Ancillary
Scope PBOplus Solution Business Benefits
● Process Based Organization
● End to End SCM Process Design for SCM ● Sale improved by 7-12% in
Design ● End to End SCM process Design less than 3 months across all
● SCM Cost for improving TAT, Cost, customer segment verticals
● Elimination of error Consistency ● Error in documents almost
across the SCM ● Horizontal and Vertical got eliminated
Compression for maximum SCM ● Leveraging IT
Effectiveness
● Performance Tracking System for
Customer Challenges visibility across value chain
● Vectorial alignment of people to
● Poor Van Utilization (Special process
design van for carrying Score Card-Before Score Card-After
explosives)
● Poor Allocation Factor Order to Deliver-OTIF-
● ● Order to Deliver-OTIF- 28% to
Utilization 28% 95% in 3 months time
● Poor Visibility and excessive Error in documents-30%
● ● Error in documents less than 5%
follow up for timely delivery Van Utilization- Less than
● ● Van Utilization- Increased from
● Poor asset utilization 40% 40% to almost 75%
● High Inventory turn ration Allocation Factor-92% (can
● ● Allocation Factor-92% to 102%
go upto 105%)
3. Case Study- Fashion and Apparel, Footwear and Shoes Company
Leading footwear manufacturer, Growing at 35% Per annum, average,4000+ SKUs, Almost 500 SKUs added per year, Company has moved
from 40,000 to 70,000 outlets in past 3 years, Company targets to reach 120,000 outlets in next three years
Scope PBOPlus Solution Score Card-Before
● Order to Deliver-OTIF 28%
● Market to Forecast ● Customer Order to Actual
● Forecast to Plan Delivery –Lost sale 35%
● Sale Loss Assessment ● Market to forecast- Accuracy
● OTIF tracking at 5 stage of ● Process Based 10%
delivery for all the three Organization Design ● Organization Design-100%
product verticals for SCM functional with focus on
● SCM Organization Design ● End to End SCM maximizing functional KPIs
process Design for
improving TAT, Cost,
Customer Challenges Consistency
Score Card-After
● Horizontal and Vertical
● Customer order had no Compression for ● OTIF improvement from 28% to
meaning, Production maximum SCM 65%, expected to reach 85% by
dictated Effectiveness year-end (Line-wise, quantity –wise
● Poor visibility across the ● Performance Tracking non-fulfilment in an order gets Zero
value chain System for visibility for the entire order)
● No process for assessing the across value chain ● Lost Sales brought down from 35%
lost sales and tracking the ● Vectorial alignment of to 5%
delivery performance people to process ● Fulfilment against Sales Forecast
● Volume focus mindset improved from 10% to 40% (More
● No system of assessing the than 10% variation over forecast for
SCM cost an item gets Zero)
4. Key Interventions
Process People Technology Strategy
● Templates for ● Structure ● Reports designed to ● Strategy to win, with
decision making at implemented for provide decision one input from
different stages SCM – 22 people making across the competitor in
● 28 Level – 3 deployed value chain (18) sighting
processes defined ● Separate structure ● Reports to be ● 3-year plan drawn to
● Performance for corporate and at automated (6 have week-wise and
measurement each plant already complete) SKU-wise retail data
through OTIF, Lost ● KRA / KPI definition ● Select dealers given ● Combination of
Sales and Forecast for each role stock visibility Forecast / Made to
Fulfillment ● Training and testing through system Stock /
still under progress Replenishment
Model
Infrastructure Policy and Transportation /
Culture
Business rules Supplier
● Warehouse modified ● Continuous ● Clear policies ● Transportation
● New warehouses to improvement defined for each of Scorecards
be erected / procured culture the seven L1 implemented
across the country ● Exception Processes ● Transporter feedback
management – ● Some policies built and management /
identification and into IT, others improvement
dissolution of managed by introduced
exceptions leveraging people
● Periodic review and ● Plan drawn to have
upgrade of process all policies
every quarter embedded in IT
5. Case Study- FMCG Company
Turnover: USD Mn 1000, Employee-400, Large FMCG,120 SKUs,Some SKUs have daily price changes
Sold through 36 depots to 950 dealers and 60,000 outlets
Scope Business Benefits
● Procure to Pay PBOPlus Solution
● Produce to Delivery ● Dealer satisfaction up from 45% to 75%
● Organization Design ● Depot stock out from 18% - brought down to 2%
● People Mapping to ● Prices announced every morning at 1030hrs, and
Organization visible to all distributors across the country within
● End to End SCM Design 10 minutes
Customer Challenges ● Total visibility of the value chain ● Factory stock (FG) reduced from 6 days to 3.9
– right from suppliers, within days
● Excessive procure to pay factory, in transit, out-bound, ● OTIF from Factory to Depot (40%) reached 92%
cycle (TAT) depots, and dealer stock for ● Errors in truck loading and during transit brought
● Poor visibility about 10% of dealers. For down to about one-third
● Poor plant utilization due remaining dealers, weekly ● Penalty and incentives for transporters linked to
to poor planning reports used performance
● Too many silos working ● Performance of all processes ● Dealer scorecard
for maximizing their tracked on a daily basis, and ● Monthly interface meetings with all stakeholders
functional KPIs process head to take action
Score Card-Before (why-why analysis, RCA on the Score Card-After
● TAT for Procure to Pay same day) ● One day delivery to dealers from depot
Cycle (15-70 days) ● Robust Exception ● Overnight delivery from factory to depot for
● SCM cost x% of total Management System replenishment of all depots within 300Km, 36
cost hour delivery to depots between 300-700Km,
● Organization Design- 48 hour delivery to depots within 700 to 1000
100% functional with Km
focus on maximizing ● Average Depot stock from 5 days brought
functional KPIs down to 1.8 days
6. Key Interventions
Process People Technology Strategy
● Minimum inventory ● Depot team reduced ● SAP was already ● Distribution was
levels at each depot, from 5 personnel to present, more than visualized as a
based on demand 2, by clubbing of 36 templates winning move in the
and factory lead jobs transferred to SAP industry, in light of
times ● From 51 people for implementation commoditization of
● Auto generation of across 5 functions, and daily visibility product
indents to factories only 13 in SCM. Rest and tracking / ● Lost sales at retail
● Provision for last were deployed in planning level became a
minute correction by other areas ● Vendor performance prime anxiety
depot manager data captured /
analyzed
Infrastructure Policy and Transportation /
Culture
Business rules Supplier
● Warehouse locations ● Functional to ● Existing policy ● Vendor feedback
redefined in spite of Process world documents, covering system put in place
CNF regime ● Process is 9 functions, ● Vendor rating and
● Number of depots paramount and simplified – almost development model
and dealers complete with TAT 60% thrown out ● Performance based
rationalized, based ● Multi-skilling – you ● Most functional business share and
on business need, to are responsible for policies changed to credit terms to
service different your team’s reflect company’s vendor
categories of performance Process orientation ● Same-day payment
retailers ● Sequence and time
of work