
More Related Content
What's hot
What's hot (17)
Similar to Fluxo de Caixa Nl10
Similar to Fluxo de Caixa Nl10 (20)
Recently uploaded
Recently uploaded (20)
Fluxo de Caixa Nl10
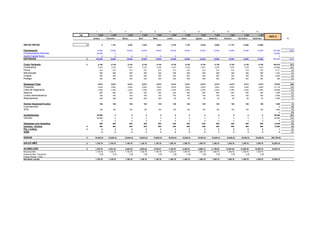
- 1. 1 2 3 4 5 6 7 8 9 10 11 12 KM 7,347 7,347 7,347 7,347 7,347 7,347 7,347 7,347 7,347 7,347 7,347 7,347 ANO A Janeiro Fevereiro Março Abril Maio Junho Julho Agosto Setembro Outubro Novembro Dezembro % SALDO INICIAL 0 0 1,151 2,302 3,452 4,603 5,754 7,105 8,455 9,806 11,157 12,508 13,858 Faturamento 18,000 18,000 18,000 18,000 18,000 18,000 18,000 18,000 18,000 18,000 18,000 18,000 216,000 100% Financiamentos Bancário 90,000 0 90,000 Aporte Capital Sócio 0 0 0 0 0 0 0 ENTRADAS 0 108,000 18,000 18,000 18,000 18,000 18,000 18,000 18,000 18,000 18,000 18,000 18,000 306,000 142% Custo Variáveis 0 9,126 9,126 9,126 9,126 9,126 9,126 9,126 9,126 9,126 9,126 9,126 9,126 109,515 51% Combustível 7,274 7,274 7,274 7,274 7,274 7,274 7,274 7,274 7,274 7,274 7,274 7,274 87,290 40% Pneus 514 514 514 514 514 514 514 514 514 514 514 514 6,171 3% Manutenção 588 588 588 588 588 588 588 588 588 588 588 588 7,053 3% Chapas 400 400 400 400 400 400 400 400 400 400 400 400 4,800 2% Pedágio 350 350 350 350 350 350 350 350 350 350 350 350 350 0% Despesas Fixas 6,673 6,673 6,673 6,673 6,673 6,473 6,473 6,473 6,473 6,473 6,473 6,473 78,676 36% Prestação 2,643 2,643 2,643 2,643 2,643 2,643 2,643 2,643 2,643 2,643 2,643 2,643 31,716 15% Folha de Pagamento 2,340 2,340 2,340 2,340 2,340 2,340 2,340 2,340 2,340 2,340 2,340 2,340 28,080 13% Seguros 650 650 650 650 650 650 650 650 650 650 650 650 7,800 4% Custos Administrativos 750 750 750 750 750 750 750 750 750 750 750 750 9,000 4% Rastreamento 290 290 290 290 290 90 90 90 90 90 90 90 2,080 1% Outras Despesas/Custos 150 150 150 150 150 150 150 150 150 150 150 150 1,800 1% Licenciamento 0 0% IPVA 150 150 150 150 150 150 150 150 150 150 150 150 1,800 1% 0 0% Investimentos 90,000 0 0 0 0 0 0 0 0 0 0 0 90,000 42% Veiculos 90,000 0 0 0 0 0 0 0 0 0 0 0 90,000 42% 0 0 0 0 0 0 0 0 0 0 0 0 0 0% Despesas com Impostos 900 900 900 900 900 900 900 900 900 900 900 900 10,800 5% Impostos - Simples 0 900 900 900 900 900 900 900 900 900 900 900 900 10,800 5% Pis + Cofins 0 0 0 0 0 0 0 0 0 0 0 0 0 0 0% ICMS 0 0 0 0 0 0 0 0 0 0 0 0 0 0% SAÍDAS 0 16,849.24 16,849.24 16,849.24 16,849.24 16,849.24 16,649.24 16,649.24 16,649.24 16,649.24 16,649.24 16,649.24 16,649.24 200,790.85 SALDO MÊS 0 1,150.76 1,150.76 1,150.76 1,150.76 1,150.76 1,350.76 1,350.76 1,350.76 1,350.76 1,350.76 1,350.76 1,350.76 15,209.15 ACUMULADO 0 1,150.76 2,301.52 3,452.29 4,603.05 5,753.81 7,104.57 8,455.34 9,806.10 11,156.86 12,507.62 13,858.39 15,209.15 15,209.15 Resultado Mês 1,150.76 1,150.76 1,150.76 1,150.76 1,150.76 1,350.76 1,350.76 1,350.76 1,350.76 1,350.76 1,350.76 1,350.76 Resultado Mês / Percentual 0.06 0.06 0.06 0.06 0.06 0.08 0.08 0.08 0.08 0.08 0.08 0.08 Imposto Renda + CSSL Resultado Líquido 1,150.76 1,150.76 1,150.76 1,150.76 1,150.76 1,350.76 1,350.76 1,350.76 1,350.76 1,350.76 1,350.76 1,350.76 15,209.15
- 2. 1 2 3 4 5 6 7 8 9 10 11 12 KM 7,347 7,347 7,347 7,347 7,347 7,347 7,347 7,347 7,347 7,347 7,347 7,347 ANO B Janeiro Fevereiro Março Abril Maio Junho Julho Agosto Setembro Outubro Novembro Dezembro % SALDO INICIAL 15,209 15,209 16,510 17,811 19,111 20,412 21,713 23,014 24,314 25,615 26,916 28,217 29,518 Faturamento 18,000 18,000 18,000 18,000 18,000 18,000 18,000 18,000 18,000 18,000 18,000 18,000 216,000 100% Financiamentos Bancário 0 0 0 Aporte Capital Sócio 0 0 0 0 0 0 0 ENTRADAS 0 18,000 18,000 18,000 18,000 18,000 18,000 18,000 18,000 18,000 18,000 18,000 18,000 216,000 100% Custo Variáveis 0 9,126 9,126 9,126 9,126 9,126 9,126 9,126 9,126 9,126 9,126 9,126 9,126 109,515 51% Combustível 7,274 7,274 7,274 7,274 7,274 7,274 7,274 7,274 7,274 7,274 7,274 7,274 87,290 40% Pneus 514 514 514 514 514 514 514 514 514 514 514 514 6,171 3% Manutenção 588 588 588 588 588 588 588 588 588 588 588 588 7,053 3% Chapas 400 400 400 400 400 400 400 400 400 400 400 400 4,800 2% Pedágio 350 350 350 350 350 350 350 350 350 350 350 350 350 0% Despesas Fixas 6,473 6,473 6,473 6,473 6,473 6,473 6,473 6,473 6,473 6,473 6,473 6,473 77,676 36% Prestação 2,643 2,643 2,643 2,643 2,643 2,643 2,643 2,643 2,643 2,643 2,643 2,643 31,716 15% Folha de Pagamento 2,340 2,340 2,340 2,340 2,340 2,340 2,340 2,340 2,340 2,340 2,340 2,340 28,080 13% Seguros 650 650 650 650 650 650 650 650 650 650 650 650 7,800 4% Custos Administrativos 750 750 750 750 750 750 750 750 750 750 750 750 9,000 4% Rastreamento 90 90 90 90 90 90 90 90 90 90 90 90 1,080 1% Outras Despesas/Custos 200 200 200 200 200 200 200 200 200 200 200 200 2,400 1% Licenciamento 150 150 150 150 150 150 150 150 150 150 150 150 1,800 IPVA 50 50 50 50 50 50 50 50 50 50 50 50 600 0 0% Investimentos 0 0 0 0 0 0 0 0 0 0 0 0 0 0% Veiculos 0 0 0 0 0 0 0 0 0 0 0 0 0 0% 0 0 0 0 0 0 0 0 0 0 0 0 0 0% Despesas com Impostos 900 900 900 900 900 900 900 900 900 900 900 900 10,800 5% Impostos - Simples 0 900 900 900 900 900 900 900 900 900 900 900 900 10,800 5% Pis + Cofins 0 0 0 0 0 0 0 0 0 0 0 0 0 0 0% ICMS 0 0 0 0 0 0 0 0 0 0 0 0 0 0% SAÍDAS 0 16,699 16,699 16,699 16,699 16,699 16,699 16,699 16,699 16,699 16,699 16,699 16,699 200,391 SALDO MÊS 0 1,301 1,301 1,301 1,301 1,301 1,301 1,301 1,301 1,301 1,301 1,301 1,301 15,609 ACUMULADO 15,209 16,510 17,811 19,111 20,412 21,713 23,014 24,314 25,615 26,916 28,217 29,518 30,818 30,818 Resultado Mês 1,300.76 1,300.76 1,300.76 1,300.76 1,300.76 1,300.76 1,300.76 1,300.76 1,300.76 1,300.76 1,300.76 1,300.76 15,609.15 Resultado Mês / Percentual 7% 7% 7% 7% 7% 7% 7% 7% 7% 7% 7% 7% Imposto Renda + CSSL Resultado Líquido 1,300.76 1,300.76 1,300.76 1,300.76 1,300.76 1,300.76 1,300.76 1,300.76 1,300.76 1,300.76 1,300.76 1,300.76 15,609.15
- 3. 1 2 3 4 KM 7,347 7,347 7,347 7,347 Janeiro Fevereiro Março Abril SALDO INICIAL 30,818 30,818 0 33,420 34,721 Faturamento 18,000 18,000 18,000 18,000 Venda Imobilizado 0 0 0 0 Aporte Capital Sócio 0 0 0 0 ENTRADAS 0 18,000 18,000 18,000 18,000 Custo Variáveis 0 9,126 9,126 9,126 9,126 Combustível 7,274 7,274 7,274 7,274 Pneus 514 514 514 514 Manutenção 588 588 588 588 Chapas 400 400 400 400 Pedágio 350 350 350 350 Despesas Fixas 6,473 6,473 6,473 6,473 Prestação 2,643 2,643 2,643 2,643 Folha de Pagamento 2,340 2,340 2,340 2,340 Seguros 650 650 650 650 Custos Administrativos 750 750 750 750 Rastreamento 90 90 90 90 Outras Despesas/Custos 200 200 200 200 Licenciamento 150 150 150 150 IPVA 50 50 50 50 Investimentos 0 0 0 0 Veiculos 0 0 0 0 0 0 0 0 Despesas com Impostos 900 900 900 900 Impostos - Simples 0 900 900 900 900 Pis + Cofins 0 0 0 0 0 ICMS 0 0 0 0 SAÍDAS 0 16,699 16,699 16,699 16,699 SALDO MÊS 0 1,301 1,301 1,301 1,301 ACUMULADO 30,818.30 32,119.06 33,419.82 34,720.58 36,021.35 Resultado Mês 1,300.76 1,300.76 1,300.76 1,300.76 Resultado Mês / Percentual 1% 5% 7% -3% Imposto Renda + CSSL Resultado Líquido 1,300.76 1,300.76 1,300.76 1,300.76
- 4. 5 6 7 8 9 10 11 12 7,347 7,347 7,347 7,347 7,347 7,347 7,347 7,347 Maio Junho Julho Agosto Setembro Outubro Novembro Dezembro 36,021 37,322 38,623 39,924 41,224 42,525 43,826 45,127 18,000 18,000 18,000 18,000 18,000 18,000 18,000 18,000 0 0 0 0 0 0 0 0 0 0 18,000 18,000 18,000 18,000 18,000 18,000 18,000 18,000 9,126 9,126 9,126 9,126 9,126 9,126 9,126 9,126 7,274 7,274 7,274 7,274 7,274 7,274 7,274 7,274 514 514 514 514 514 514 514 514 588 588 588 588 588 588 588 588 400 400 400 400 400 400 400 400 350 350 350 350 350 350 350 350 6,473 6,473 6,473 6,473 6,473 6,473 6,473 6,473 2,643 2,643 2,643 2,643 2,643 2,643 2,643 2,643 2,340 2,340 2,340 2,340 2,340 2,340 2,340 2,340 650 650 650 650 650 650 650 650 750 750 750 750 750 750 750 750 90 90 90 90 90 90 90 90 200 200 200 200 200 200 200 200 150 150 150 150 150 150 150 150 50 50 50 50 50 50 50 50 0 0 0 0 0 0 0 0 0 0 0 0 0 0 0 0 0 0 0 0 0 0 0 0 900 900 900 900 900 900 900 900 900 900 900 900 900 900 900 900 0 0 0 0 0 0 0 0 0 0 0 0 0 0 0 0 16,699 16,699 16,699 16,699 16,699 16,699 16,699 16,699 1,301 1,301 1,301 1,301 1,301 1,301 1,301 1,301 37,322.11 38,622.87 39,923.63 41,224.40 42,525.16 43,825.92 45,126.68 46,427.45 1,300.76 1,300.76 1,300.76 1,300.76 1,300.76 1,300.76 1,300.76 1,300.76 -3% -6% 7% 7% 1% -1% -4% -4% 1,300.76 1,300.76 1,300.76 1,300.76 1,300.76 1,300.76 1,300.76 1,300.76
- 5. ANO C % 216,000 100% 0 0 216,000 100% 119,711 56% 90,584 42% 6,171 4% 24,294 5% 4,800 2% 350 0% 78,546 38% 31,716 15% 27,950 13% 7,800 4% 9,000 4% 2,080 1% 2,400 0% 0 0 0 0% 90,000 42% 90,000 42% 0 0% 10,750 5% 10,750 5% 0 0% 0 0% 211,623 15,609 46,427 15,609.15 15,609.15
- 6. 1 2 3 4 5 6 7 8 9 10 11 12 KM 7,347 7,347 7,347 7,347 7,347 7,347 7,347 7,347 7,347 7,347 7,347 7,347 ANO C Janeiro Fevereiro Março Abril Maio Junho Julho Agosto Setembro Outubro Novembro Dezembro % SALDO INICIAL 46,427 0 190 1,296 3,011 2,591 2,171 1,341 2,951 4,562 4,647 4,427 3,902 Faturamento 18,000 18,000 18,000 18,000 18,000 18,000 18,000 18,000 18,000 18,000 18,000 18,000 216,000 100% Venda Imobilizado 0 0 0 0 0 0 0 0 0 0 0 0 0 Aporte Capital Sócio 0 0 0 0 0 0 0 ENTRADAS 0 18,000 18,000 18,000 18,000 18,000 18,000 18,000 18,000 18,000 18,000 18,000 18,000 216,000 100% Custo Variáveis 0 9,126 9,126 9,126 9,126 9,126 9,126 9,126 9,126 9,126 9,126 9,126 9,126 119,711 56% Combustível 7,274 7,274 7,274 7,274 7,274 7,274 7,274 7,274 7,274 7,274 7,274 7,274 90,584 42% Pneus 514 514 514 514 514 514 514 514 514 514 514 514 6,171 4% Manutenção 588 588 588 588 588 588 588 588 588 588 588 588 24,294 5% Chapas 400 400 400 400 400 400 400 400 400 400 400 400 4,800 2% Pedágio 350 350 350 350 350 350 350 350 350 350 350 350 350 0% Despesas Fixas 6,473 6,473 6,473 6,473 6,473 6,473 6,473 6,473 6,473 6,473 6,473 6,473 81,162 38% Prestação 2,643 2,643 2,643 2,643 2,643 2,643 2,643 2,643 2,643 2,643 2,643 2,643 31,716 15% Folha de Pagamento 2,340 2,340 2,340 2,340 2,340 2,340 2,340 2,340 2,340 2,340 2,340 2,340 27,950 13% Seguros 650 650 650 650 650 650 650 650 650 650 650 650 7,800 4% Custos Administrativos 750 750 750 750 750 750 750 750 750 750 750 750 9,000 4% Rastreamento 90 90 90 90 90 90 90 90 90 90 90 90 2,080 1% Outras Despesas/Custos 200 200 200 200 200 200 200 200 200 200 200 200 0 0% Licenciamento 150 150 150 150 150 150 150 150 150 150 150 150 0 IPVA 50 50 50 50 50 50 50 50 50 50 50 50 0 0 0% Investimentos 0 0 0 0 0 0 0 0 0 0 0 0 90,000 42% Veiculos 0 0 0 0 0 0 0 0 0 0 0 0 90,000 42% 0 0 0 0 0 0 0 0 0 0 0 0 0 0% Despesas com Impostos 900 900 900 900 900 900 900 900 900 900 900 900 10,750 5% Impostos - Simples 0 900 900 900 900 900 900 900 900 900 900 900 900 10,750 5% Pis + Cofins 0 0 0 0 0 0 0 0 0 0 0 0 0 0 0% ICMS 0 0 0 0 0 0 0 0 0 0 0 0 0 0% SAÍDAS 0 16,699.24 16,699.24 16,699.24 16,699.24 16,699.24 16,699.24 16,699.24 16,699.24 16,699.24 16,699.24 16,699.24 16,699.24 211,623 SALDO MÊS 0 1,301 1,301 1,301 1,301 1,301 1,301 1,301 1,301 1,301 1,301 1,301 1,301 15,609 ACUMULADO 46,427.45 47,728.21 49,028.97 50,329.73 51,630.50 52,931.26 54,232.02 55,532.78 56,833.54 58,134.31 59,435.07 60,735.83 62,036.59 62,037 Resultado Mês 1,300.76 1,300.76 1,300.76 1,300.76 1,300.76 1,300.76 1,300.76 1,300.76 1,300.76 1,300.76 1,300.76 1,300.76 Resultado Mês / Percentual 1% 5% 7% -3% -3% -6% 7% 7% 1% -1% -4% -4% Imposto Renda + CSSL Resultado Líquido 1,300.76 1,300.76 1,300.76 1,300.76 1,300.76 1,300.76 1,300.76 1,300.76 1,300.76 1,300.76 1,300.76 1,300.76 15,609.15
- 7. 1 2 3 4 5 6 7 8 9 10 11 12 KM 7,347 7,347 7,347 7,347 7,347 7,347 7,347 7,347 7,347 7,347 7,347 8,980 ANO C Janeiro Fevereiro Março Abril Maio Junho Julho Agosto Setembro Outubro Novembro Dezembro % SALDO INICIAL 62,037 0 190 1,296 3,011 2,591 2,171 1,341 2,951 4,562 4,647 4,427 3,902 Faturamento 18,000 18,000 18,000 18,000 18,000 18,000 18,000 18,000 18,000 18,000 18,000 22,000 220,000 100% Venda Imobilizado 0 0 0 0 0 0 0 0 0 0 0 60,000 60,000 Aporte Capital Sócio 0 0 0 0 0 0 0 ENTRADAS 0 18,000 18,000 18,000 18,000 18,000 18,000 18,000 18,000 18,000 18,000 18,000 82,000 280,000 100% Custo Variáveis 0 9,126 9,126 9,126 9,126 9,126 9,126 9,126 9,126 9,126 9,126 9,126 10,988 119,711 56% Combustível 7,274 7,274 7,274 7,274 7,274 7,274 7,274 7,274 7,274 7,274 7,274 8,891 90,584 42% Pneus 514 514 514 514 514 514 514 514 514 514 514 629 6,286 4% Manutenção 588 588 588 588 588 588 588 588 588 588 588 718 24,424 5% Chapas 400 400 400 400 400 400 400 400 400 400 400 400 4,800 2% Pedágio 350 350 350 350 350 350 350 350 350 350 350 350 350 0% Despesas Fixas 3,740 3,740 3,740 3,740 3,740 3,740 3,740 3,740 3,740 3,740 3,740 4,260 81,162 38% Prestação 0 0 0 0 0 0 0 0 0 0 0 0 0 15% Folha de Pagamento 2,340 2,340 2,340 2,340 2,340 2,340 2,340 2,340 2,340 2,340 2,340 2,860 27,950 13% Seguros 650 650 650 650 650 650 650 650 650 650 650 650 7,800 4% Custos Administrativos 750 750 750 750 750 750 750 750 750 750 750 750 9,000 4% Rastreamento 90 90 90 90 90 90 90 90 90 90 90 90 2,080 1% Outras Despesas/Custos 200 200 200 200 200 200 200 200 200 200 200 200 0 0% Licenciamento 150 150 150 150 150 150 150 150 150 150 150 150 0 IPVA 50 50 50 50 50 50 50 50 50 50 50 50 0 0 0% Investimentos 0 0 0 0 0 0 0 0 0 0 0 0 90,000 42% Veiculos 0 0 0 0 0 0 0 0 0 0 0 0 90,000 42% 0 0 0 0 0 0 0 0 0 0 0 0 0 0% Despesas com Impostos 900 900 900 900 900 900 900 900 900 900 900 1,100 10,750 5% Impostos - Simples 0 900 900 900 900 900 900 900 900 900 900 900 1,100 10,750 5% Pis + Cofins 0 0 0 0 0 0 0 0 0 0 0 0 0 0 0% ICMS 0 0 0 0 0 0 0 0 0 0 0 0 0 0% SAÍDAS 0 13,966.24 13,966.24 13,966.24 13,966.24 13,966.24 13,966.24 13,966.24 13,966.24 13,966.24 13,966.24 13,966.24 16,547.62 211,623 SALDO MÊS 0 4,034 4,034 4,034 4,034 4,034 4,034 4,034 4,034 4,034 4,034 4,034 65,452 109,824 ACUMULADO 62,036.59 66,070.36 70,104.12 74,137.88 78,171.64 82,205.41 86,239.17 90,272.93 94,306.69 98,340.46 102,374.22 106,407.98 171,860.36 3,377 Resultado Mês 4,034 4,034 4,034 4,034 4,034 4,034 4,034 4,034 4,034 4,034 4,034 65,452 Resultado Mês / Percentual 1% 5% 7% -3% -3% -6% 7% 7% 1% -1% -4% -4% Imposto Renda + CSSL Resultado Líquido 4,034 4,034 4,034 4,034 4,034 4,034 4,034 4,034 4,034 4,034 4,034 65,452 3,376.81