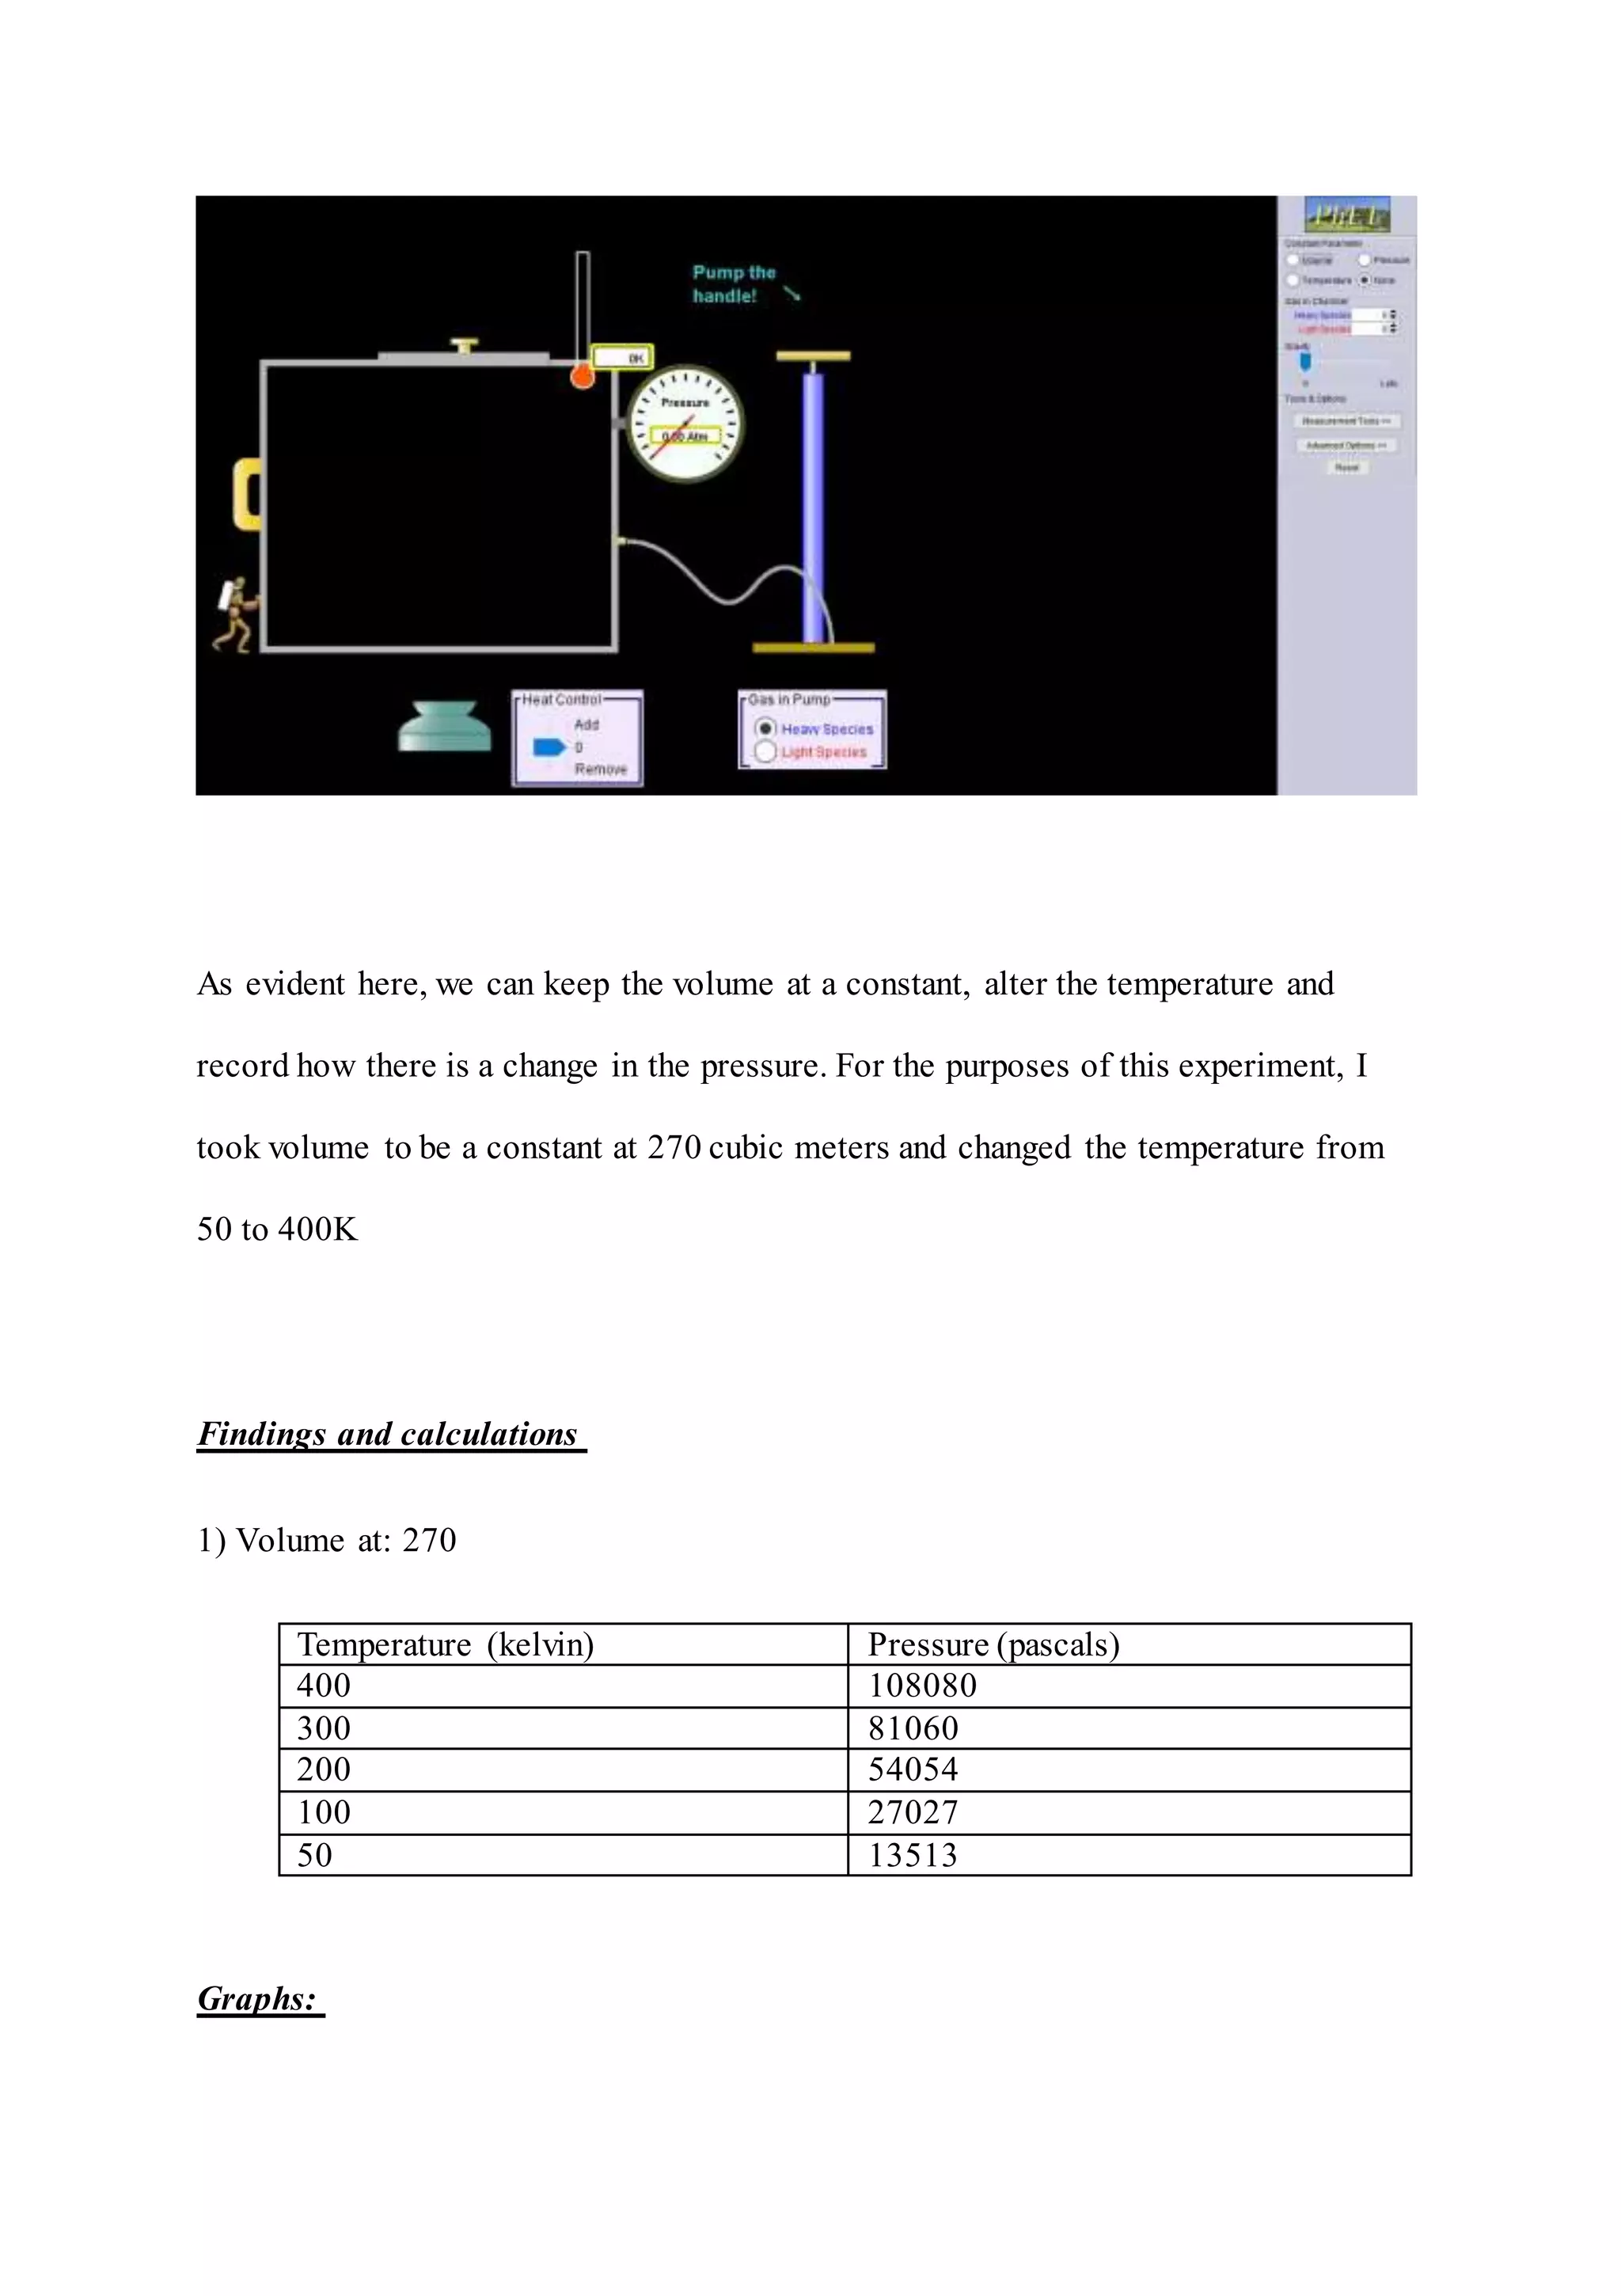
GAY-LUSSAC LAW LAB REPORT
December / 13/2021
EXPERIMENT PERFORMED BY:
Ahmad sarbast
Table of content
•
Objective
•
Theory
•
Known and required variables
•
Materials
•
Experimental procedure
•
Calculation
•
Conclusion
Objective- examining the effect in pressure with a change in temperature.
Theory –
There are three theories about perfect gas behaviour, namely: Charles law, boyles law
and Gay- Lussac law. This experiment aims to prove the Gay-Lussac law which
dictates:
When the volume of gas is kept at a constant, the pressure and the temperature are
directly proportional. Which is the same as to say that when the pressure is increased,
the temperature is increased likewise. Kinetic energy is an attribute of temperature and
hence when the pressure is increased, particles are confined in lesser space, resulting
in more collisons. And kinetic energy is nothing but the collisions of these particles so
it increases too, and hence the temperature is also increased. The following equation
encapsulates this law :
Wherein P1 is the initial pressure and P2 is the final pressure.
Because they are directly proportional there is a linear trend seen, as evident in the
following graph:
Variables –
1. Independent variable - temperature
2. Dependent variable – pressure
3. Controlled variable- volume
Material required –
On account of the lack of materials in our physics lab to perform this experiment, it
was done through a simulation using PHET Colorado, hence nothing more than a
computer with internet access is needed.
Procedure –
Upon opening the simulation, in Phet, we would be met with the following:
As evident here, we can keep the volume at a constant, alter the temperature and
record how there is a change in the pressure. For the purposes of this experiment, I
took volume to be a constant at 270 cubic meters and changed the temperature from
50 to 400K
Findings and calculations
1) Volume at: 270
Temperature (kelvin) Pressure (pascals)
400 108080
300 81060
200 54054
100 27027
50 13513
Graphs:
calculation:
Because we used a simulation, the results are as convenient and precise as can be. We
can equate the initial pressure and volume to the final pressure and volume with this
relation:
To validate the experiment and the equation.
Taking the initial pressure as = 108080 pascal
Final pressure as = 13513 pascal
Initial temperature as 400 kelvins
And final temperature as 50 kelvins, we find:
108080 x 50 = 5404000
400 x 13513= 5404000
Thus, making the equation valid and our results too. LHS=RHS
Conclusion:
Through a simulation the experiment was conducted in order to investigate the
relationship between the pressure and the temperature when the volume and number
of molecules is kept at a constant. We found that the readings of our simulation
perfectly align with the theory of the perfect Gas law of Gay-lussac. However,
conducting this experiment in a simulation isn’t a real-world demonstration of how
gases behave because gases are generally real and not perfect as described in this
experiment.
Keeping that in mind, in the aforementioned graph, it can be distinctly observed that
there is a positive correlation in the pressure and temperature, meaning hen we
increased the temperature the pressure also increased in a linear trend. Thus, when
perfect gases are used the Gay- Lussac law is held.
Reference
1. chem.libretexts
2. byjus.com

fluid.docx

  • 1.
    GAY-LUSSAC LAW LABREPORT December / 13/2021 EXPERIMENT PERFORMED BY: Ahmad sarbast
  • 2.
    Table of content • Objective • Theory • Knownand required variables • Materials • Experimental procedure • Calculation • Conclusion
  • 3.
    Objective- examining theeffect in pressure with a change in temperature. Theory – There are three theories about perfect gas behaviour, namely: Charles law, boyles law and Gay- Lussac law. This experiment aims to prove the Gay-Lussac law which dictates: When the volume of gas is kept at a constant, the pressure and the temperature are directly proportional. Which is the same as to say that when the pressure is increased, the temperature is increased likewise. Kinetic energy is an attribute of temperature and hence when the pressure is increased, particles are confined in lesser space, resulting in more collisons. And kinetic energy is nothing but the collisions of these particles so it increases too, and hence the temperature is also increased. The following equation encapsulates this law : Wherein P1 is the initial pressure and P2 is the final pressure. Because they are directly proportional there is a linear trend seen, as evident in the following graph:
  • 4.
    Variables – 1. Independentvariable - temperature 2. Dependent variable – pressure 3. Controlled variable- volume Material required – On account of the lack of materials in our physics lab to perform this experiment, it was done through a simulation using PHET Colorado, hence nothing more than a computer with internet access is needed. Procedure – Upon opening the simulation, in Phet, we would be met with the following:
  • 5.
    As evident here,we can keep the volume at a constant, alter the temperature and record how there is a change in the pressure. For the purposes of this experiment, I took volume to be a constant at 270 cubic meters and changed the temperature from 50 to 400K Findings and calculations 1) Volume at: 270 Temperature (kelvin) Pressure (pascals) 400 108080 300 81060 200 54054 100 27027 50 13513 Graphs:
  • 6.
    calculation: Because we useda simulation, the results are as convenient and precise as can be. We can equate the initial pressure and volume to the final pressure and volume with this relation: To validate the experiment and the equation. Taking the initial pressure as = 108080 pascal Final pressure as = 13513 pascal Initial temperature as 400 kelvins And final temperature as 50 kelvins, we find:
  • 7.
    108080 x 50= 5404000 400 x 13513= 5404000 Thus, making the equation valid and our results too. LHS=RHS Conclusion: Through a simulation the experiment was conducted in order to investigate the relationship between the pressure and the temperature when the volume and number of molecules is kept at a constant. We found that the readings of our simulation perfectly align with the theory of the perfect Gas law of Gay-lussac. However, conducting this experiment in a simulation isn’t a real-world demonstration of how gases behave because gases are generally real and not perfect as described in this experiment. Keeping that in mind, in the aforementioned graph, it can be distinctly observed that there is a positive correlation in the pressure and temperature, meaning hen we increased the temperature the pressure also increased in a linear trend. Thus, when perfect gases are used the Gay- Lussac law is held.
  • 8.