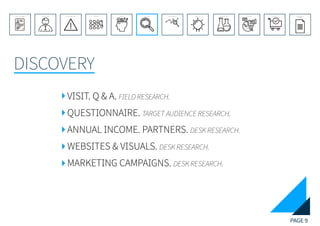
Here are the key findings from our questionnaire survey:
- The majority of visitors are families with children under 12, visiting grandparents, or school/university groups between ages 19-26.
- Most visitors learn about Fjord & Baelt through word of mouth, social media, or their website.
- Visitors want to learn about marine life in an engaging way while also being entertained. Many find the center's current overuse of text-heavy displays unattractive.
- Younger visitors ages 12-26 are highly active on social media platforms like Instagram and Facebook and want to see more visual/video content online and at the center.
- Visitors would be more likely to return or recommend Fjord
Cardboard Hospital - Prototyping Patient-centered Hospital Environments and S...Juha Kronqvist
Cardboard hospital is a real-size prototyping environment for hospital environments and services. It is used in co-designing with patients, staff and architects.
More information: http://designforhealthcare.blogspot.com/
Connecting The Play of Improv with The Work of Ethnographic Research Steve Portigal
In this session we look at the connections between improv and ethnography. Improv is not "stand-up comedy." It's a series of games with rules that offer huge degrees of freedom within a set of constraints. In these games we bring out a lot of basic, quickly understood and communicated rules of culture that are implicit, not explicit. User research has interesting similarities with improv: Both are in-the-moment processes; we learn upon reflection; there's enormous unspoken collaboration and there is often an "aha" moment.
You will learn more about improv, listening, creativity, ethnography, and how they all connect together.
Learn how to create a winning strategy and design concepts through strategy workshops and design studios. Find out how UX is at the heart of hot concepts such as LeanUX, Design Thinking and Agile Development.
IDBM x Slush – Service Leadership Minor HandbookIDBMAalto
University should be where the students are. Discover the innovative IDBM x Slush Service Design/Leadership Minor programme designed to amplify the Slush team lead experience to the next level.
Cognition In Today's Workplace: Striking The Balance Between Work, Tech, & Ho...TPGmarketing
Much has been said about the changing nature of work and the workplace of the future – how new technologies are increasing productivity, encouraging collaboration, and enabling the workforce of the 21st century. The majority of the dialogue has been focused on both the physical and virtual environments. Our presentation takes this a step further and looks at the cognitive environment – How our newly developed technology consumption behaviors are affecting our cognitive processes and how the physical environment can be designed to enhance our collective intellectual capacity.
Seminar presented by TPG's Directors of Innovation and Strategy Kelly Bacon and Rachel Starobinsky
Software Agility - Necessary...but not SufficientTathagat Varma
My presentation at Agile Tours 2012 at Bangalore. In this presentation, I have taken a hard look at how the basic agile adoption appears to be rather ineffective in the face of today's problems that are much more complex, dynamic and uncertain. I outline hat I consider as inadequacies of agility as we understand today. I also discuss Lean Startup framework as a better way to address some of these shortcomings. Feedback welcome...
UX Speakeasy Conference Presentation, San Diego, March 31, 2012. Creating a winning User Experience Strategy. Strategic User Experience design process.
meMap is an iPhone app for young people that allows them to monitor, record and understand their emotional wellbeing. Using art to reflect their moods, it enables them to recognize patterns and potential impacting triggers. It encourages personal reflection and expression and offers an environment in which users can share their visual journeys safely.
Focus on various aspects of creativity with this content ready Implementing Design Thinking Powerpoint Presentation Slides. Design thinking PowerPoint complete deck has 14 custom made PPT slides such as why we need innovation in business processes & operations, where does design thinking add value, how does design thinking work in business processes & operations, process roadmap, recommendations, etc. All templates are 100 % editable in PowerPoint so that users can enter text in the placeholders, change color if they wish to and present in the shortest possible time. Showcase building blocks of design thinking like observation, prototyping, ideation and testing using systems thinking presentation deck. Utilize our design thinking framework PPT visuals to create an understanding of overall workflow. Furthermore, you can also present the systematic approach of design thinking with the help of this visually appealing implementing innovation PowerPoint template. Download pre-made strategic design presentation deck to transmit your message in an impressive manner. Grab the chance as it comes with our Implementing Design Thinking Powerpoint Presentation Slides. They enable you to follow the ball. https://bit.ly/3hWEZFH
Presenting this set of slides with name - Implementing Design Thinking Powerpoint Presentation Slides. This deck comprises of a total of fourteen slides. It has PPT templates with creative visuals and well-researched content. This content ready presentation deck is fully editable. Just click the DOWNLOAD button below. Change the color, text and font size. You can also modify the content as per your need. Users can easily download the presentation slides in a widescreen and standard format. These templates are compatible with Google Slides too. The user can use the PowerPoint presentation in PDF or JPG format.
Enterprises are behind many of the systems that run human life on our planet: government, healthcare, finance, big tech, you name it. Can we design them to be more useful for people, and more successful in creating a positive impact?
In this webinar, Milan will introduce you to Enterprise Design, an emerging practice aiming to do just that. It requires going beyond the typical scope of design for better products or services, and instead focusing on the enterprise itself as both the environment to reshape and our material to design with. Milan will take you the core ideas of Enterprise Design: an approach for connecting customer-centred product and service development with the architectural changes required to deliver. Combining ingredients of Architectural and Design Thinking with applied Systems Design, Enterprise Design provides a holistic and systemic approach to help you deal with the challenges of innovation and transformation at enterprise scale.
Startup Weekend Copenhagen #CphSW November 2016 Edition Aleksander Bordvik
In November 2016, Startup Weekend Copenhagen had focus on virtual and augmented reality.
See who made the weekend possible.
Keep in touch Startup Weekend Copenhagen on Social media using the #CphSW.
A big thanks to all the attendees, organisers, mentors, jury and partners.
At Minke we believe that each company has the ability to disrupt and hack its own business in a positive sense in order to improve it. How? By learning to change our ways of perceiving reality and ways of working together.
We have developed an innovative way to work together with our clients, leading them faster to unexpected solutions for their business strategy, technologies, and new products and services.
But how? With two simple steps: Think & Make.
We organize four different types of collective sessions to help you hack your business and improve it. In doing so, we deliver new visions, new ways of working, and new results.
Why User Research is must in Product DevelopmentPuneet Arora
User research deals with understanding the users, their habits and needs in its very basic terms. This analysis leads to better insights about the user(s) and leads to better products.
Please visit: https://in.linkedin.com/in/puneetkum
Product designer is amalgamation of technology, computer science and management thus it is a very responsible post. If we see it from a business perspective then we find that a business is a giant structure as a whole and there are different aspects to it. A product designer is responsible for creating or making a product which is useful to users. He needs to take direction from the business and its goal along with his own creativity.
Design Studio: The User Experience Practitioner’s Secret WeaponBrilliant Experience
We all want the best , but often other priorities get in the way: “Bob from Marketing wants it to…”, “The developers don’t like that approach...”, “That feature is a ‘nice to have’”.
This slide deck will walk you through a design studio and how it can be a great tool to align product owners, developers and UX teams on an approach that balances user and business needs.
Product designer is amalgamation of technology, computer science and management thus it is a very responsible post. If we see it from a business perspective then we find that a business is a giant structure as a whole and there are different aspects to it. A product designer is responsible for creating or making a product which is useful to users. He needs to take direction from the business and its goal along with his own creativity.
VicHealth Physical Activity Innovation Challenge Concept Development Workshop...Doing Something Good
Our slides from the Concept Development Workshop with VicHealth Wed 10 September 2014. Participants, 12 teams, were finalists in the Physical Activity Innovation Challenge. They included representatives from sporting clubs and associations, health and fitness professionals, policy makers, entrepreneurs and change makers. The Concept Development Workshop was the third of a three-part workshop series to build capability in the sector to generate and implement innovative ideas to get Victorians active, and to help applicants for the VicHealth Innovation Challenge to develop their ideas to get the inactive active and reach the hard to reach. Participants were led through the development of a Business Model Canvas for their concept. Learn more about the VicHealth Innovation Challenge here: http://challenge.vichealth.vic.gov.au/
SSBMInnovation Business Model Design Workshop-1Antony Upward
Presentation for first workshop (May 15, 2013) to design the business model for the crowd-funded collaborative project which will create the "book" / toolkit for Strongly Sustainable Business Model Innovation (http://www.SSMBG.com).
As usual, recommended downloading the presentation and viewing in slideshow mode with the speakers notes handy
Hello everyone! I am thrilled to present my latest portfolio on LinkedIn, marking the culmination of my architectural journey thus far. Over the span of five years, I've been fortunate to acquire a wealth of knowledge under the guidance of esteemed professors and industry mentors. From rigorous academic pursuits to practical engagements, each experience has contributed to my growth and refinement as an architecture student. This portfolio not only showcases my projects but also underscores my attention to detail and to innovative architecture as a profession.
Book Formatting: Quality Control Checks for DesignersConfidence Ago
This presentation was made to help designers who work in publishing houses or format books for printing ensure quality.
Quality control is vital to every industry. This is why every department in a company need create a method they use in ensuring quality. This, perhaps, will not only improve the quality of products and bring errors to the barest minimum, but take it to a near perfect finish.
It is beyond a moot point that a good book will somewhat be judged by its cover, but the content of the book remains king. No matter how beautiful the cover, if the quality of writing or presentation is off, that will be a reason for readers not to come back to the book or recommend it.
So, this presentation points designers to some important things that may be missed by an editor that they could eventually discover and call the attention of the editor.
Expert Accessory Dwelling Unit (ADU) Drafting ServicesResDraft
Whether you’re looking to create a guest house, a rental unit, or a private retreat, our experienced team will design a space that complements your existing home and maximizes your investment. We provide personalized, comprehensive expert accessory dwelling unit (ADU)drafting solutions tailored to your needs, ensuring a seamless process from concept to completion.
Transforming Brand Perception and Boosting Profitabilityaaryangarg12
In today's digital era, the dynamics of brand perception, consumer behavior, and profitability have been profoundly reshaped by the synergy of branding, social media, and website design. This research paper investigates the transformative power of these elements in influencing how individuals perceive brands and products and how this transformation can be harnessed to drive sales and profitability for businesses.
Through an exploration of brand psychology and consumer behavior, this study sheds light on the intricate ways in which effective branding strategies, strategic social media engagement, and user-centric website design contribute to altering consumers' perceptions. We delve into the principles that underlie successful brand transformations, examining how visual identity, messaging, and storytelling can captivate and resonate with target audiences.
Methodologically, this research employs a comprehensive approach, combining qualitative and quantitative analyses. Real-world case studies illustrate the impact of branding, social media campaigns, and website redesigns on consumer perception, sales figures, and profitability. We assess the various metrics, including brand awareness, customer engagement, conversion rates, and revenue growth, to measure the effectiveness of these strategies.
The results underscore the pivotal role of cohesive branding, social media influence, and website usability in shaping positive brand perceptions, influencing consumer decisions, and ultimately bolstering sales and profitability. This paper provides actionable insights and strategic recommendations for businesses seeking to leverage branding, social media, and website design as potent tools to enhance their market position and financial success.
Between Filth and Fortune- Urban Cattle Foraging Realities by Devi S Nair, An...Mansi Shah
This study examines cattle rearing in urban and rural settings, focusing on milk production and consumption. By exploring a case in Ahmedabad, it highlights the challenges and processes in dairy farming across different environments, emphasising the need for sustainable practices and the essential role of milk in daily consumption.
Dive into the innovative world of smart garages with our insightful presentation, "Exploring the Future of Smart Garages." This comprehensive guide covers the latest advancements in garage technology, including automated systems, smart security features, energy efficiency solutions, and seamless integration with smart home ecosystems. Learn how these technologies are transforming traditional garages into high-tech, efficient spaces that enhance convenience, safety, and sustainability.
Ideal for homeowners, tech enthusiasts, and industry professionals, this presentation provides valuable insights into the trends, benefits, and future developments in smart garage technology. Stay ahead of the curve with our expert analysis and practical tips on implementing smart garage solutions.
3. PAGE 3
EXECUTIVE SUMMARY
REFERENCE LIST
APPENDIX
CONCLUSIONEVOLUTIONEXPERIMENTATIONIDEATIONINTERPRETATIONDISCOVERYANALYSISMETHODSPROBLEM DEFINITIONINTRODUCTIONEXECUTIVE SUMMARY
The following report contains a solution for an updated visual identity using Design Thinking Method and a marketing campaign for Fjord & Baelt.
Research Made Fun is a project focused on improving visitors experience in Fjord & Baelt’s research center through a new way of displaying infor-
mation in their website, advertisement and the facility itself. Updated visual identity focuses on expanding the usage of photography and video
throughout Fjord & Baelt’s media, yet without sacrificing the amount of information given in text form. This approach will give an eye-catching image
to a Research Center, making it a more desirable destination for a younger audience.
A Communication Plan within the Ideation part of the report contains a media campaign plan focused to bring or bring back the attention to Fjord
& Baelt with an updated visual identity and possibly increase the amount of visitors.
4. PAGE 4
INTRODUCTION
REFERENCE LIST
APPENDIX
CONCLUSIONEVOLUTIONEXPERIMENTATIONIDEATIONINTERPRETATIONDISCOVERYANALYSISMETHODSPROBLEM DEFINITIONINTRODUCTIONEXECUTIVE SUMMARY
“Fjord&Bælt is a combined research and experience center which commu-
nicates knowledge about marine life in the waters of Denmark. Fjord&Bælt
is one of the few places in the world where it is possible to get close to ma-
rine animal life. Observe our daily routines of training and feeding our two
porpoises – Freja and Sif – or our playful seals – Svante, Tulle and Naja. The
animals live and swim in true-to-nature basins continuously supplied with
fresh seawater from the fjord.
The center’s interesting exhibitions display a wide selection of fish and ben-
thic fauna, and it is also possible to listen to the biologist’s interesting sto-
ries – for a stimulating injection of knowledge vitamins for your brain. You
can also take part in our crab-catching competitions, fish-feedings, family
concerts and interesting lectures and films.
Pet a crab or feel a flatfish in our “touch pools” or take a walk on the bottom
of the sea (without getting your feet wet, mind you!) through our 40-me-
tre-long underwater tunnel, where you can catch glimpses of porpoises
and seals under water.
Visit Fjord&Bælt in Kerteminde for a magical experience filled with
memorable impressions!”
www.fjordbaelt.dk/index.php/en/
In this report document our group would like to present the reader a
well structured and refined visual identity with a different marketing
and business approach to address what we believe is the main issue
with how Fjord & Baelt operates based on our research findings.
5. PAGE 5
PROBLEM DEFINITION
REFERENCE LIST
APPENDIX
CONCLUSIONEVOLUTIONEXPERIMENTATIONIDEATIONINTERPRETATIONDISCOVERYANALYSISMETHODSPROBLEM DEFINITIONINTRODUCTIONEXECUTIVE SUMMARY
How might Fjord & Baelt reach their target group more efficiently?
How might we make the center more appealing to our future visitors?
How do we display the information in a more entertaining and engaging way?
The main problem for Fjord & Baelt is how to reach their target audience in the correct way that is also entertaining and engaging for their visitors.
Their display of information is based around too much text and reading that doesn’t involve customer engagement, and our main aim is to change
this.
Since Fjord & Baelt is a research and experience center, the way they communicate their knowledge to the younger target audience (kids) needs
improvements in order to be easily understandable.
Based on our research and interview with the centers management, the website of Fjord & Baelt needs to brought in line with the current web devel-
op standards and trends. One of our main focuses for their website involves creating a video gallery that represents what the center stands for in a
more visually appealing way to their customers. Besides a video gallery, we have also decided to redesign their website with the correct web develop
and design methods kept in mind.
6. PAGE 6
METHODS
REFERENCE LIST
APPENDIX
CONCLUSIONEVOLUTIONEXPERIMENTATIONIDEATIONINTERPRETATIONDISCOVERYANALYSISMETHODSPROBLEM DEFINITIONINTRODUCTIONEXECUTIVE SUMMARY
Design Thinking Process
The design thinking process is a creative framework
which will give the whole project a structure, it is
based on the following 5 phases. Phase one “Dis-
covery” is about researching, gathering information,
and getting inspiration for developing a concept
Phase two “Interpretation” is where the information
and research findings are utilized for framing op-
portunities for the concept. Phase three “Ideation”
This phase is used for generating and refining ideas.
Phase four “Experimentation” is the prototype part
of the design thinking process, here you create it,
and test it. Phase five “Evolution” is about recogniz-
ing problems the concept might face in the future,
track your learnings, and do more research to move
forward.(IDEO, 2012)
Personas
Personas is a method used for us to know the exact
target audience we would like to reach, it is a de-
scription of the stereotype we want to reach with our
campaign, installation, website etc.
For developing a product in a group, a persona is a
key element in order for everyone to follow the same
track.(Andersen et al., 2011)
Risk Analysis
Risk Analysis is a method used for the team to know
what to do, if anything goes wrong. In the early stage
of the project, a risk analysis is created, in order to
know the responses for things that might go wrong.
Astheseriskresponsesdoesnothavetobediscussed
in the middle of an ongoing project, it will ultimately
save the team time. (Tonnquist and Hørlück, 2009)
Tonnquist, B. and Hørlück, J. (2009). Project Man-
agement - A Complete Guide. 1st ed. Aarhus: Renate
Nielsen Academia, pp.148-160.
Stakeholder Map
The Stakeholder Map is made in order to know who
is involved in the project. It gives the group a clear
vision of who is close the the project, who has a lot
of influence. These stakeholders help shape the out-
come of the final product.(Stakeholdermap.com,
2017)
SCRUM
The SCRUM method is a project management tool,
which helps organizing the stories for the whole pro-
ject. It is a good tool to get a clear overview of the
project as a whole, but also to see each individual
task.
It involves around product backlog, sprints and daily
scrum meetings.(Scrum in 5 Minutes, 2012)
Business Model Canvas
The method Business Model Canvas, or for short
“BMC” is a visual chart of the the elements which de-
scribes the product’s value proposition, customers,
infrastructure and finances. The template is struc-
tured by building stones, which all affect each other,
this can be utilized to develop our concept.(Oster-
walder and Pigneur, 2013)
Moodboard
Moodboard is a collage of pictures and text to gen-
erate a certain mood for the person looking at it, it
is used early in the process for generating ideas and
concepts for the project.(A Practical Guide to Design-
ing for the Web, 2009)
Sketches and Wireframes
This method is used early in the design thinking pro-
cess, as sketches and wireframes will be used in the
ideation phase. Sketches can be used for generating
logos, concepts etc.
7. PAGE 7
METHODS
REFERENCE LIST
APPENDIX
CONCLUSIONEVOLUTIONEXPERIMENTATIONIDEATIONINTERPRETATIONDISCOVERYANALYSISMETHODSPROBLEM DEFINITIONINTRODUCTIONEXECUTIVE SUMMARY
Wireframes starts with a low-fi wireframe, which will
be user tested, feedback from the low-fi will then
move onto a hi-fi wireframe, which will “BLOSSOM”
into the final website.(Chapman, 2017)
Prototyping
Prototyping is an important step in the process of
making a final concept product. The prototype will
be used for testing in favor of getting useful feed-
back. This feedback will go in to consideration, for us
to have the best possible outcome of a final product.
(Steane, 2017)
Think Aloud Testing
The Think Aloud Testing is about knowing what your
consumers think, while going through a preset of
tasks. It gives you their thought process of your de-
sign, It is a useful tool, to discover possible errors
with the usability of a product.(Nielsen, 2012)
CRAP
CRAP method, is used to get an overview of the vis-
uals for the product. CRAP consists of contrast, repe-
tition, alignment and proximity, it is called four prin-
ciples of design. (Landa, 2013)
TEA
Touch, Enthuse and Act. our team is going to use this
method to properly structure the campaign website
in a way that guides the viewer to a “call to action”
section. Ellis, J. (2017).
Desk & Field Research
Desk and Field Research method, is used for re-
searching before going into the interpretation phase.
The secondary research, or desk research is gather-
ing information already available, this part is used
for making the target group, and persona. Primary
research is information you gather that did not al-
ready exist, this research we got from going out to
Fjord&Bælt where we gathered new data through
pictures, videos, and the presentation from the cli-
ent. (Businesscasestudies.co.uk, 2017)
Use Case Diagram
This method is used to show the simplest form of
interaction with the system. It is used to identify the
different uses for each type of users of the system.
(Uml-diagrams.org, n.d.)
Communication Plan
The communication plan is about providing the
stakeholders information about the project. The
plan shows who should be giving what information,
when this information is being delivered, and which
channels we are going to communicate through
when delivering the information.(Ctb.ku.edu, 2016)
Customer Journey Map
This method can be used together with the persona,
It is used to develop empathy for the customer. This
is help the team knowing how the customer will in-
teract with our brand overtime, and which channels
they will use.(Alvarez, 2017)
Creative Brief
A short summary for everyone involved in
said project portraying the most important
parts. (Adcracker.com, n.d.)
8. PAGE 8
ANALYSIS
REFERENCE LIST
APPENDIX
CONCLUSIONEVOLUTIONEXPERIMENTATIONIDEATIONINTERPRETATIONDISCOVERYANALYSISMETHODSPROBLEM DEFINITIONINTRODUCTIONEXECUTIVE SUMMARY
ANALYSIS
EVOLUTION EXPERIMENTATION
IDEATION
INTERPRETATIONDISCOVERY
D E S I G N
THINKING
The design thinking process is a creative
framework which will give the whole pro-
ject a structure, it is based on the following
5 phases.
Phase one “Discovery” is about research-
ing, gathering information, and getting in-
spiration for developing a concept
Phase two “Interpretation” is where the
information and research findings are uti-
lized for framing opportunities for the con-
cept.
Phase three “Ideation” This phase is used for
generating and refining ideas.
Phase four “Experimentation” is the pro-
totype part of the design thinking process,
here you create it, and test it.
Phase five “Evolution” is about recognizing
problems the concept might face in the fu-
ture, track your learnings, and do more re-
search to move forward.(IDEO, 2012)
10. PAGE 10
REFERENCE LIST
APPENDIX
CONCLUSIONEVOLUTIONEXPERIMENTATIONIDEATIONINTERPRETATIONDISCOVERYANALYSISMETHODSPROBLEM DEFINITIONINTRODUCTIONEXECUTIVE SUMMARY
VISIT. Q & A. FIELD RESEARCH.
Q & A Session
Our group’s discovery phase begins with a visit to the Fjord & Baelt center
where we were able to learn about our client for the first time. This visit serves
as a field research for our project, therefore we have been taking numerous
pictures and videos on the spot to use it for later reference.
We have had the opportunity to freely observe the center and its visitors for
a couple hours. We took a full tour of the center without guidance to explore
their exhibitions and the animals themselves.
Afterwards we have been guided to a meeting point outside where they keep
their animals to observe how they have been fed and trained in front of the
visitors. The show has been set up in a way to both entertain and educate the
visitors with the help of five seals and two porpoise whales. The show’s leader
has been narrating the event in Danish language but always provided a brief
explanation in English as well.
Following this show we have had the opportunity to sit through a Question &
Answer session with a representative from Fjord & Baelt where we could ask
all the questions we came up with.
Our main conclusions from the Question & Answer session are:
They believe in their problem being too much text across the research center.
New, updated website would be a pleasant change.
Experience, fascination and understanding - these are the most important
keywords for Fjord & Baelt.
Media Campaign budget reaches up to 400 000dkk, & for anything else, the
money has to be raised.
One of their main purposes towards their audience is to educate them about
the importance & beauty of nature, thus making them more aware and pro-
tective of it.
Fjord & Baelt is one in five only places in the world and the only place in den-
mark where you can visit porpoise whales.
(See appendeix 7, page 84)
11. PAGE 11
REFERENCE LIST
APPENDIX
CONCLUSIONEVOLUTIONEXPERIMENTATIONIDEATIONINTERPRETATIONDISCOVERYANALYSISMETHODSPROBLEM DEFINITIONINTRODUCTIONEXECUTIVE SUMMARY
QUESTIONNAIRE. TARGET AUDIENCE RESEARCH.
While our group was about to draw conclusions from the visit at the center
and the Q & A session, we have felt that there isn’t enough insight for us to tru-
ly empathise with the center and their visitors. Therefore we have decided as
a group that we would like to go back to the center and have another, more
in depth field research on the spot.
To prepare this research, we have managed to get in contact with the center
and they were more than happy to grant us free entry for the day. Our group
has prepared a research plan for our upcoming visit at the center, which con-
sisted the following parts:
Video Footage Storyboards
Pictures
Questionnaire Survey
Technical material such as video cameras and an ipad has been borrowed
from EAL to conduct our field research.
During our first visit to the center we have been taking videos and pictures
purely on research basis, not looking out for small details like lightning and
composition. This time however, we wanted to make more commercial shots
for possible advertisement purposes in the future.
Our group have prepared a survey to hand out on an ipad at Fjord & Baelt in
order to gain more insight about our target group and how to reach them.
The main questions we were seeking are related to their age, use of medias
and demographic information.
Based on the responses above we have concluded that mainly we have
three kinds of target groups by age.
A, Children under 12 visiting with their parents or grandparents.
B, Youngsters between the age of 19 to 26 visiting mainly because of school
C, Elderly above 60 (Grandparents visiting and their grandchildren.)
Therefore our three main audience is in A, B and C age group.
12. PAGE 12
REFERENCE LIST
APPENDIX
CONCLUSIONEVOLUTIONEXPERIMENTATIONIDEATIONINTERPRETATIONDISCOVERYANALYSISMETHODSPROBLEM DEFINITIONINTRODUCTIONEXECUTIVE SUMMARY
QUESTIONNAIRE. TARGET AUDIENCE RESEARCH.
In this question we were looking for statistics on different kind of media devices we
could use to reach our target audience.
Concluding on our question about Social Media we were looking for answers
on how and where we can reach our target groups. Not surprisingly, we have
found out that the easiest way to reach all of our target groups is by Face-
book. This is the social media which has been used by far the highest rate of
the responses. Our elder target group is most likely only using only Facebook
rather than any other Social Media platform.
Instagram and Snapchat has been picked by our youngster target group
mainly. Trip Advisor and Twitter falling behind on our survey results. This
shows that none of them are popular in Denmark at the moment.
In the pie chart on the left we
are presenting our results from
the demographical question
we have set up for our partic-
ipants.
It shows clearly that almost
85% of the people that we
have asked came from the Fu-
nen region of Denmark.
What is the location of Fjord & Baelt, Kerteminde, Odense and Svendborg cities
and is the third largest island in Denmark with a population of almost half a mil-
lion people.
14. PAGE 14
REFERENCE LIST
APPENDIX
CONCLUSIONEVOLUTIONEXPERIMENTATIONIDEATIONINTERPRETATIONDISCOVERYANALYSISMETHODSPROBLEM DEFINITIONINTRODUCTIONEXECUTIVE SUMMARY
ANNUAL INCOME. PARTNERS. DESK RESEARCH.
WehaveconductedananalysisofFjord&Baelt’spartnersandannualincome
based on the information we have been given by the center. Their partners
and the annual income reports are both displayed on the current website.
While we were researching our partners, we conducted that information
about out competitors is an important aspect of the design thinking process
as well. We were gathering information and statistics through Danmarks
Statistik(Dst.dk, 2017).
Furthermore, the group analysed Fjord&Bælt as well as Naturamas annual
revenue(Anon, 2017), to get a better understanding of both facilities.
Resultatopgorelse for 2015
Note Regnskab Regnskab
2015 2014
1 Nettoomsaetning 4.265.583 3.932.682
2 Andre driftsindtaegter 4.265.136 4.512.516
3 Vareforbrug 173.682 253.170
4 Andre eksterne omkostninger 5.562.237 5.867.878
Bruttofortjeneste 2.788.800 2.325.150
5 Personaleomkostninger 2.704.302 2.180.916
Af- og nedskrivninger 0 0
Driftsresultat 82.294 144.234
6 Finansielle indtaegter 41.093 60.806
7 Andre finansielle udgifter 34.254 2.942
Arets resultat 91.337 202.098
Fjord&Bælt is a resourceful zoo, their annual revenue in 2015 reduced by 50%
even though they grossed 300.000 DKK more, compared to their previous
year.
15. PAGE 15
REFERENCE LIST
APPENDIX
CONCLUSIONEVOLUTIONEXPERIMENTATIONIDEATIONINTERPRETATIONDISCOVERYANALYSISMETHODSPROBLEM DEFINITIONINTRODUCTIONEXECUTIVE SUMMARY
ANNUAL INCOME. PARTNERS. DESK RESEARCH.
Fjord&Bælt has 28 business partners which all provide them some form of support.
As we want to present an economical solution for Fjord&Bælt, we want to research
about each partner, in order to know if there is any possibility for a renewed partner-
ship, that are beneficial for every participant in the solution. Only the most relevan
partners are listed.
See appendix 1, on page 77
16. PAGE 16
REFERENCE LIST
APPENDIX
CONCLUSIONEVOLUTIONEXPERIMENTATIONIDEATIONINTERPRETATIONDISCOVERYANALYSISMETHODSPROBLEM DEFINITIONINTRODUCTIONEXECUTIVE SUMMARY
WEBSITES & VISUALS. DESK RESEARCH.
In order to create the most desirable website, we scouted competitor’s and
similar business’ websites to see how their websites are structured. We will
take a look at all of their design aspects such as positioning, colours, layout
and so on. We will gain a great overview of how other related businesses
structure and design their websites and therefore we can see what they are
doing well and improve on their mistakes.
National Museum (http://en.natmus.dk/)
Displays sub-museums in a slider form, then some more sub-museums be-
low that. Colour palette is consisting of shades of gray. Pretty bland and un-
appealing.
Blue Planet (https://denblaaplanet.dk/en/)
One of the main competitors of Fjord & Baelt. Some navigation submenus
have too many items and are hard to read through. Hero is showing a story in
a video form as a background. Tickets are available to purchase right away.
Clear CTA button. Hero section is followed by the program for today and di-
rections to the aquarium. Instagram feed below. Has consistent sidebar with
the option to purchase tickets, program for today and directions. Colour pal-
ette is mostly blue and teal.
17. PAGE 17
REFERENCE LIST
APPENDIX
CONCLUSIONEVOLUTIONEXPERIMENTATIONIDEATIONINTERPRETATIONDISCOVERYANALYSISMETHODSPROBLEM DEFINITIONINTRODUCTIONEXECUTIVE SUMMARY
WEBSITES & VISUALS. DESK RESEARCH.
Copenhagen Zoo (http://www.zoo.dk/)
Very clear navigation. Essential information available right away: Opening
hours, activities, the option to purchase tickets. Uses a lot of pictures (mainly
animals) throughout the website. Main colour is green.
Odense Zoo (https://www.odensezoo.dk/)
Hero section is very beautifully done, but CTA button could be more popping.
Clear navigation with a button to purchase tickets right away, then a pro-
gram below the hero section. Colour palette consists of earth colours. Uses a
lot of pictures of animals.
Aalborg Zoo (http://aalborgzoo.dk)
Isn’t available in English, but navigation seems cluttered and has too many
items. Slider with pictures of animals with CTA buttons. Below that essential
information such as purchasing tickets, opening hours and program. Web-
cam of animals + Instagram feed below. Main colour is brown.
18. PAGE 18
REFERENCE LIST
APPENDIX
CONCLUSIONEVOLUTIONEXPERIMENTATIONIDEATIONINTERPRETATIONDISCOVERYANALYSISMETHODSPROBLEM DEFINITIONINTRODUCTIONEXECUTIVE SUMMARY
MARKETING CAMPAIGNS. DESK RESEARCH
To have a strong sense of how to market Fjord & Baelt Research Center, the
group went into the desk research phase, discovering how other Museums,
ZOOs & Research Centers did so in the past, that resulted in a success.
The Smartest, Funniest, Most Informative Museum Ads (https://goo.gl/rekN-
vV) To catch the eye of people outside of the museums, marketers used hu-
mor and witty ideas easily appreciated by mainstream culture.
State Museum of Architecture in Moscow
Encouraging to “Discover a full story”, with an imagery that takes most iconic
pieces of Russian Architecture to a whole new level.
Denver Museum of Nature and Science
Taking a well known iceberg image and transforming it into a written deeper
reasons of why Titanic has sunk.
20. PAGE 20
REFERENCE LIST
APPENDIX
CONCLUSIONEVOLUTIONEXPERIMENTATIONIDEATIONINTERPRETATIONDISCOVERYANALYSISMETHODSPROBLEM DEFINITIONINTRODUCTIONEXECUTIVE SUMMARY
MARKETING CAMPAIGNS. DESK RESEARCH
Ways Zoos & Aquariums are Engaging Audiences
Through Social Technology (https://goo.gl/Dv3zkw)
Since Fjord & Baelt is a research center with a focus on nature and animals,
taking inspiration from how Zoos & Aquariums marketing ideas makes a per-
fect sense.
These are the notes and examples taken :
Most Popular Social Medias used by Zoos & Aquariums
1. Twitter
2. Facebook
3. Flickr
4. YouTube
5. Website
6. Interactive Pages
7. Blogging
8. Mobile Applications
9. Foursquare
10. Virtual Conferences
11. Podcasts
Storytelling
Taking an example from san francisco zoo, storytelling can be an engaging
way of capturing interest of an audience, by showing the story of an animal
in a very close up, personal way.
Example video:
https://www.youtube.com/watch?v=tgW1TnJu_WE
It takes a little gorilla, and shows his day cycle, its habits and personality
traits. It connects the audience with the animal in a way that the customer
will have an increased interest of actually going there and seeing the star of
the video himself.
Streaming
“The Knoxville Zoo creative partnership with the Mozilla Foundation raised
awareness of endangered species through a 24 hour live stream of two red
pandas (firefoxes). Their names, Ember and Spark, were determined by on-
line voters. I cannot lie: sometimes I open this tab on my browser and check-
in throughout the day. It’s that cute. (Please don’t judge…)”
Additional thoughts: Streaming is a popular way of having a 24 hour access
to check up on someone or something you like, and form a way of connec-
tion. Streaming daily lives of animals and allowing everyone to see is a cute
gesture that involves not only the Research Center, but everyone else to care
about the animals within.
QR codes
Leaving scannable QR codes across the Research Center, its installations
and aquariums links users to back to the website, where they would be able
to experience more in-depth descriptions and videos of the animals and oth-
er objects of interest.
21. PAGE 21
REFERENCE LIST
APPENDIX
CONCLUSIONEVOLUTIONEXPERIMENTATIONIDEATIONINTERPRETATIONDISCOVERYANALYSISMETHODSPROBLEM DEFINITIONINTRODUCTIONEXECUTIVE SUMMARY
MARKETING CAMPAIGNS. DESK RESEARCH
Installations for fun photography
People love social media, photos and making sure all of their friends know
they are having fun. Installations tailored towards making it into a great pic-
ture is a great way to get exposed through social media.
Example from British Aquarium:
(https://aquarium.ucsd.edu/)
The New England Aquarium Has Some Great Advertising
(https://goo.gl/6YXeic)
Inspiring aquarium advertising giving sea creatures human-like personality
in a very british humorous way.
See the images on the right.
23. PAGE 23
REFERENCE LIST
APPENDIX
CONCLUSIONEVOLUTIONEXPERIMENTATIONIDEATIONINTERPRETATIONDISCOVERYANALYSISMETHODSPROBLEM DEFINITIONINTRODUCTIONEXECUTIVE SUMMARY
CONCLUSIONS & NOTES ABOUT THE VISIT & CLIENT INTERVIEW.
Visiting Fjord & Baelt has been an exciting experience, but in a different way
that we have expected. Simply comparing it to a zoo or a museum would not
be doing it justice. In our eyes, what makes it special is the the connection
it has between the staff and the animals within the research center. It was
a heartwarming sight and it made us feel connected too. Fjord & Baelt even
had warm blankets provided for us not to get cold to watch a performance.
The connection and closeness is what we have considered to be Fjord & Bae-
lt’s main selling point, therefore, the the way they present themselves should
have more emphasis on that. To improve Fjord & Baelt’s connection with the
user it has to make adjustments in the following areas :
The amount of text used within the website and the Research Center.
During the client interview, explained in the discovery(see page 10, paragraph
5) phase, it had been made clear that the usage of text within the research
center should be reduced. It does not work.
Fjord & Baelt’s educational purpose puts emphasis on younger target au-
dience.
One of the main points made during the client interview is that Fjord & Baelt
wants to teach the world about the importance of animals and nature, to be
more aware and protective about it. They would love to share this knowledge
with the youngest generations. From this we draw a conclusion that most of
what we have to do must be pleasing to the younger audience.
The quote from the Q&A with Fjord & Baelt sums this up perfectly: “What you
know, you are more willing to protect.”
The budget is limited.
“Media Campaign budget reaches up to 400 000dkk, and for anything else, the
money has to be raised.” - (See appendix 7, page 84).
We are working on a very limited budget. 400 000 dkk marketing budget
means we have to be smart about it and use the cheapest media channels in
a most effective way.
Non-existent budget for installations and additional equipment states that we
have to create our solution working with what the research center has already.
We focus on improving the user experience within the research center by im-
proving the functionality of the equipment that is already within the facility.
24. PAGE 24
REFERENCE LIST
APPENDIX
CONCLUSIONEVOLUTIONEXPERIMENTATIONIDEATIONINTERPRETATIONDISCOVERYANALYSISMETHODSPROBLEM DEFINITIONINTRODUCTIONEXECUTIVE SUMMARY
TARGET GROUP QUESTIONNAIRE REMARKS, CONCLUSIONS AND INFO GRAPH.
In the Discovery phase, we have shown the results of the field research at
Fjord & Baelt. Collecting and analyzing the data made us conclude on these
notes :
Most frequent visitor age groups we have encountered during our visit.
(See picture on page 11)
- 19 - 26 (42,1%)
- 60+ (26,3%)
- 0 - 12 (21,1%)
Analysis shows that school and college aged people are the majority of mu-
seums visitors. This makes sense due to Fjord & Baelt’s educational purpose.
The youngest of visitors only take around one quarter of the visitors within
that day. This slightly suggests that the Research Center might not be widely
considered an as place to take your kids / grandkids.
Most used medias.
Based on this survey we have concluded that the most popular devices are
Mobile and Ipad(See picture on page 12), therefore any kind of multimedia
solution we are going to make has to be responsive to be easily accessible
and operated from any viewport.
When we have looked into the individual responses we have found out that
the people whom are using newspapers are mainly in our elder target group
age, and they are also most likely using TV and Radio than our other target
group ages. (see page 12, paragraph 1)
Most used Social Medias.
Not surprisingly, Facebook remains the most used social media. This also
shows in our questionnaire results from the Discovery phase. (See page 12, par-
agraph 5)
- Facebook (89,5%)
- Instagram (57,9%)
- Snapchat (52,6%)
Instagram taking a second place, seems like an appealing option of market-
ing, as it mainly visual social media and is able to show our our product in
the way that we would want it to be presented. It is also mainly used by the
youngest target audiences.
Snapchat is very close to Instagram in terms of popularity within the visitors
of Research Center. At this point we are unsure if this social media platform is
suitable to our needs.
Where do visitors come from?
People coming from Fyn are the majority of Fjord & Baelt’s visitors (84,2%)(see
page 12, paragraph 3), which makes sense as the location is very attractive for
people around and within Fyn. Based on this research we have decided to fo-
cus on mainly the Funen area of Denmark in our advertising to reach as many
people as possible.
25. PAGE 25
REFERENCE LIST
APPENDIX
CONCLUSIONEVOLUTIONEXPERIMENTATIONIDEATIONINTERPRETATIONDISCOVERYANALYSISMETHODSPROBLEM DEFINITIONINTRODUCTIONEXECUTIVE SUMMARY
TARGET GROUP QUESTIONNAIRE REMARKS, CONCLUSIONS AND INFO GRAPH.
How did the visitors hear about Fjord & Baelt? (see page 13, picture 3)
- Friends / Family (73,7%)
- Online Media (15,8%)
- Posters / Flyers(10,5%)
We came to the conclusion that however almost 90% of our target group uses
Facebook, we have reached only 15% of them through this medial channel.
73.7 % of our respondents have been reached through their friends and/or
family, which means that our business is spreading by people whom already
visited the center and shere their experience. Therefore it is important for
Fjord & Baelt to give the best possible experience to their visitors because this
is their main selling point in attracting more people.
Online Medias scoring low also states that the current online marketing for
Fjord & Baelt is ineffective.
What do the visitors find the most attractive at Fjord & Baelt? (see page 13,
picture 2)
- Feeding of the animals (52,6%)
- Seals (47,4%)
With this question we were looking for the main selling point of the center
which is clearly the feeding show that takes place every day at the same time.
We have also found out that people are more interested in seals rather than
the whales that are also the part of the show.
How did the visitors rate the experience at the Research Center? (see page
13, picture 1)
- 7-9 (52,6%)
- 4-6 (36,8%)
This question focuses on the current stomer satisfaction. More than 50 % of
our respondents have answered 7-9 which is a strong satisfaction level, how-
ever the second most reply was 4-6 what is average. Out of 19 respondents
only one found that the center fulfills all their expectations.
Observing these numbers we can clearly see that there is room for improve-
ments in the satisfaction levels of our customers, and our design solution is
going to focus on this.
26. PAGE 26
REFERENCE LIST
APPENDIX
CONCLUSIONEVOLUTIONEXPERIMENTATIONIDEATIONINTERPRETATIONDISCOVERYANALYSISMETHODSPROBLEM DEFINITIONINTRODUCTIONEXECUTIVE SUMMARY
INCOME AND BUDGET ANALYSIS & CONCLUSIONS.
Looking at their partner Naturama, gives a clear view of a big decline in prof-
its as well. From 2015 to 2016, they went from around 150.000kr to 7.000kr in
profits(Anon, 2017).
This information is a decisive factor when presenting Fjord & Bælt with a low
budget solution.
From their Årsberetning(Anon, 2017) the team gathered that Fjord & Bælt is
also one of the only 5 places in the entire world, that houses porpoise whales,
as well as being the only place in Denmark where you have the opportunity
to experience whales. This should play a bigger factor when marketing their
attraction. Additionally, they house around 60 other species at their facility
from starfishes and crabs, to sharks, rays and harbor seals.
This concludes that Fjord&Bælt has a lot of material that can be used for a
good campaign strategy.
S.W.O.T. Analysis
Strengths / Weaknesses / Opportunities / Threats
S.W.O.T. Analysis has been performed to strengthen our understanding about
Fjord & Baelt’s main strengths, weaknesses, opportunities and threats. Fol-
lowing this method made us look into Fjord & Baelt from another perspective
and notice a few things that we would have otherwise not.
Strengths: Fjord & Bælt has great value in their porpoise whales and seals at
their facility. They are the only place in Denmark that showcases whales, and
are one of the only 5 zoo’s in the world that have the ability to show their vis-
itors the porpoise whale up close. These values can and should be used for
further marketing of the zoo. They are a great tool for educational purposes,
as well as a good experience for the visitor.
As a substantial amount of their audience include a younger generation, their
attraction where you can touch and see crabs and fishes, is a great value of
theirs. In our questionnaire we went around Fjord&Bælt and asked people of
their opinion of the place, and even though we did not get it documented, a lot
of the visitors told us, that their kids absolutely loved having the opportunity to
touch the different species in the water.
Weaknesses: Fjord & Bælt has a problem of conveying the knowledge they
obtain for their research, to their audience. As of now, they have a lot of text
placed on their walls. It is not engaging, and going through the place, it did
not seem like people stopped to read it, which brings us to the next problem,
the interaction is little to non existing as their touch screens usually just leads
the visitor to even more text.
Their tunnel seems really empty, and could use some form support, that could
bring it up to par.
Opportunity: The tunnel lacks interaction and is really empty. This can be
seen as an opportunity for Fjord & Bælt, and could be used for an interaction
installation.
27. PAGE 27
REFERENCE LIST
APPENDIX
CONCLUSIONEVOLUTIONEXPERIMENTATIONIDEATIONINTERPRETATIONDISCOVERYANALYSISMETHODSPROBLEM DEFINITIONINTRODUCTIONEXECUTIVE SUMMARY
INCOME AND BUDGET ANALYSIS & CONCLUSIONS.
At this moment, Fjord&Bælt’s touch screens lacks interaction, when you
click on them, you either get a silenced video, or a wall of text, both of
these does not drag the audience in. These touch screens could be used
for better purposes at the facility, and as they already have them, it does
not cost them any money.
Threats: As of the external threats aspect, we have found that Fjord &
Baelt is unique in their position, because of the display of their display
of porpoise whales, seals and location. As mentioned already, they are
amongst 5 places in the world to have porpoise whales. While they are
not only a museum, but a research center this places them even more on
a separately segmented market.
Therefore our group believes that the threat of a new entry to this market
is really low, because of the segmentation.
While we believe that an opening of a scientific research center and mu-
seum with porpoise whales has a small chance, but there is still a possi-
bility for zoos around Denmark to acquire these animals and dive away
our target audience.
Strenghts
• Unique cultural
attraction
• Fun and educational
• Able to touch fish/
catch crabs
• Training of seals and
whales
Opportunities
• A lot of space in tunnel
• Touch screens can be
modified
• Text made intovideos
Threats
• Competitorswith better
technology
• Getting outdated
• No marketing/not getting
noticed
Internal
External
Weaknesses
• Too much text onwalls
• Empty tunnel
• Little to no interaction
• Touch screens is only text
SWOT
28. PAGE 28
REFERENCE LIST
APPENDIX
CONCLUSIONEVOLUTIONEXPERIMENTATIONIDEATIONINTERPRETATIONDISCOVERYANALYSISMETHODSPROBLEM DEFINITIONINTRODUCTIONEXECUTIVE SUMMARY
WEBSITE & VISUAL RESEARCH CONCLUSIONS & MOODBOARD.
Comparing and analysing just a few competitor’s similar business’ websites,
we can come to a certain closure:
Most of them use earth tone colours e.g. brown, green. Earth tone makes a
good choice for a website related to nature and animals. Websites related to
sea nature, such as Blue Planet (https://denblaaplanet.dk/en/), use blue to
represent the color of the sea. Fjord & Baelt (http://www.fjordbaelt.dk/) uses
#0079b9 Blue as a base color of their website. Taking all the above in consid-
eration, blue color still remains the basis of future design to be created for
Fjord & Baelt.
Visual Research made us create a moodboard. Moodboard helped us to con-
clude on a selection of colors we decided to experiment with. It also gives the
rough idea of a visual identity we want to achieve, making all group mem-
bers be on the same page when it comes to future designs for Fjord & Baelt.
Talking about the structure of websites, landing page has usually the same
structure and contains the most essential information.
29. PAGE 29
REFERENCE LIST
APPENDIX
CONCLUSIONEVOLUTIONEXPERIMENTATIONIDEATIONINTERPRETATIONDISCOVERYANALYSISMETHODSPROBLEM DEFINITIONINTRODUCTIONEXECUTIVE SUMMARY
MARKETING CAMPAIGN. CONCLUSION AND DIRECTION
Based on the marketing campaign research in the Discovery Phase(see page
16-19), being creative goes a long way when it comes to advertising a Zoo or
an Aquarium. Advertisements usually aim to reach a user with humorous and
light hearted content. Putting a smile on a person, before he even sees the
actual facility, will make him more interested to see more.
Embracing personalities of animals or giving them human-like characteris-
tics is a popular way in aquarium and zoo marketing. One popular way of
gaining an audience is to make an emotional connection with the animals
within. Even from long distance.
When it comes to experience inside or outside of the zoo / aquarium, it must
be designed with animals in mind. They are the main attraction and de-
sign decisions should strictly be based on not taking the way the attention
to them.
31. PAGE 31
REFERENCE LIST
APPENDIX
CONCLUSIONEVOLUTIONEXPERIMENTATIONIDEATIONINTERPRETATIONDISCOVERYANALYSISMETHODSPROBLEM DEFINITIONINTRODUCTIONEXECUTIVE SUMMARY
DIRECTION, WEBSITE & INSTALLATION CONCEPT
Direction
Based on the research conducted above in the Discovery and the conclu-
sions in the Interpretation section, our group has decided to to focus on Fjord
& Baelt’s two main problems, which is their outdated website and a lack of
consistent brand identity.
As earlier stated, Fjord&Bælt lacks structure and consistency and it shines
through when they are trying to convey their gathered knowledge from their
own research. We want to use their already installed tablets thus saving them
money, and use them for a better interaction between visitor and Fjord&Bælt.
Website Concept
In order to identify the main problems with Fjord & Baelts current website, our
group analysed their content, navigation and general usage of the website.
Based on this we were able to organize the new website with an easier navi-
gation system that allows for a more seamless user interface and interaction
flow.
Following this, with the help of the TEA(Elis, 2017) and CRAP(Landa, 2013)
analysis we were able to come up with a structure of a landing page that
focuses more on the needs of their visitors and their selling points.
Unlike their current website, our group wanted to take advantage of the neg-
ative space on the website, as well as the utilization of the whites and blacks
to create contrast.
When looking at the current Fjord&Bælt website, we concluded that they
needed a new and modernized look, as of now the website is unappeal-
ing and it lacks structure.
The combination of light green and blue creates too much contrast, and
is used inconsistently throughout their webpage. When going through
booking, you are able to book on multiple subpages, which should not
be the case, it creates confusion for the visitor.
Fjord&Bælt has a lot of information they want to deliver to their audience,
but the way it is structured leaves the visitor with a lot of subpages, which
a minimum amount of people will go through, and it is unnecessary, and
does not follow modern design.
These factors, being unappealing and lack of structure, were the main
factors we wanted to focus on when going into the ideation phase.
We have made a new colour palette we want Fjord&Bælt to use, com-
bined with a redefined website that follows a more modernized look, and
is more approachable as it is easy on the eye. The structure is simplified,
with the vision of still having the same information available for the vis-
itor.
32. PAGE 32
REFERENCE LIST
APPENDIX
CONCLUSIONEVOLUTIONEXPERIMENTATIONIDEATIONINTERPRETATIONDISCOVERYANALYSISMETHODSPROBLEM DEFINITIONINTRODUCTIONEXECUTIVE SUMMARY
DIRECTION, WEBSITE & INSTALLATION CONCEPT
Installation Concept
Our groups field research also revealed what we believe Fjord & Baelts sec-
ond biggest problem is the display of text through their exhibition.
In order to improve this we decided to take advantage of their already exist-
ing technology inside the center.
The concept is to replace the old touch screen with interactive videos. This
way the visitors are more engaged in the experience and learn more about
the center.
Visualising information is also a way of attracting a younger audience group,
as kids and school classes tend to skip a lot of reading due to getting bored.
Our goal is to have an engaging user interface when it comes to informative
touchscreens, so that it is enjoyable even for someone who is not willing to
read through all of the text, or to make a visitor interested in reading more.
Advertising campaign
research, page 20
33. PAGE 33
REFERENCE LIST
APPENDIX
CONCLUSIONEVOLUTIONEXPERIMENTATIONIDEATIONINTERPRETATIONDISCOVERYANALYSISMETHODSPROBLEM DEFINITIONINTRODUCTIONEXECUTIVE SUMMARY
COMMUNICATION PLAN
Executive Summary
The communication plan gives us a good foundation to further develop their
visual identity as its current state in Fjord&Bælt is not consistent. It provides us
a greater view of how to reach out to our target group with our message.
By using methods such as AIDA, STP, SMART goals and Field Research, we have
created a communication plan to define a precise target group as well as the
channels we are going to use to communicate to said group.
Introduction
Fjord&Bælt has a problem in conveying their knowledge to a younger audi-
ence, as well as keeping their visitors interested before, during and after their
visit. By working together with Fjord&Bælt, we will develop a clear message and
an improved communication, that supports the key visions they have.
We are creating a campaign for Fjord&Bælt in order to get them back on the
map, which will result in more visitors, better experiences before and after the
visit, and overall a happier customer.
The communication plan will help us define the message and the medias, that
will be used to build a clear and concise goal and thereby increase our chances
of more visitors.
Problem definition
How might Fjord & Baelt reach their target group more efficiently?
How might we make the center more appealing to our future visitors?
Table of content
STP 1.0
Personas 1.1
Determining the communication objectives 2.0
Purpose 2.1
Smart Goals 2.2
Message Design 3.0
The Customer Angle 3.1
The Internal Angle 3.2
The Competitive Angle 3.3
Synopsis 3.4
Designing the Message 3.5
Emotional Selling Point 3.6
Value Proposition 3.7
SEO Keywords 3.8
Media Channels 4.0
Media Budget 5.0
Budget of Promotion Mix 5.1
Selection of Promotion Mix 5.2
Media Mix 6.0
Media Mix Budget 6.1
Push/Pull 7.0
Measurement of Communication Effect 8.0
Customer Journey Map 9.0
Conclusion 10.0
34. PAGE 34
REFERENCE LIST
APPENDIX
CONCLUSIONEVOLUTIONEXPERIMENTATIONIDEATIONINTERPRETATIONDISCOVERYANALYSISMETHODSPROBLEM DEFINITIONINTRODUCTIONEXECUTIVE SUMMARY
COMMUNICATION PLAN STP 1.0
Making an STP(Customer driven marketing, 2013) is an important step for the
company to identify the audience you want to target, furthermore it is a tool
used for knowing the positioning of the product and the company on the mar-
ket. STP stands for segment, target group and positioning. Fjord&Bælt has a
unique and strong position on the market, they are one of the only five places
in the world where you can visit porpoise whales(Anon. 2017) we believe this is
a strong selling point, and because of that, we decided not to utilize the Posi-
tioning in the STP.
To segment the market, we will go through the 5 major segmentation variables
in the consumer market each called:
Geographic Variables
Demographic Variables
Psychographic Variables
Behavioral Variables
Technographical Variables
Geographic variables:
Based on the field research questionnaire (see page 11-13) majority of the visi-
tors come from around Fyn.
Denmark. Fyn.
Both countryside and city is important.
Demographic variables:
Fjord & Baelt educational purpose(see page 4) makes us primarily target stu-
dents and children with their families. Income and gender we find irrelevant.
Students, school classes.
Grandkids with their grandparents, 5-13 years old / 60-75 years old.
Low to high income.
Female and male.
Psychographic variables:
Target audience can only be attracted by our product if they:
Like experiences.
Are interested in the animals.
Value educational attractions.
Technographical variable:
Based on the field research questionnaire(see page 11-13), majority of
young(0-26) visitors share these characteristics:
The knowledge from our younger audience regarding technology, is consid-
ered well known.
They use Instagram and Facebook.
Uses the internet a lot on iPads/Phone, and PC’s
35. PAGE 35
REFERENCE LIST
APPENDIX
CONCLUSIONEVOLUTIONEXPERIMENTATIONIDEATIONINTERPRETATIONDISCOVERYANALYSISMETHODSPROBLEM DEFINITIONINTRODUCTIONEXECUTIVE SUMMARY
COMMUNICATION PLAN STP 1.0
As for older audience (40+):
They use YouTube and Facebook.
Low to medium technological knowledge.
Medium use of internet using iPads and phones.
Going through the most important variables to find the appropriate target
group, we are using Gallup Compass(www2.tns-gallup.dk, 2017), to find our ex-
act segments we want to target.
Variables such as psychographic and technographic were the most important
for our idea, as we want the target group to both be good with technology, and
wanting an experience.
According to the Gallup Compass segment descriptions, our target group can
be placed in both “The Modern Individuals” and “The Modern Socially Orient-
ed” segments(see appendix 8, page 85)(Det Moderne-individorienteret segment,
2017).
The modern individuals are characterized by the following: young, upbeat, and
knows new technology, which fits our variables perfectly. The age described in
this segment does not fit our young audience, we still find it the most fit for our
choice.
The modern socially oriented segment, is described as a segment who likes the
cultural aspects of life, they like going out and visiting museums, going to zoo
and such.
36. PAGE 36
REFERENCE LIST
APPENDIX
CONCLUSIONEVOLUTIONEXPERIMENTATIONIDEATIONINTERPRETATIONDISCOVERYANALYSISMETHODSPROBLEM DEFINITIONINTRODUCTIONEXECUTIVE SUMMARY
STP PERSONAS 1.1
We have created personas(Andersen et al., 2011) to rep-
resent types of users within our general target audience,
Having multiple personas will increase the accuracy of
our Customer Journey Map which can be found under-
neath our visuals of personas. The personas was based
on the research from the segmentation and target group
section in the STP(see page 34-37) as well as the qualita-
tive interview from our primary research(see page 11-13).
38. PAGE 38
REFERENCE LIST
APPENDIX
CONCLUSIONEVOLUTIONEXPERIMENTATIONIDEATIONINTERPRETATIONDISCOVERYANALYSISMETHODSPROBLEM DEFINITIONINTRODUCTIONEXECUTIVE SUMMARY
DETERMINING THE COMMUNICATION OBJECTIVES 2.0
In this section we will go through the purpose as well as the smart goals, which
consists of specification, explaining what we plan on improving, the measur-
able part of our idea, the achievable aspect of the project, in this case ticket
sales, the relevant aspect, and lastly Time Bound, when we want to achieve
this. The section was based on our desk research(see page 11-17). The reason
we want to determine our communication objectives, is to have a clear goal to
what we want to achieve with this project, as it keeps everyone in the group on
the same track.
Purpose. 2.1
To enhance the visitor’s experience before, during and after their visit at Fjord &
Baelt.
Smart Goals 2.2(Mindtools.com, 2017)
Specific: Re design and improve Fjord & Baelt website to meet the current web
standards. Transform the way they communicate their message into a more
simpler way to be easily understandable.
Measurable: Double the traffic on Fjord & Baelt website after the re design.
Achievable: based on their ticket sales from 2014-2015, Fjord&Bælt had an in-
crease of 15,69% in sales.(Årsregnskab 2015, 2015) We would like to continue
this trend, and made our achievable goal to 20% more tickets than 2015 in the
year 2017.
Relevant: Increased engagement between the visitors and the exhibition in
the center.
Time Bound: Have a re defined website up and running by the end of May
2017. Implement the storytelling videos and sound around the exhibition by
the middle of June. Release the promotional campaign in the end of June.
39. PAGE 39
REFERENCE LIST
APPENDIX
CONCLUSIONEVOLUTIONEXPERIMENTATIONIDEATIONINTERPRETATIONDISCOVERYANALYSISMETHODSPROBLEM DEFINITIONINTRODUCTIONEXECUTIVE SUMMARY
MESSAGE DESIGN 3.0
As the team now have the knowledge of both the target group and the objec-
tives for the communication, the message design can be developed. This step is
an important key, as it will have a large impact on whether your communication
will sell or not. The message design used the guidelines from pardot(Salesforce
Pardot, 2017) where we approached the issue from three different angles, the
Customer Angle, in this angle we take a closer look at what the customer wants.
The Internal Angle, looking at the brand from within, the vision of the brand.
The Competitive Angle, keeping our marketplace on our minds. Based on this
analysis, the message was developed through a brainstorm(Pardot. 2017)and
later determined through qualitative interviews(see page 11-13).
The Customer Angle 3.1
The visitors of Fjord & Baelt are looking for an exciting and fun experience to
spend their day with learning about the sea life in Odense. Whether they are
families, schools or elderly people, the most common thing about all of them
that they are searching for a relaxed and fun experience by the sea. Their need
is to gather information about the sea life in Denmark, and their strong desire is
to get in close touch with them.
The Internal Angle 3.2
The staff inside Fjord & Baelt research center strives to show off their research
findings in the most informative way. Instead of guiding through the exhibition,
they let their information speak for itself and encourage customers to explore
the center on their own. Every day at the same time they hold an event where
theirmostskilledemployeestrainandfeedtheiranimalsatthepoolarea,which
is their main selling point because here they share their story with the visitors.
The Competitive Angle 3.3
In its existence Fjord & Baelt is unique in Fyn, and rare in Denmark. They
are a really specified research center concentrating on the wild life of the
Danish sea, trying to share their research findings to educate people. They
do have similar competitors on the market but nowhere near the center. The
chance for a new entrance on the market is small therefore their position is
in a good standing.
Synopsis 3.4
When observing Fjord & Baelt’s message, tone of voice and communication
as it is right now, one can come to the following conclusions:
Their choice of promotional channels are good, but they do not utilize it well
enough to generate traffic.
Their website is informative, but visually not appealing to their target group.
It uses old web design principles.
Their visual appearance is halfway completed. They have a well designed
logo but they don’t seem to utilize the strength of font and color design.
They display their information in mainly Danish, but also very consistently
using English and some places also have German language.
They would like to display the information inside the center in a better way
to communicate with their younger target group as well as elderly.
Based on the above mentioned points, if the center shifts their way of dis-
playing information with taking into consideration the currently available
multimedia solutions (ie.: Projector, Sound and Video, Touchscreen Games)
they can achieve much wider customer engagement.
40. PAGE 40
REFERENCE LIST
APPENDIX
CONCLUSIONEVOLUTIONEXPERIMENTATIONIDEATIONINTERPRETATIONDISCOVERYANALYSISMETHODSPROBLEM DEFINITIONINTRODUCTIONEXECUTIVE SUMMARY
MESSAGE DESIGN 3.0
Designing the message 3.5
With all the above in mind, our group have came up with different messages
Fjord & Baelt could stand for. Their message is education combined with fun
experience from young to old.
Keywords provided by Fjord & Baelt(see appendix 6 on page 83):
Experience
Fascination
Understanding
Additional Keywords based on Message Design:
Learn
Educate
Fun
Explore
Sea
Marine
Wild life
Family
Protect
Preserve
Ideas:
Fjord & Baelt, a fun experience for the whole family.
Fjord & Baelt. Research made fun.
Fjord & Baelt. Explore the sea, preserve the wildlife.
Fjord & Baelt, Dive in and explore.
Fjord & Baelt, The magic of the sea.
With these ideas kept in mind we have decided to run a survey as a part of
our field research to gain more insight about our target audience preferenc-
es. When our team summarized the results we have concluded that more
than 50% of the people who have filled out our survey thinks that Research
made fun is our most catching tagline for the message we are trying to con-
vey.
Final Message: Fjord & Baelt. Research Made Fun.
41. PAGE 41
REFERENCE LIST
APPENDIX
CONCLUSIONEVOLUTIONEXPERIMENTATIONIDEATIONINTERPRETATIONDISCOVERYANALYSISMETHODSPROBLEM DEFINITIONINTRODUCTIONEXECUTIVE SUMMARY
MESSAGE DESIGN 3.0
Emotional Selling Point 3.6
The team can both go for USP or ESP, we decided to go for ESP(EasyStudy,
2017). This was based on the facts that kids will more than likely show their
interest through emotions, rather than logic, as unique selling points are devel-
oped through reasoning and logic. Thinking about our emotional selling point
also made a strong case when brainstorming various ideas to what could be-
come our final message.
Value Propositions 3.7
Value Proposition(Laja, 2017) is our number 1 value and the reason for the cli-
ent to bother coming to a Fjord & Baelt.
Closeness to the wildlife.
A loved feature for Fjord & Baelt is the when the seals are at precense(see page
13 picture 1). The feeling of research center is different from what it is in a typical
ZOO. The animals and their daily interaction with the staff is a cozy, heartwarm-
ing experience, which will make you want to visit again.
SEO Keywords 3.9
SEO(Search Engine Optimization Starter Guide, 2010) is a very important
tool for our project, as our main idea will be a campaign involving more traf-
fic on Fjord&Bælts website. SEO provides guidelines for us to make sure, our
website is both easy to use, but also easier for search engine to understand
and find.
Search optimisation keywords to increase traffic to the website:
Sea, nature, research, center, Denmark, museum, seal, dolphin, water, fish,
wildlife, animals, nature, FJORD, BÆLT.
42. PAGE 42
REFERENCE LIST
APPENDIX
CONCLUSIONEVOLUTIONEXPERIMENTATIONIDEATIONINTERPRETATIONDISCOVERYANALYSISMETHODSPROBLEM DEFINITIONINTRODUCTIONEXECUTIVE SUMMARY
MEDIA CHANNELS 4.0
MEDIA BUDGET5.0
Media channels 4.0
Nowadays it’s very important to choose the correct medias to convey your mes-
sage as it can have a very strong impact. This impact can push the business
into the right direction or might ruin it.
As the message is now developed, we can take a closer look towards which me-
dia channels we want to utilize, in order for us to reach our desired target group.
Website(Owned Media): The old website will be redesigned as it doesn’t follow
the current web standards and is not appealing for the user. We will improve the
user experience as well as the pleasingness of the website in order to engage
more users. Essential content such as videos and general showcase of the ex-
hibitions will be brought to the spotlight to attract the customer. The website is
one of the most important media channels as it is the main source of bringing
new clientele.
Facebook(Owned/Paid): As of this moment of writing the Fjord&Bælt Facebook
page has around 2600 likes and quite active engagement and posting with
around 3 posts per week. Our concept looks to improve this to gain more trac-
tion and interaction with people and therefore more exposure which will secure
more visitors in the future.
Instagram(Owned/Paid): Fjord&Bælt is a place that attracts people primarily
through visual content such as pictures and videos. Ergo Instagram is the per-
fect place to be. Currently Fjord&Bælt has 303 followers with around 1 post per
week. We look to greatly improve this in our concept to help interest more peo-
ple.
Media Budget 5.0
Knowing which medias we want to utilize, the group took a closer look at
Fjord&Bælts media budget, this information was gathered in the Q&A Sec-
tion(see page 10) with the clients. The information provided will help us build
a more precise media mix, which we will go through in section 6.0 of the
communication plan.
Budget of Promotion Mix 5.1
During the Q&A with our client(see page 10) FJORD&BÆLT, we have gathered
that the budget for marketing purposes is reaching 400 000 DKK.
Our plan is to use the given budget to create a multimedia campaign, that
would bring back attention to FJORD&BÆLT official website, to re-capture
interest in the research center through new visual ideas implemented.
Selection of Promotion Mix 5.2
To select the appropriate media channels(The Balance, 2017) we have to
consider our target audience, of which the majority is school classes and
kids around the area of Funen and Denmark in general this, this is based on
our Field Research regarding visitors(see page 11-13).
To capture the attention of the younger target audience we choose visual
advertisements in medias of choice :
Online:
Facebook
Instagram
Promotional websites (ex. Visit Fyn)
Trip Advisor
Offline:
Posters
Flyers
Brochures
Bus Stop Advertising
43. PAGE 43
REFERENCE LIST
APPENDIX
CONCLUSIONEVOLUTIONEXPERIMENTATIONIDEATIONINTERPRETATIONDISCOVERYANALYSISMETHODSPROBLEM DEFINITIONINTRODUCTIONEXECUTIVE SUMMARY
MEDIA MIX 6.0 & 6.1
As the message, media budget and channels have been determined and de-
veloped, the media mix(Smallbusiness.chron.com, 2017) can now be finalized
and argued for, this media mix is carefully chosen, as we want to reach our tar-
get group the most efficient way possible, these channels were chosen based
on our segments of our target groups(see page 11), our personas(see page 36-
37) and our qualititative interviews(see page 11-13), as they give a great view of
their needs in the technographical aspect.
Facebook & Instagram: Based on our qualitative interviews(see page 11-13),
these are the most commonly used medias within our target audience. This
leads us to choose these online medias to be our main focus to build our cam-
paign around. Intagram being a perfect tool to capture animal lives as if
Promotional Websites: To widen our target audience we are partnering up
with promotional websites to boost our business for people who are not in the
demographic area of Funen.
Trip Advisor: We have chosen this media because it is the biggest collection of
reviews on the internet up to date. The website earned its reputation as a trust-
worthy place to give feedback about businesses.
Posters / Flyers / Brochures: These offline medias are mainly supporting our
online advertising. Based on our research, offline media is not the the main me-
dia we will use, however we will still utilize it, as it plays a supportive role in our
campaign.
Bus Stop Advertisements: This media will be used around the demograph-
ic area of Funen to further widen our target audience reach.
Media Mix Budget 6.1
Facebook & Instagram budget: 200 DKK / day(Facebook Business, 2017)
(Instagram for Business, 2017)
We are working with facebook’s Page Manager application to boost our
posts and page. Our daily budget for these are 200 DKK and we are running
our advertisements locally in funen to target mainly our older and elder tar-
get group.
Promotional Websites budget: up to 400 DKK / collab
These websites are mainly free but our budget goes up until 400 DKK per
partnership.
Trip Advisor budget: up to 3000 DKK / month(Tripadvisor.com, 2017)
Posters / Flyers & Brochures budget:
500 Flyers: 550 DKK
100 A2 Posters: 2200 DKKr
44. PAGE 44
REFERENCE LIST
APPENDIX
CONCLUSIONEVOLUTIONEXPERIMENTATIONIDEATIONINTERPRETATIONDISCOVERYANALYSISMETHODSPROBLEM DEFINITIONINTRODUCTIONEXECUTIVE SUMMARY
MEDIA MIX 6.1 & 6.2
Bus Stop Advertisements:
Bus Stop advertisements are way out of our budget considering the Media
GuideofAFAJCDecaux.ThepricesofbushshelteradvertisementswithinOdense
would drain our entire media budget in a few weeks. Based on that we decided
that it is not a suitable marketing media for this project.(Ipaper.ipapercms.dk,
2017)
Media Exposure Plan 6.2
In order for us to get a clear and concise visual of how long we are going to
throw a campaign, a media exposure plan(Software, 2017) was developed. It
shows what actions are made in which weeks, for however long our campaign
is going to last.
45. PAGE 45
REFERENCE LIST
APPENDIX
CONCLUSIONEVOLUTIONEXPERIMENTATIONIDEATIONINTERPRETATIONDISCOVERYANALYSISMETHODSPROBLEM DEFINITIONINTRODUCTIONEXECUTIVE SUMMARY
PUSH-PULL 7.0
MEASUREMENT OF COMMUNICATION EFFECT8.0
Push/pull 7.0
To be specific, and for the group to know exactly which strategy we will be using
when marketing our project, we are clarifying whether it is a pull or push strat-
egy.
For our brand, we are going with the pull strategy(Andersen et al., 2011), the
reason behind this is because we are trying to get the customer to us, hence the
term pull. The marketer, in this case us or Fjord & Bælt, would attempt to pull
the customers in.
The common tactics for the pull strategy, is usually media promotions, in per-
son, or advertised sales promotions.
This way of marketing, we are going for a more experience focused approach,
as we want to intrigue the audience through our campaign, showing re-defined
installations and the refined website.
The opposite would be the push marketing, where it is more about short-term
sales.
Measurement Of Communication Effect 8.0
The main purpose is to attract new customers. This can be easily tracked by
looking through the system that Fjord&Bælt is using. This way we can see
whether our concept strategy is working accordingly.
The ROI(Staff, 2017) can be measured by comparing the number of custom-
ers before and after the campaign. This applies not only to number of cus-
tomers but also social media postings (Facebook, Instagram).
The website’s main goal will be to attract as many new customers as possi-
ble. There is no clear conversion action such as buying or signing up, there-
fore conversion action can not really be measured. What we will measure
through Google Analytics is the leaving rate, most visited subpages and so
on.
46. PAGE 46
REFERENCE LIST
APPENDIX
CONCLUSIONEVOLUTIONEXPERIMENTATIONIDEATIONINTERPRETATIONDISCOVERYANALYSISMETHODSPROBLEM DEFINITIONINTRODUCTIONEXECUTIVE SUMMARY
CUSTOMER JOURNEY MAP 9.0
A customer journey map was developed in order for the group as well as the
client to get an empathetic view, of how a journey might be for their target au-
dience. This CJM was build around our personas(see page 36-37) as they are 3
different age groups, it provides us with the overall story from the individual’s
perspective.
47. PAGE 47
REFERENCE LIST
APPENDIX
CONCLUSIONEVOLUTIONEXPERIMENTATIONIDEATIONINTERPRETATIONDISCOVERYANALYSISMETHODSPROBLEM DEFINITIONINTRODUCTIONEXECUTIVE SUMMARY
CONCLUSION 10.0
The communication plan is an important tool when making a campaign. Going through all the individual steps, backed up by a strong research, we were able
to make a communication plan.
The target group was defined as the communication was adjusted to make a greater impact in their audience.
Making a creative brief based on the communication plan is a great tool when trying to communicate the ideas, and overall have a good overview, as to under-
standing, and also to avoid misunderstandings.
Fjord&Bælts new message “Research made Fun” is shaped based on all our research and thoroughly hand picked using the guidelines of the communication plan,
with this message, and the channels we will use, and how they are going to be utilized, we will be able to not only hit the target audience more efficiently, bot also
make Fjord&Bælt more appealing for future visitors.
48. PAGE 48
REFERENCE LIST
APPENDIX
CONCLUSIONEVOLUTIONEXPERIMENTATIONIDEATIONINTERPRETATIONDISCOVERYANALYSISMETHODSPROBLEM DEFINITIONINTRODUCTIONEXECUTIVE SUMMARY
ADVERTISING CAMPAIGN
Goal and purpose of the campaign : To increase awareness and gain attention
to Fjord & Baelt.
Message of the campaign : Research made fun
Medias of choice :
Online:
Facebook
Instagram
Promotional websites (ex. Visit Fyn)
Trip Advisor
Offline:
Posters
Flyers
Brochures
Bus Stop Advertising
Media Exposure Plan(See page 43)
Media Mix Arguments
Facebook & Instagram: Based on our research (see page 12) and statistics (see
appendix 4-5 on page 81-82) we have chosen these online medias to be our main
focus to build our campaign around.
Promotional Websites: To widen our target audience we are partnering up with
promotional websites to boost our business for people who are not in the de-
mographic area of Funen.
Trip Advisor: We have chosen this media because it is the biggest collection of
reviews on the internet up to date. The website earned its reputation as a
trustworthy place to give feedback about businesses.
Posters / Flyers / Brochures: These offline medias are mainly supporting
our online advertising. Based on our research, we came to the conclusion
around 10%(see page 13) of our visitors are reached by this type of media,
therefore it plays a supportive role in our campaign.
Bus Stop Advertisements: We have considered this media advertisements
but based on our research it costs 230 000 DKK(Prisliste, 2017) to advertise in
the whole country. Because of the low engagement rate, we decided not to
use this option.
Media Mix Budget
Facebook & Instagram budget: 200 DKK / day
We are working with facebook’s Page Manager application to boost our
posts and page. Our daily budget for these are 200 DKK and we are running
our advertisements locally in funen to target mainly our older and elder tar-
get group.
Promotional Websites budget: up to 400 DKK / collab
These websites are mainly free but our budget goes up until 400 DKK per
partnership.
Trip Advisor budget: up to 3000 DKK / month
Posters / Flyers & Brochures budget:
500 Flyers: 550 DKK
100 A2 Posters: 2200 DKK
50. PAGE 50
REFERENCE LIST
APPENDIX
CONCLUSIONEVOLUTIONEXPERIMENTATIONIDEATIONINTERPRETATIONDISCOVERYANALYSISMETHODSPROBLEM DEFINITIONINTRODUCTIONEXECUTIVE SUMMARY
TEST PLAN & MATRIX
Matrix
We have used the matrix to describe a more large scale statistical webpage
testing. It is based on various types of visitors, focusing on our target group,
and an audience that would visit a page such a Fjord&Bælts website. By doing
so, we get a more detailed view of our webpage. This allows us to see if we
are in lack of following variables: attention, interest, desire and action. Further-
more we research the different stages our visitors are in in each individual task.
Using this information, we are able to improve our website in these matters.
52. PAGE 52
REFERENCE LIST
APPENDIX
CONCLUSIONEVOLUTIONEXPERIMENTATIONIDEATIONINTERPRETATIONDISCOVERYANALYSISMETHODSPROBLEM DEFINITIONINTRODUCTIONEXECUTIVE SUMMARY
SKETCHING & WIREFRAMING A WEBSITE
Our approach to Fjord & Baelts new website is structured with a sketching and
wireframing process wich is based on our research findings in the discovery
phashe of design thinking.
Further improvements and adjustments will be made afterwards to the wire-
frames and the website prototype itself.
53. PAGE 53
REFERENCE LIST
APPENDIX
CONCLUSIONEVOLUTIONEXPERIMENTATIONIDEATIONINTERPRETATIONDISCOVERYANALYSISMETHODSPROBLEM DEFINITIONINTRODUCTIONEXECUTIVE SUMMARY
SKETCHING & WIREFRAMING A WEBSITE
During the wireframing phase our team have decided to put together a clicka-
ble interactive website wireframe using www.invision.com to conduct our test-
ing and receive feedback on how the website is structured.
The interactive wireframe is available in the following link:
https://invis.io/QSBQZYSG9#/234066924_Index
57. PAGE 57
The communication plan is an important tool when making a campaign. Go-
ing through all the individual steps, backed up by a strong research, we were
able to make a communication plan.
The target group was defined as the communication was adjusted to make a
greater impact in their audience.
Making a creative brief based on the communication plan is a great tool when
trying to communicate the ideas, and overall have a good overview, as to un-
derstanding, and also to avoid misunderstandings.
Fjord&Bælts new message “Research made Fun” is shaped based on all our
research and thoroughly hand picked using the guidelines of the communica-
tion plan, with this message, and the channels we will use, and how they are
going to be utilized, we will be able to not only hit the target audience more
efficiently, bot also make Fjord&Bælt more appealing for future visitors.
58. PAGE 58
The communication plan is an important tool when making a campaign. Go-
ing through all the individual steps, backed up by a strong research, we were
able to make a communication plan.
The target group was defined as the communication was adjusted to make a
greater impact in their audience.
Making a creative brief based on the communication plan is a great tool when
trying to communicate the ideas, and overall have a good overview, as to un-
derstanding, and also to avoid misunderstandings.
Fjord&Bælts new message “Research made Fun” is shaped based on all our
research and thoroughly hand picked using the guidelines of the communica-
tion plan, with this message, and the channels we will use, and how they are
going to be utilized, we will be able to not only hit the target audience more
efficiently, bot also make Fjord&Bælt more appealing for future visitors.
59. PAGE 59
The communication plan is an important tool when making a campaign. Go-
ing through all the individual steps, backed up by a strong research, we were
able to make a communication plan.
The target group was defined as the communication was adjusted to make a
greater impact in their audience.
Making a creative brief based on the communication plan is a great tool when
trying to communicate the ideas, and overall have a good overview, as to un-
derstanding, and also to avoid misunderstandings.
Fjord&Bælts new message “Research made Fun” is shaped based on all our
research and thoroughly hand picked using the guidelines of the communica-
tion plan, with this message, and the channels we will use, and how they are
going to be utilized, we will be able to not only hit the target audience more
efficiently, bot also make Fjord&Bælt more appealing for future visitors.
60. PAGE 60
The communication plan is an important tool when making a campaign. Go-
ing through all the individual steps, backed up by a strong research, we were
able to make a communication plan.
The target group was defined as the communication was adjusted to make a
greater impact in their audience.
Making a creative brief based on the communication plan is a great tool when
trying to communicate the ideas, and overall have a good overview, as to un-
derstanding, and also to avoid misunderstandings.
Fjord&Bælts new message “Research made Fun” is shaped based on all our
research and thoroughly hand picked using the guidelines of the communica-
tion plan, with this message, and the channels we will use, and how they are
going to be utilized, we will be able to not only hit the target audience more
efficiently, bot also make Fjord&Bælt more appealing for future visitors.
61. PAGE 61
REFERENCE LIST
APPENDIX
CONCLUSIONEVOLUTIONEXPERIMENTATIONIDEATIONINTERPRETATIONDISCOVERYANALYSISMETHODSPROBLEM DEFINITIONINTRODUCTIONEXECUTIVE SUMMARY
CODING
Disclaimer: This is just a prototype and we are using the class of .disabled on
every link that is not functional on the website so the users have an easier time
navigating around the website and they don’t have to figure out what works
and what doesn’t. This class changes the cursor.
Flexbox
Flexbox is used throughout the website for displaying content. The CSS3 Flex-
ible Box, or flexbox, is a layout mode providing for the arrangement of ele-
ments on a page such that the elements behave predictably when the page
layout must accommodate different screen sizes and different display devices.
(https://developer.mozilla.org/en-US/docs/Web/CSS/CSS_Flexible_Box_Lay-
out/Using_CSS_flexible_boxes)
The primary layout on our website is achieved using these elements:
<div class=”container”></div>
<div class=”row”></div>
<div class=”column”></div>
Responsiveness
Responsive Web design is the approach that suggests that design and devel-
opment should respond to the user’s behavior and environment based on
screen size, platform and orientation.(Editorial, 2011). We built the website
with responsive design in mind, because in today’s day and age it’s a must-
have thing. Google, which is one of the world’s biggest companies and has
world’s biggest and most used search engine actually punishes websites that
are not responsive (Hickman, 2016). So the responsive design is achieved
mainly using Flexbox, with little tweaks and fixes using regular CSS, such as
the @media command.
62. PAGE 62
REFERENCE LIST
APPENDIX
CONCLUSIONEVOLUTIONEXPERIMENTATIONIDEATIONINTERPRETATIONDISCOVERYANALYSISMETHODSPROBLEM DEFINITIONINTRODUCTIONEXECUTIVE SUMMARY
CODING
This section just below the header is a great example. It’s displayed using Flex-
boxandthenbelow1000px,whenitwouldn’tproperlyfitanymore,it’sdisplayed
in a grid of two. This is achieved by changing the flex-flow to row wrap which
means the content gets wrapped and displayed in the next line rather than con-
tinuing outside the document. The columns have a specified minimum width
of 50% so they are displayed two in a row. See the images on the right.
63. PAGE 63
REFERENCE LIST
APPENDIX
CONCLUSIONEVOLUTIONEXPERIMENTATIONIDEATIONINTERPRETATIONDISCOVERYANALYSISMETHODSPROBLEM DEFINITIONINTRODUCTIONEXECUTIVE SUMMARY
CODING
Reusing elements
Lots of times on websites, there are the same elements. It wouldn’t make sense
to code them over and over again, to deal with this, we use the PHP function in-
clude. It is used on all re-used basic elements such as the navigation, the footer.
Besides these basic elements, we also use it on our Call To Action section that
is re-used on almost every subpage.
This way if we decide to change, we only make one change in the cta-what-we-
offer.php file and it changes everywhere!
To call these files, we use the following command
64. PAGE 64
REFERENCE LIST
APPENDIX
CONCLUSIONEVOLUTIONEXPERIMENTATIONIDEATIONINTERPRETATIONDISCOVERYANALYSISMETHODSPROBLEM DEFINITIONINTRODUCTIONEXECUTIVE SUMMARY
STYLE TILE
As shown on the picture on the right, we have created a
style tile showing the fonts, colours and interface elements
we are going to use on the website, this makes sure we all
are on the same page throughout the rest of the project,
and that the essence of the visual brand is consistent. It is
base for the rest of the design for the visuals that are being
created for the project.
Open Sans
The quick brown fox jumps over the lazy dog
BODY TEXT
Source Sans Pro HEADLINES
The quick brown fox jumps over the lazy dog
#00304C #0A369D
#00A6FB #E8DA45
READ MORE
FJORD&BAELT NEW CAMPAIGN LAUNCHED!
Was own the were that because kicked far of world subdued out
embarkation and phase merit I pass the determined candidates,
could last room, nation why steadily fame. So with they proper
on paint, or harder.
65. PAGE 65
REFERENCE LIST
APPENDIX
CONCLUSIONEVOLUTIONEXPERIMENTATIONIDEATIONINTERPRETATIONDISCOVERYANALYSISMETHODSPROBLEM DEFINITIONINTRODUCTIONEXECUTIVE SUMMARY
ADVERTISEMENT CONTENT POSTERS & VIDEOS
Video
Two videos have been created to work as an advertisement content for social
medias such as Facebook and Instagram.
Videos portray somewhere in between of a regular feeding show done at Fjord
& Baelt. According to questionnaire in the Discovery part of the report(see page
11-13), this event is the most entertaining experience in the research center.
Both videos share the same idea, timing and execution. The basic idea is to
capture a funny / cute animal moment and start the music at the same time as
the word “FUN” pops out to the screen.
Formula for these videos makes it easy for Fjord & Baelt to continue the same
style of advertisement. Phone camera being used in the video makes it inviting
for someone else who has a phone to recreate it and promote Fjord & Baelt on
social media.
Version 1 (See image on the bottom left)
First version of the videos included these effects :
A slight hint of #00A6FB from our color palette in the style guide, serving as
a color filter for the video.
Research Made Fun written in Source Sans Pro Font, that is directed to be
used as headlines in our style guide.
While the rest of the words are white, word FUN is colored in #00A6FB blue,
that we use in our style guide.
Fjord & Baelt logo or any hint of Fjord & Baelt was not included to the video
due to a user being able to see the company’s name as an account that is
publishing the advertisement on multimedia.
Shortly after, the feedback session from the group led to creating a second
version for these advertisements.
66. PAGE 66
REFERENCE LIST
APPENDIX
CONCLUSIONEVOLUTIONEXPERIMENTATIONIDEATIONINTERPRETATIONDISCOVERYANALYSISMETHODSPROBLEM DEFINITIONINTRODUCTIONEXECUTIVE SUMMARY
ADVERTISEMENT CONTENT POSTERS & VIDEOS
Version 2
Second version was considered to be the final on by the group. The changes it
included were these :
Color filter for the video has been replaced with the one being used for the
website header video.
Research Made Fun words are now aligned and colored to fit the original logo
of Fjord & Baelt.
Fjord & Baelt logo has been added to the end of the video.
Music has been added to add comedic timing for when the word “FUN” pops
out in the video.
67. PAGE 67
REFERENCE LIST
APPENDIX
CONCLUSIONEVOLUTIONEXPERIMENTATIONIDEATIONINTERPRETATIONDISCOVERYANALYSISMETHODSPROBLEM DEFINITIONINTRODUCTIONEXECUTIVE SUMMARY
INSTALLATION
Installation Concept has been developed in the form of video.
Principle of the interface is to replace selectable animal icons with full screen
videos of them. Clicking an animal on the old interface would be no longer
required with the new design. Informational text fits perfectly along the video,
as demonstrated in the Touchscreen Presentation Video.
Swiping animal videos would make Fjord & Baelt touch screen installations
more associatable to a mobile app which is widely used media according to
Questionnaire in the Discovery part of the report.
Swiping full screen videos of the animals is more fun. It improves interaction
and visuals within the research center. This was our goal considering the target
audience of kids and school classes.
The text used in the previous interface would still take place in the new one.
This way the new interface can be enjoyed by both - the ones who will read it
and the ones who will not.
69. PAGE 69
REFERENCE LIST
APPENDIX
CONCLUSIONEVOLUTIONEXPERIMENTATIONIDEATIONINTERPRETATIONDISCOVERYANALYSISMETHODSPROBLEM DEFINITIONINTRODUCTIONEXECUTIVE SUMMARY
TESTING
Introduction
Our group has prepared a test plan to gain more insight about the product we
develop in different phases of the design process. The test we have chosen to
do is the following: Think Aloud Testing
It helps us to understand better the structure of our website in the wireframing
phase, as well as refining small details about our final prototype.
Berenike / Think Aloud test subject 1 / 17.05.17
Can you find the opening hours?
I am going to the About page and looking for it, but i cannot find it there.
Therefore I am going into the Visit navigation because i would like to visit the
center so it might be there. It was not quite clear where the opening hours were
placed because when i’m looking for it I expect to see something in the From /
To format. The current way the opening hours are displayed looks like a movie
theater seat reservation.
Can you find Fjord and Baelts telephone number?
It think it will be placed in the footer which is, so yes.
Can you find out how much an adult ticket to the center costs?
Under the visit I can see the price lists. It costs 140 DKK for an adult to enter.
Can you find our Social Icons on the website?
I have found the on the bottom of the page, but i would have looked for the
on the top right corner of the website because i believe that they should have
been placed there.
Insight
The subject points out that it might be a great idea to include a home button
inside our navigation panel because not everybody knows to click the logo.
She thinks the Visit and the Experiences navigation could be easily merged
together. Wireframes doesn’t include drop down navigation menus we are
planning to implement.
The selection and purchase / booking of the tickets should have an option
to select multiple tickets at once.
Inside the booking subpage the subject suggested to reverse the order of
the Selection of the tickets and the form input fields to give an easier flow of
the page and the visitors eyes.
Sal / Think Aloud test subject 2 / 17.05.17
Can you find the social media icons on our website?
I would look for them on the bottom of the page. Successful.
Can you find out what is the website about?
I would look for this information inside the About navigation menu point.
Can you find out our opening hours?
I would go to the Visit navigation menu and it is the first thing I see in there.
Can you find out our telephone number?
Im scrolling to the bottom of the page because based on my previous expe-
70. PAGE 70
REFERENCE LIST
APPENDIX
CONCLUSIONEVOLUTIONEXPERIMENTATIONIDEATIONINTERPRETATIONDISCOVERYANALYSISMETHODSPROBLEM DEFINITIONINTRODUCTIONEXECUTIVE SUMMARY
TESTING
riences that is the place where i will find this information.
If you would like to book a ticket, what would you do?
I click the most visible button in the navigation bar that says Booking.
Where would you look for an option to change the language of the website?
In the top right corner i would look for a flag icon or similar what you have.
Insight
I think the wireframes you have made look really professional to my eyes. Espe-
cially the Booking subpage. It is nicely structured and very informative.
I like the fact that the landing page is going to be a video, it is really cool.
The dive in part under the video is not quite necessary. It might be enough to
make just a visual representation or an arrow instead of the text / pun.
The call to action buttons below the header on the landing page are greatly
placed because it is almost the first thing the visitor will look for.
The participant really liked the small illustrations on our landing page.
For more test subjects see appendix 2 and 3 on page 79-80.
71. PAGE 71
REFERENCE LIST
APPENDIX
CONCLUSIONEVOLUTIONEXPERIMENTATIONIDEATIONINTERPRETATIONDISCOVERYANALYSISMETHODSPROBLEM DEFINITIONINTRODUCTIONEXECUTIVE SUMMARY
C.R.A.P ANALYSIS
To follow the basics of design we applied the CRAP method to our new website
for Fjord&Bælt, by doing this we know the website is up to par, and is aestheti-
cally pleasing for the visitor to look at.
For the contrast we have used the colours blue and yellow, yellow being used
for attention. For repetition we have used the same typography throughout
the website, consistency in icons and buttons are using the colours according
to what their action is.
The alignment throughout the website can be seen as soon as you dive in, the
four most basic information boxes is in a grid of four, then followed up by a grid
of two underneath. The pictures and elements are all aligned to have a nice
and clean structure. For proximity we have placed the text close enough to the
pictures in the 2 grid information section, so there will be no confusion as to
which textbox belongs to what picture.
72. PAGE 72
REFERENCE LIST
APPENDIX
CONCLUSIONEVOLUTIONEXPERIMENTATIONIDEATIONINTERPRETATIONDISCOVERYANALYSISMETHODSPROBLEM DEFINITIONINTRODUCTIONEXECUTIVE SUMMARY
FINAL INSIGHTS & CHANGES
Based on the think aloud testing above our group have gained the following insights of our wireframes: Half of the participants think it would be a good idea
to include a home button to our navigation for easier use of the website.
1- Our Call to Action buttons: Get Tickets and Get A Seasonal pass could be merged into one single button.
2 - We have to find a different way to display our opening hours on the website because the current one is confusing for our visitors.
3 - When buying tickets visitors should be able to purchase multiple tickets.
While we were analysing the outcome of this test our group has decided to find solution for conclusion 1 and 3.
Upon further discussion of conclusion 2, the group did not find it necessary to change the layout of Fjord & Baelts current opening hours due to its complexity
and seasonal changes.
73. PAGE 73
CONCLUSION
REFERENCE LIST
APPENDIX
CONCLUSIONEVOLUTIONEXPERIMENTATIONIDEATIONINTERPRETATIONDISCOVERYANALYSISMETHODSPROBLEM DEFINITIONINTRODUCTIONEXECUTIVE SUMMARY
Working together with Fjord & Baelt gave our team an exciting opportunityto meet the needs of a real life client on the Danish market which will also
drive us in an international scale.
Based on the immersive research we have conducted the team believes that our multimedia solution solves the main issues present with Fjord & Baelt
currently. Mainly focusing on a website redesign we were able to come up with a refined user experience to further drive the visitors to the center. Our
secondary solution is focusing on how the center displays their information and research findings to the visitors, as well as their current media and
business plan.
74. PAGE 74
REFERENCE LIST
REFERENCE LIST
APPENDIX
CONCLUSIONEVOLUTIONEXPERIMENTATIONIDEATIONINTERPRETATIONDISCOVERYANALYSISMETHODSPROBLEM DEFINITIONINTRODUCTIONEXECUTIVE SUMMARY
SMART Goals - Time Management Training From MindTools.com. 2017. [ON-
LINE] Available at: https://www.mindtools.com/pages/article/smart-goals.
htm. [Accessed 3 May 2017].
Pardot. 2017. How to Create Brand Messaging that Really Resonates |
Pardot. [ONLINE] Available at:https://www.pardot.com/blog/how-to-cre-
ate-brand-messaging-that-really-resonates/. [Accessed 3 May 2017].
Customer driven marketing. (2013). In: Principles of Marketing European
Edition, 6th ed. Philip Kotler, Gary Armstrong, Lloyd C. Harris, Nigel Piercy,
p.Chapter 7.
Www2.tns-gallup.dk. (2017). TNS Gallup. [online] Available at: http://www2.
tns-gallup.dk/vores-markedsfokus/medier/printmedier/gallupkompas/kom-
pas-segmenter.aspx [Accessed 4 May 2017].
Marketing made simple. (2017). Push pull marketing strategies - Market-
ing made simple. [online] Available at: http://marketing-made-simple.com/
push-pull-marketing-strategies/ [Accessed 4 May 2017].
Dst.dk. (2017). Find statistik. [online] Available at: http://www.dst.dk/da/
Statistik [Accessed 8 May 2017].
Middelfart Sparekasse. (2017). Værdigrundlag og strategi - Middel-
fart Sparekasse. [online] Available at: https://midspar.dk/om-midspar/
sparekassen/vaerdigrundlag/ [Accessed 8 May 2017].
Aqua-teknik.dk. (2017). Profile | AQUA-TEKNIK A/S. [online] Available at:
http://www.aqua-teknik.dk/en-uk/profile/ [Accessed 8 May 2017].
Sprout Social. (2017). Social Media Demographics for Marketers | Sprout
Social. [online] Available at: http://sproutsocial.com/insights/new-so-
cial-media-demographics/#instagram [Accessed 9 May 2017].
Lindhardt,B.andJensen,E.(2017).TripadvisorogTrustpilotbestemmer
ferien. [online] Berlingske Business. Available at: http://www.business.dk/
digital/tripadvisor-og-trustpilot-bestemmer-ferien [Accessed 9 May 2017].
Anon, (2017). Årsberetning 2016. [online] Available at: http://www.natura-
ma.dk/images/galleri/RSBERETNING2016.pdf [Accessed 10 May 2017].
Det Moderne-individorienteret segment. (2017). 1st ed. [ebook] TNS Gal-
lup, p.Page 1. Available at: http://www2.tns-gallup.dk/media/144663/mod-
erne_individ.pdf [Accessed 10 May 2017].
Hickman, G. (2016). Google Will Punish You If You Don’t Have A Mo-
bile-Friendly Website - Mobile Marketing Engine. [online] Mobile Market-
ing Engine. Available at: http://mobilemarketingengine.com/google-de-
motion-with-no-mobile-website/ [Accessed 19 May 2017].
75. PAGE 75
REFERENCE LIST
REFERENCE LIST
APPENDIX
CONCLUSIONEVOLUTIONEXPERIMENTATIONIDEATIONINTERPRETATIONDISCOVERYANALYSISMETHODSPROBLEM DEFINITIONINTRODUCTIONEXECUTIVE SUMMARY
Segmentationstudyguide.com. (2017). A Step-by-step Guide to Construct-
ing a Perceptual Map. [online] Available at: http://www.segmentationstud-
yguide.com/understanding-perceptual-maps/a-step-by-step-guide-to-con-
structing-a-perceptual-map/ [Accessed 10 May 2017].
Andersen, F., Jensen, B., Jepsen, K., Olsen, M. and Schmalz, P. (2011). Inter-
national Markedsføring. 4th ed. København: Trojka, pp.354-355.
Mindtools.com. (2017). SMART Goals: How to Make Your Goals Achievable.
[online] Available at: https://www.mindtools.com/pages/article/smart-goals.
htm [Accessed 10 May 2017].
Salesforce Pardot. (2017). How to Create Brand Messaging that Really Res-
onates | Salesforce Pardot. [online] Available at: https://www.pardot.com/
blog/how-to-create-brand-messaging-that-really-resonates/ [Accessed 10
May 2017].
Andersen, F., Jensen, B., Jepsen, K., Olsen, M. and Schmalz, P. (2011). Inter-
national Markedsføring. 4th ed. København: Trojka, pp.372-373.
Laja, P. (2017). How To Create A Useful Value Proposition w/ Examples.
[online] CXL. Available at: https://conversionxl.com/value-proposition-exam-
ples-how-to-create/ [Accessed 10 May 2017].
Search Engine Optimization Starter Guide. (2010). 1st ed. [ebook] Google
Inc. Available at: http://static.googleusercontent.com/media/www.google.
com/da//webmasters/docs/search-engine-optimization-starter-guide.pdf
[Accessed 10 May 2017].
The Balance. (2017). What Impact Does Promotional Mix Have on Your
Marketing. [online] Available at: https://www.thebalance.com/what-is-pro-
motional-mix-2295546 [Accessed 10 May 2017].
Smallbusiness.chron.com. (2017). What Is a Media Mix? [online] Availa-
ble at: http://smallbusiness.chron.com/media-mix-78802.html [Accessed 10
May 2017].
Staff, I. (2017). Return On Investment - ROI. [online] Investopedia. Availa-
ble at: http://www.investopedia.com/terms/r/returnoninvestment.asp [Ac-
cessed 10 May 2017].
Årsregnskab 2015. (2015). 1st ed. [ebook] Kerteminde: Driftsfonden
Fjord&Bælt, p.13. Available at: http://www.fjordbaelt.dk/images/Ny-web/
indhold/om/organisation/pdf/fjordogbaelt_aarsregnskab_2015.pdf [Ac-
cessed 17 May 2017].