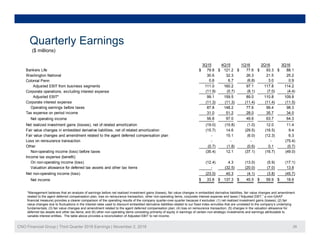
- CNO Financial Group reported financial and operating results for 3Q16 with comparisons to 3Q15.
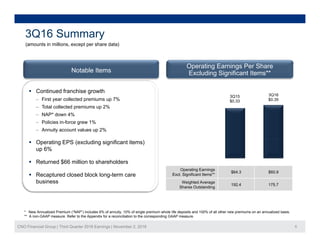
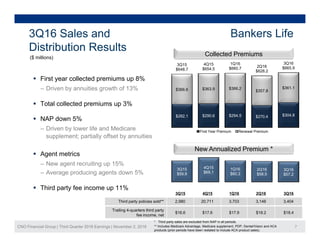
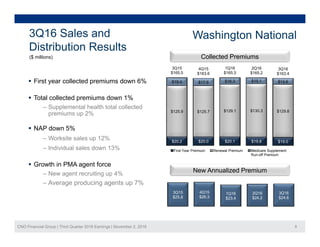
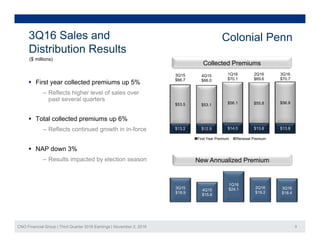
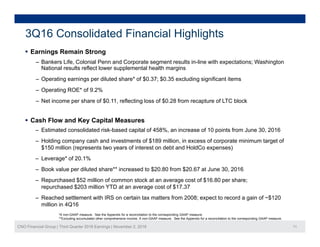
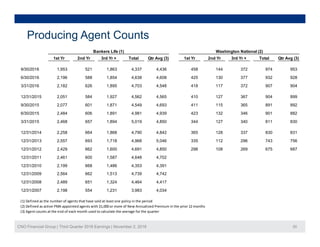
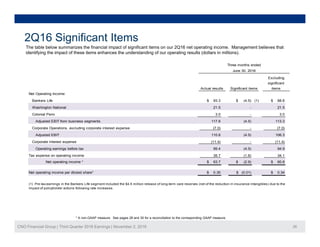
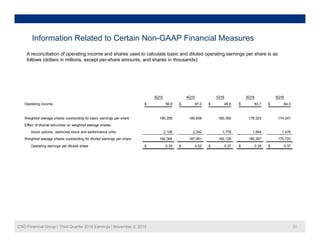
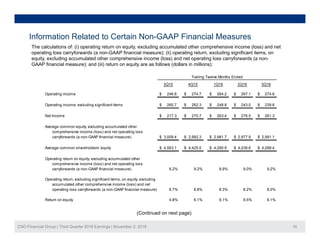
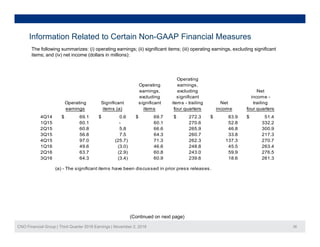
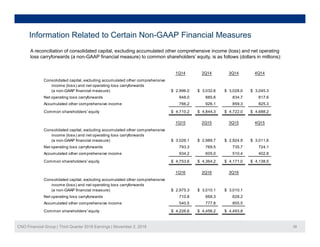
- Key highlights included continued franchise growth with collected premiums up 2% and policies in-force up 1%. Operating EPS excluding significant items was up 6% from $0.33 to $0.35.
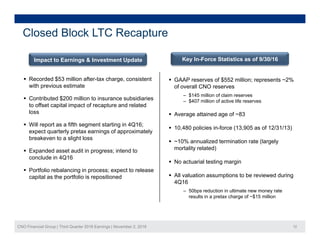
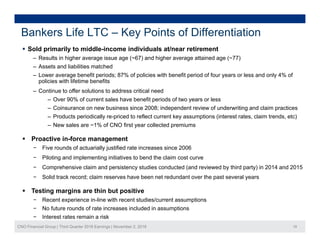
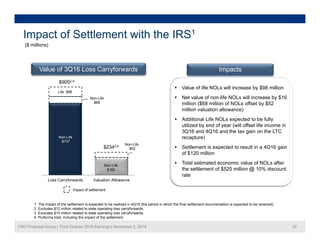
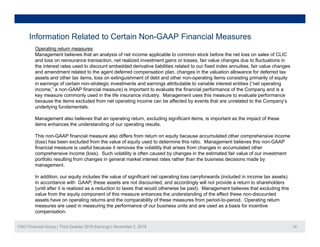
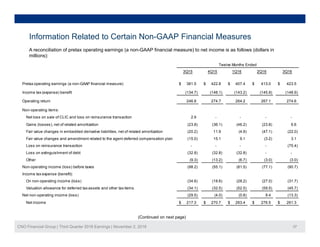
- The company recaptured its closed block long-term care business, recording a $53 million after-tax charge as expected. Administrative functions have transitioned smoothly with no disruption to policyholders.