The document provides Ryder System's forecast for the fourth quarter of 2012 and full year 2013. Some key points:
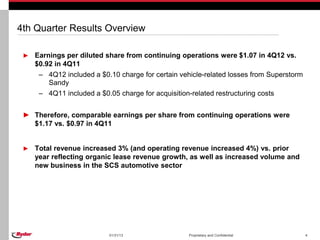
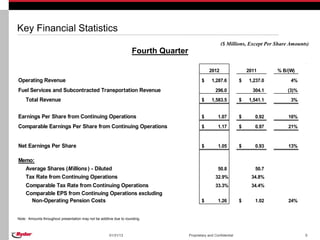
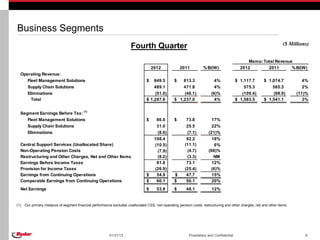
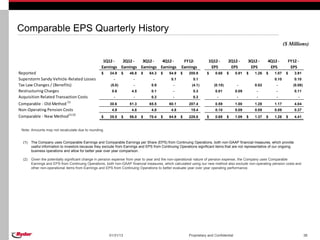
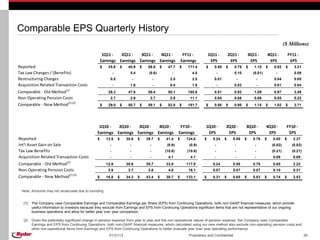
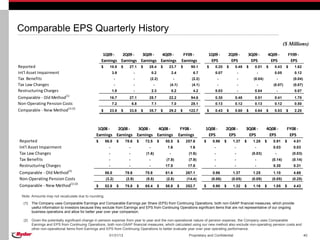
- Fourth quarter 2012 earnings per share were $1.07 compared to $0.92 in 2011, with comparable EPS of $1.17 vs. $0.97 in 2011.
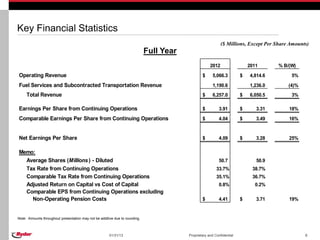
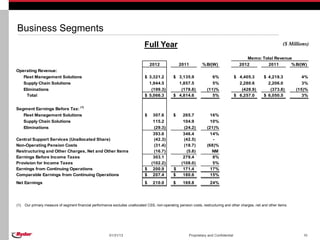
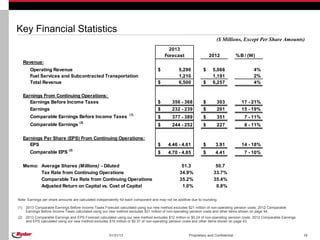
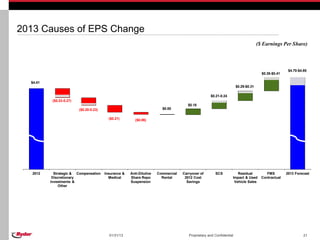
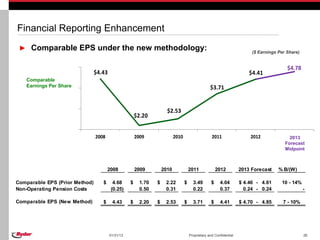
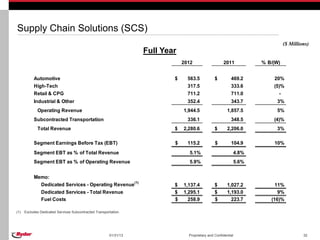
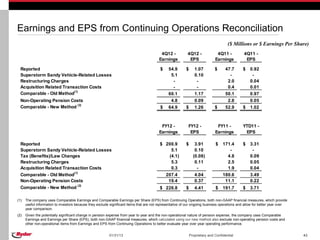
- Full year 2012 revenue increased 3% to $6.26 billion, earnings per share increased 18% to $3.91, and comparable EPS increased 16% to $4.04.
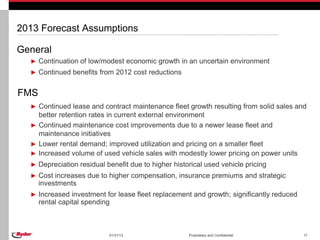
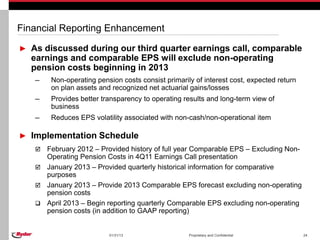
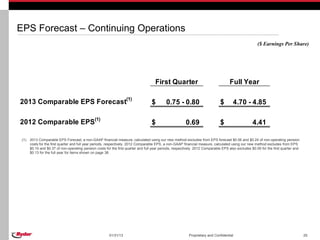
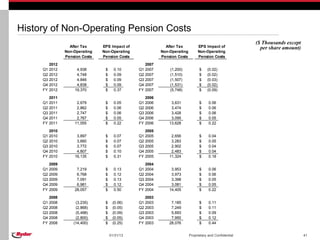
- The 2013 forecast excludes non-operating pension costs from comparable earnings measures going forward.
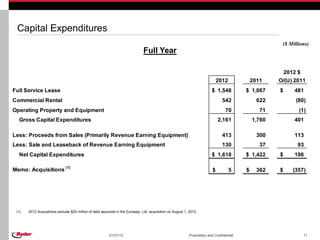
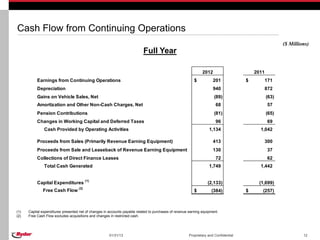
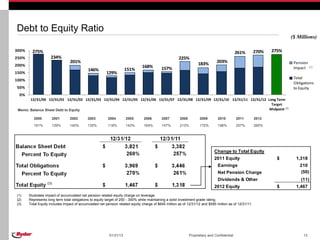
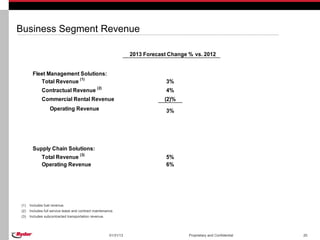
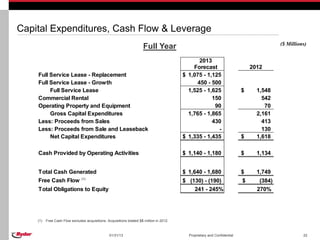
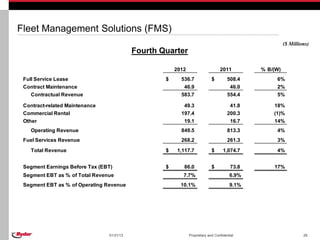
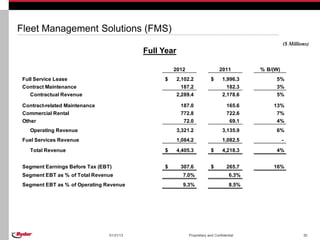
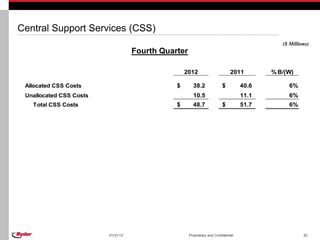
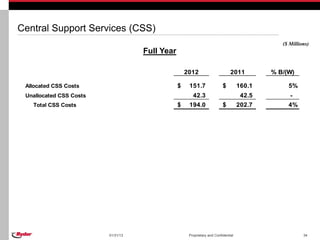
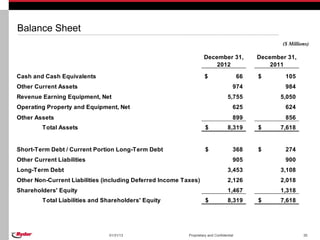
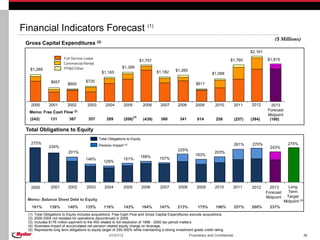
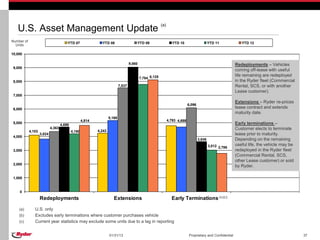
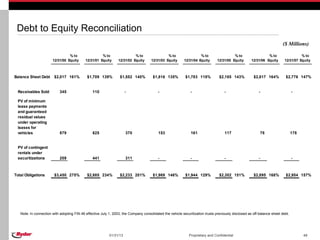
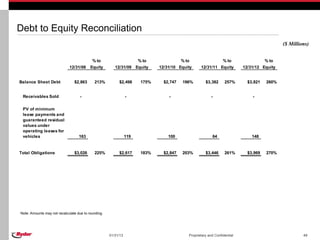
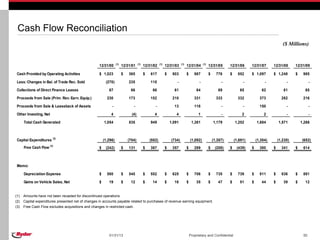
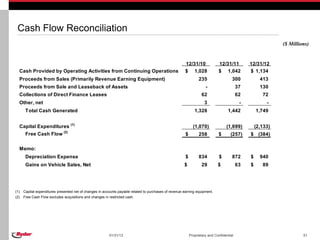
- The presentation includes details on segment results, capital expenditures, cash flow, and debt levels.