Download as PPS, PPTX
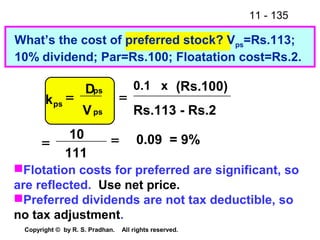
![11 - 85
Copyright © by R. S. Pradhan. All rights reserved.
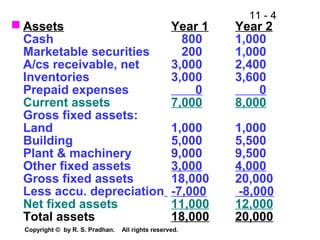
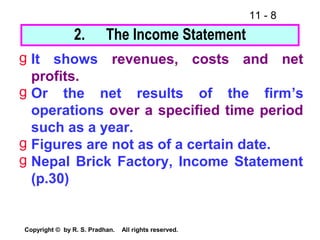
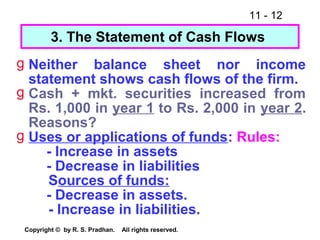
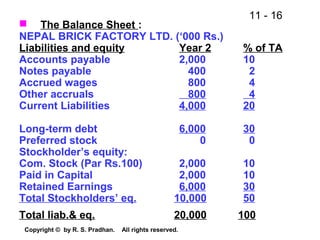
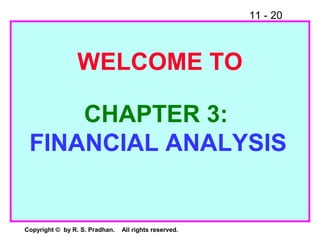
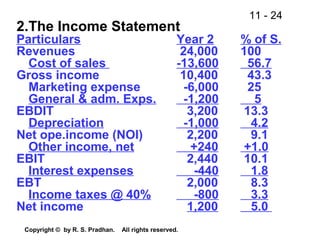
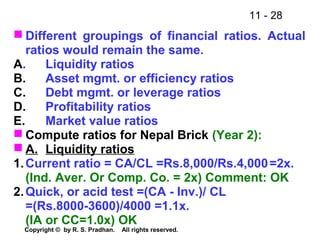
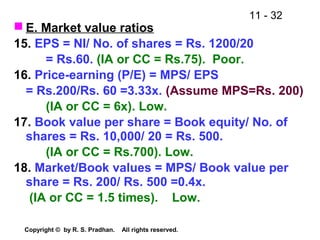
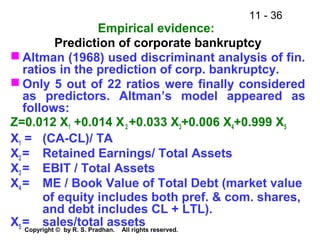
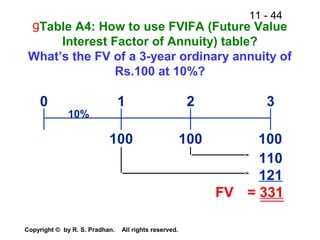
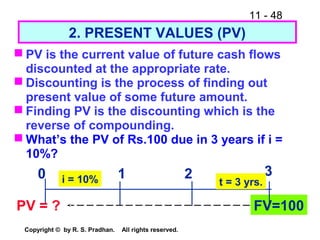
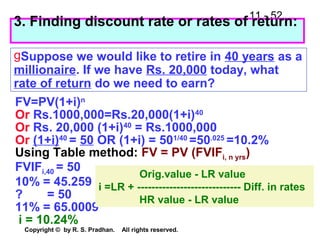
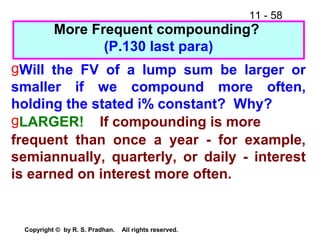
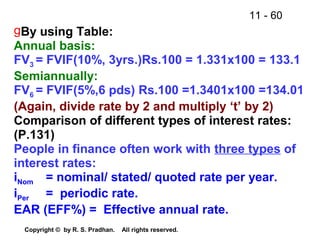
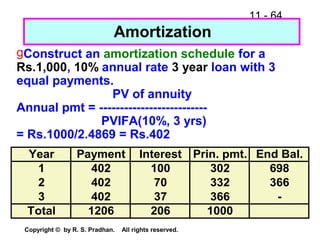
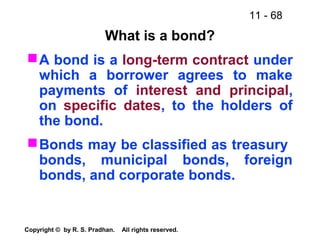
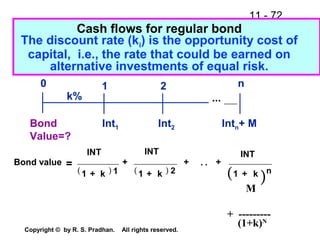
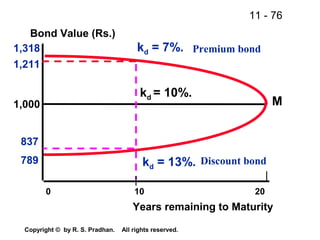
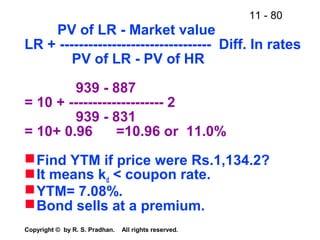
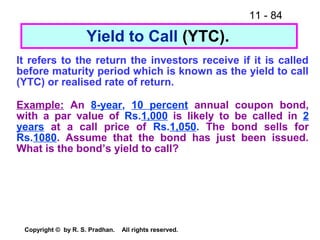
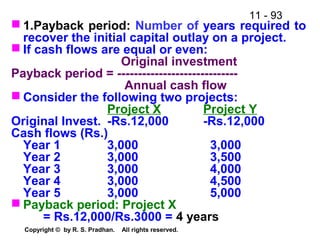
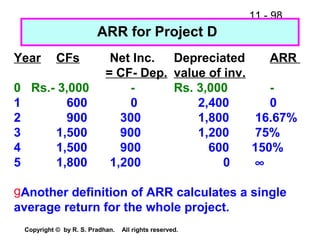
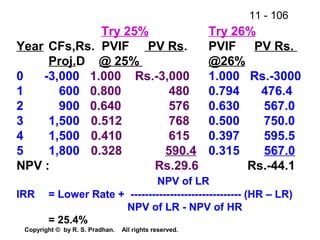
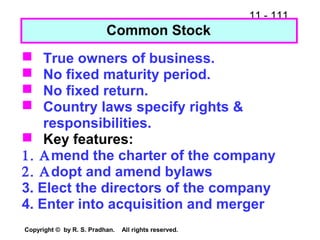
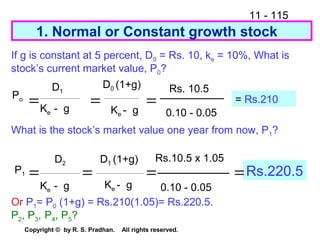
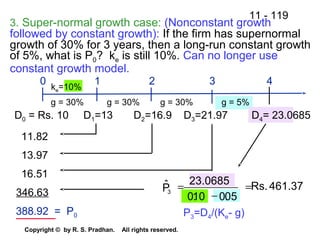
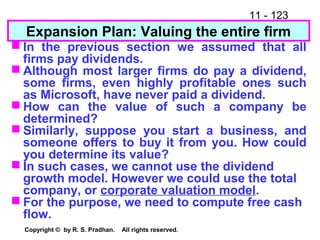
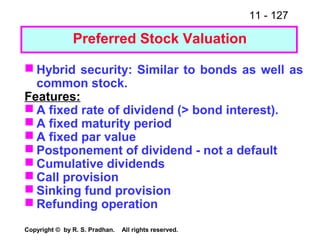
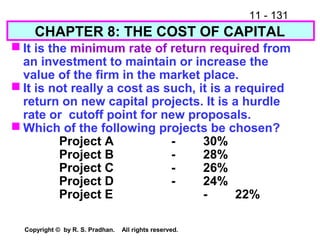
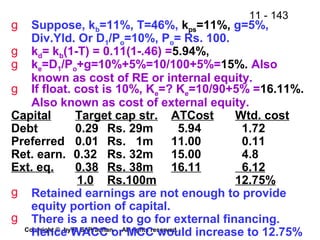
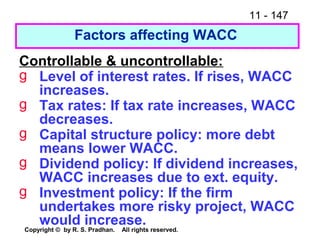
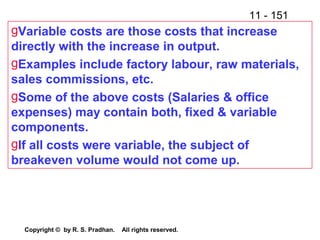
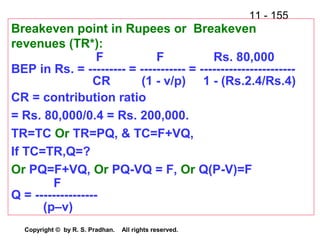
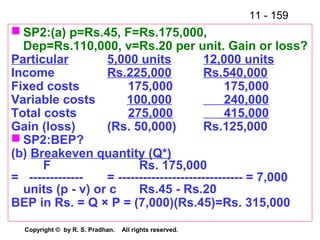
a)Try 6%
VB = (PVIFAi%,n yrs.)C + (PVIFi%, n
th
yr) Call Price
Rs.1,080=(PVIFA6,2)Rs.100+(PVIF6,2)Rs. 1050
Rs.1,080 = (1.8344)100 + (0.89)1050
Rs.1,080 = 1118
Try 8%
Rs.1,080=(PVIFA8,2)Rs.100+(PVIF8,2)Rs.1050
Rs.1,080 = (1.7833)100 + (0.8573)1050
Rs.1,080 = 1078
By interpolation,
YTC=6+[(1118-1080)x(2)/(1118-1078)] =7.9%.](https://image.slidesharecdn.com/finance-141220222429-conversion-gate01/85/Financial-Management-85-320.jpg)
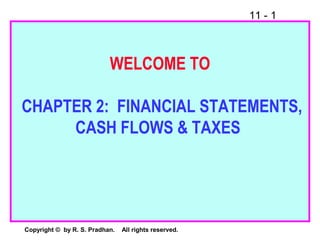
![11 - 96
Copyright © by R. S. Pradhan. All rights reserved.
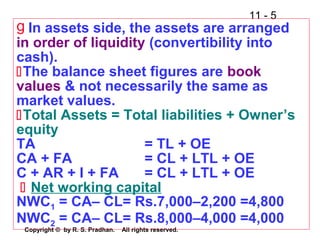
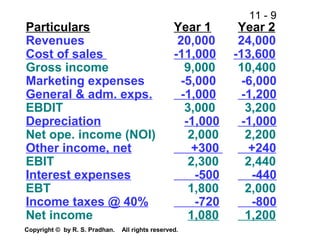
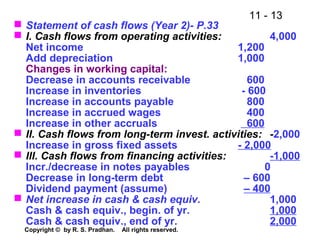
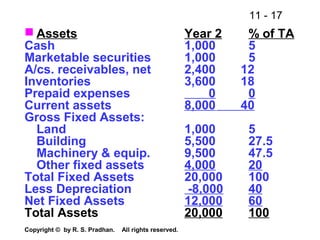
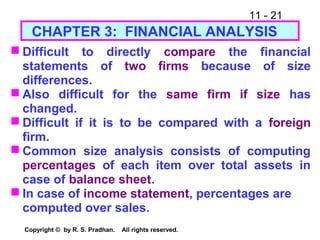
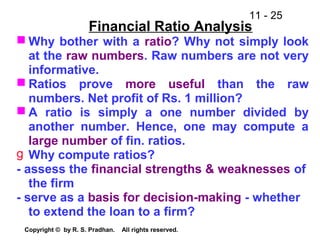
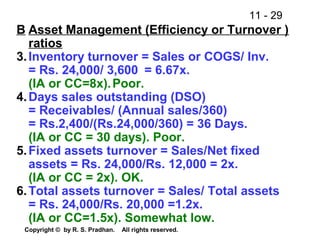
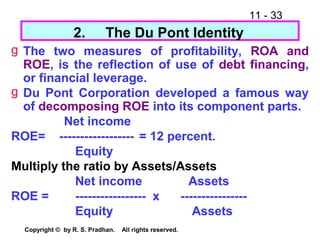
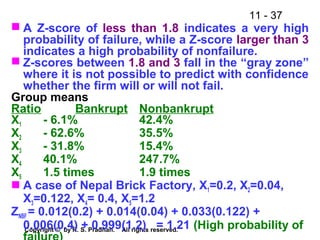
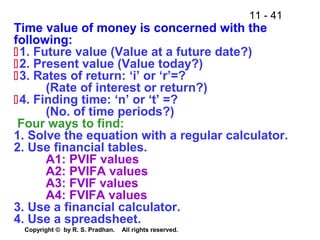
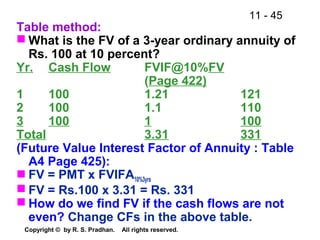
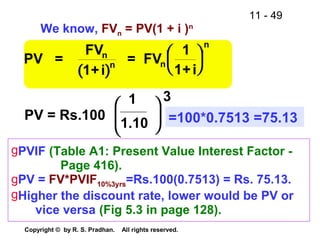
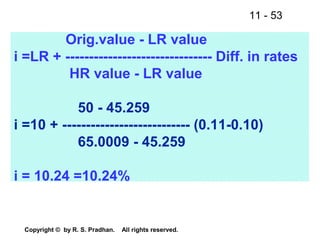
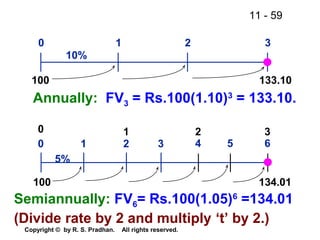
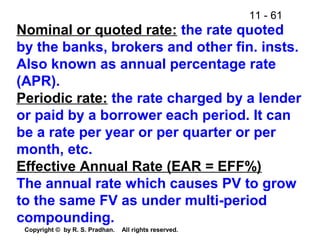
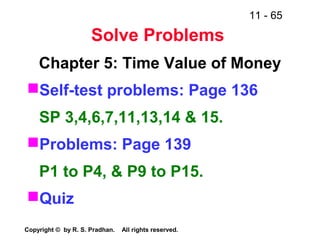
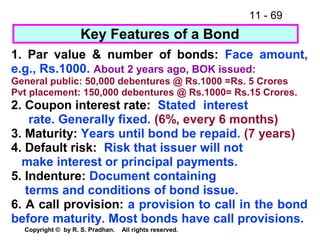
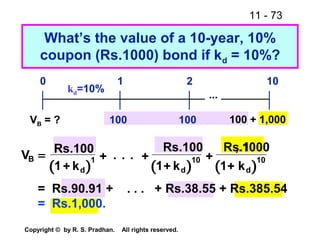
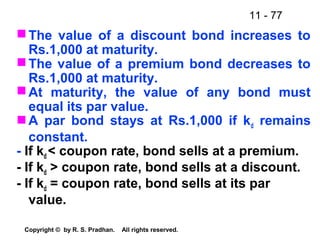
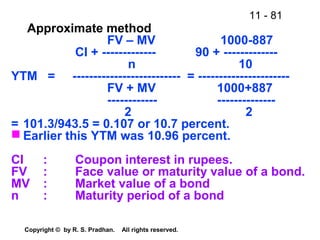
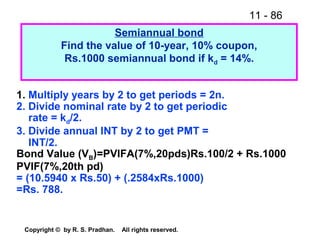
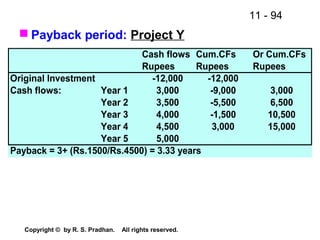
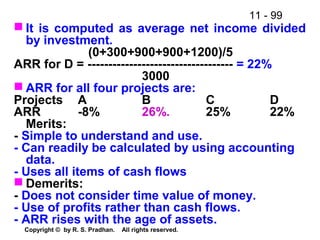
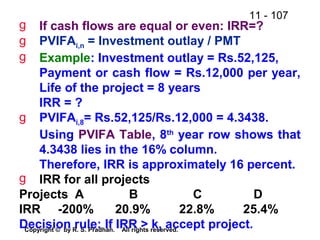
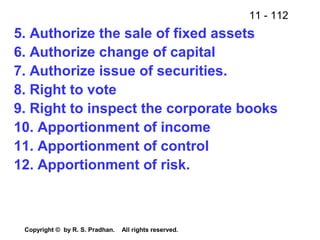
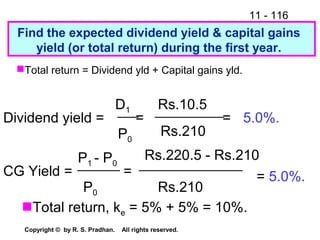
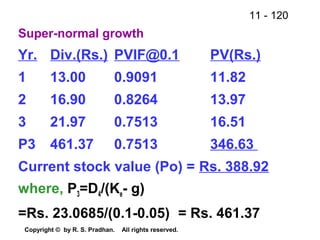
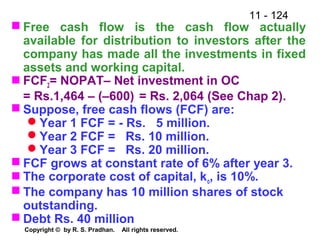
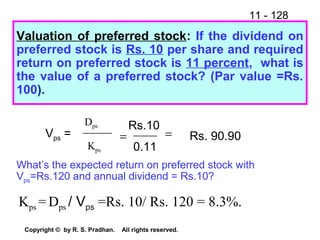
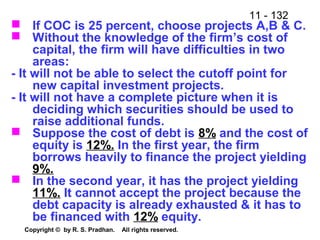
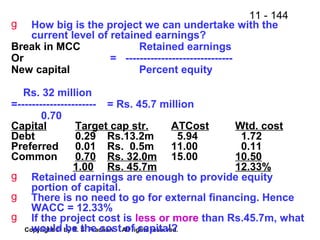
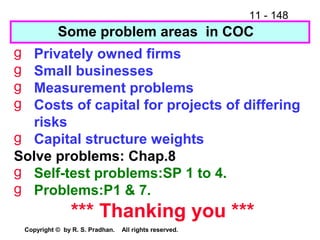
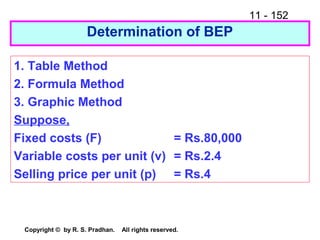
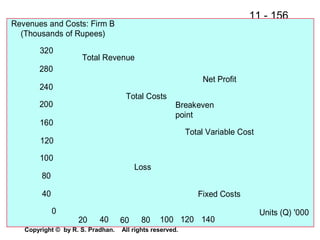
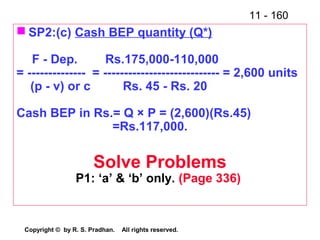
Discounted Cash Payback
(Assume that cost of capital is 10%)
Discounted Pay Back Period (Project D)
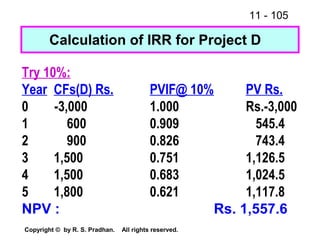
Year CFs, D, Rs. PVIF@ 10% PV Rs. Cum. CF 0 -3,000Cum CFs, Rs. Or Cum CFs
0 -3000 1 (3,000.0) (3,000.0) (3,000.0)
1 600 0.909 545.4 (2,454.6) 545.4
2 900 0.826 743.4 (1,711.2) 1,288.8
3 1,500 0.751 1,126.5 (584.7) 2,415.3
4 1,500 0.683 1,024.5 439.8 3,439.8
5 1,800 0.621 1,117.8 1,557.6 4,557.6
Discounted cash payback:
= 3 + [(Rs.3,000 - Rs.2,415.3) / 1,024.5]
= 3 + (584.7 / 1,024.5) = 3.57 years.](https://image.slidesharecdn.com/finance-141220222429-conversion-gate01/85/Financial-Management-96-320.jpg)


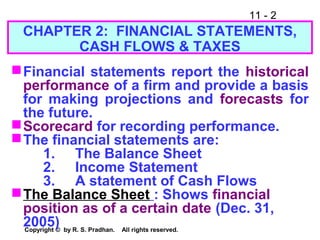
The document provides an overview of financial analysis tools including financial statements, ratios, and common size statements. It discusses the three main financial statements - the balance sheet, income statement, and statement of cash flows. It then explains how to analyze these statements using common size statements, which express each line item as a percentage of total assets or total sales. Finally, it introduces financial ratio analysis, explaining that ratios are useful for assessing a firm's financial strengths and weaknesses and serving as a basis for decision making. Ratios are computed by dividing one number by another and can provide more informative insights than raw numbers alone.


![[9] fashion camps](https://cdn.slidesharecdn.com/ss_thumbnails/9fashioncamps-150213074342-conversion-gate02-thumbnail.jpg?width=640&height=640&fit=bounds)