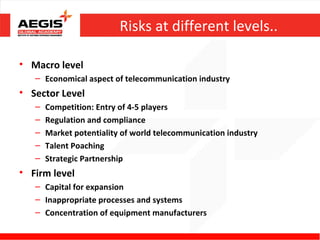
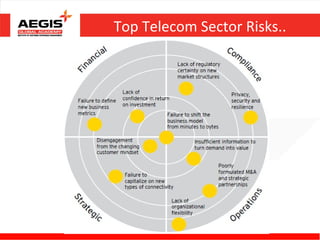
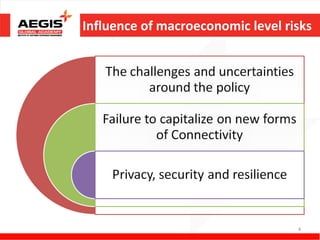
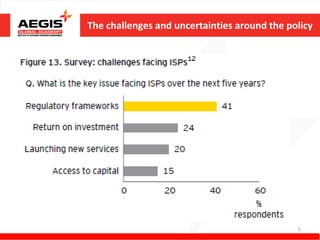
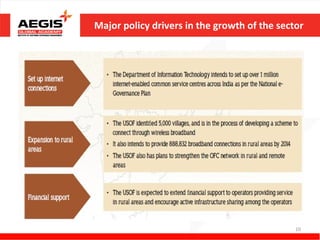
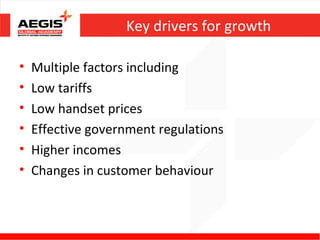
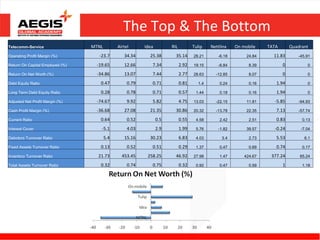
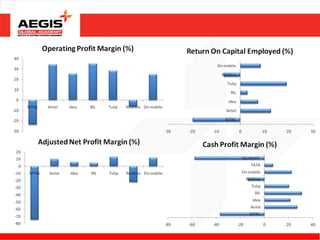
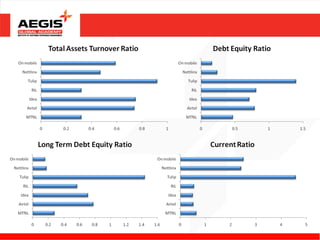
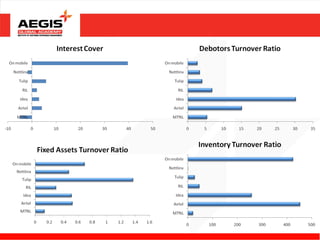
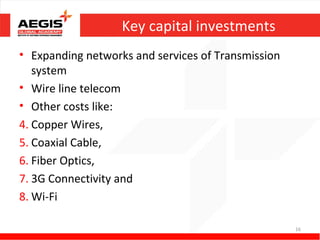
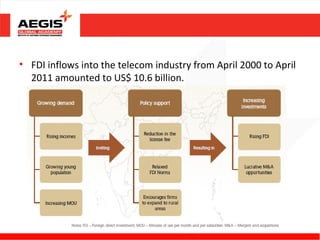
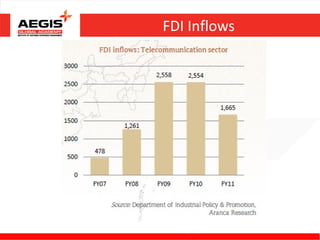
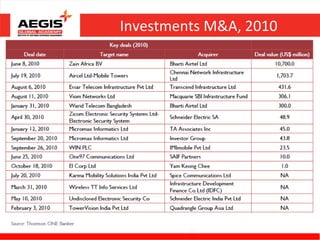
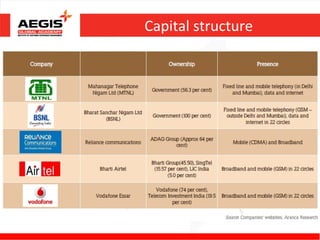
‘The Industry Level Analysis
     of Telecom Sector’


             BY
       Mir Zeeshan Ali
Risks at different levels..

• Macro level
   – Economical aspect of telecommunication industry
• Sector Level
   –   Competition: Entry of 4-5 players
   –   Regulation and compliance
   –   Market potentiality of world telecommunication industry
   –   Talent Poaching
   –   Strategic Partnership
• Firm level
   – Capital for expansion
   – Inappropriate processes and systems
   – Concentration of equipment manufacturers
Top Telecom Sector Risks..
Influence of macroeconomic level risks


                                   4
The challenges and uncertainties around the policy


• Faced by new market structures include
  shifting regulatory standpoints on wholesale
  broadband access pricing
• Going forward, new spectrum releases will
  shape 4G market structures
• Continued regulatory pressure
• Rich source of government taxation


                                                         5
Failure to capitalize on new forms of Connectivity


• New types of connectivity, notably M2M links
  require new types of strategies
• From human- to machine-based:
3.“interconnectedness” of devices, through
  technologies and links
4.For M2M and
5.NFC

                                                          6
Privacy, security and resilience

• Array of threats faced by operators
• Mobile phones evolve into personal data hubs
• Threats are majorly coming from:

5.Cloud,
6.Web 2.0 and
7. Mobile apps

                                             7
Factors that influence competition


                               8
Major policy drivers in the growth of the sector


                                             9
Major policy drivers in the growth of the sector


                                              10
Key drivers for growth

•   Multiple factors including
•   Low tariffs
•   Low handset prices
•   Effective government regulations
•   Higher incomes
•   Changes in customer behaviour
The Top & The Bottom
Telecomm-Service                 MTNL         Airtel      Idea         RIL          Tulip   Nettlinx   On mobile    TATA       Quadrant
Operating Profit Margin (%)        -23.7         34.34      25.38        35.14      28.21      -6.18        24.84     11.83       -45.91

Return On Capital Employed (%)    -19.65         12.66       7.34            2.92   19.15      -6.84         8.39          0          0

Return On Net Worth (%)           -34.86         13.07       7.44            2.77   28.63     -12.85         8.07          0          0

Debt Equity Ratio                   0.47           0.79      0.71            0.81     1.4       0.24         0.16      1.94           0

Long Term Debt Equity Ratio         0.28           0.78      0.71            0.57    1.44       0.18         0.16      1.94           0

Adjusted Net Profit Margin (%)    -74.67           9.92      5.82            4.75   13.03     -22.15        11.81     -5.85       -94.93

Cash Profit Margin (%)            -36.68         27.08      21.35        30.86      20.32     -13.78        22.35      7.13       -57.74

Current Ratio                       0.64           0.52          0.5         0.55    4.58       2.42         2.51      0.83         0.13

Interest Cover                      -5.1           4.03          2.9         1.99    5.76      -1.82        39.57     -0.24        -7.04

Debotors Turnover Ratio                 5.4      15.16      30.23            6.83    4.03        3.4         2.73      5.53          6.1

Fixed Assets Turnover Ratio         0.13           0.52      0.51            0.29    1.37       0.47         0.69      0.74         0.17

Inventory Turnover Ratio           21.73        453.45     258.25        46.92      27.98       1.47       424.67    377.24        85.24

Total Assets Turnover Ratio         0.32           0.74      0.75            0.32    0.92       0.47         0.59          1        1.18
Key capital investments
• Expanding networks and services of Transmission
   system
• Wire line telecom
• Other costs like:
4. Copper Wires,
5. Coaxial Cable,
6. Fiber Optics,
7. 3G Connectivity and
8. Wi-Fi

                                                    16
• FDI inflows into the telecom industry from April 2000 to April
  2011 amounted to US$ 10.6 billion.
FDI Inflows
Investments M&A, 2010
Capital structure

Finance

  • 1.
    ‘The Industry LevelAnalysis of Telecom Sector’ BY Mir Zeeshan Ali
  • 2.
    Risks at differentlevels.. • Macro level – Economical aspect of telecommunication industry • Sector Level – Competition: Entry of 4-5 players – Regulation and compliance – Market potentiality of world telecommunication industry – Talent Poaching – Strategic Partnership • Firm level – Capital for expansion – Inappropriate processes and systems – Concentration of equipment manufacturers
  • 3.
  • 4.
  • 5.
    The challenges anduncertainties around the policy • Faced by new market structures include shifting regulatory standpoints on wholesale broadband access pricing • Going forward, new spectrum releases will shape 4G market structures • Continued regulatory pressure • Rich source of government taxation 5
  • 6.
    Failure to capitalizeon new forms of Connectivity • New types of connectivity, notably M2M links require new types of strategies • From human- to machine-based: 3.“interconnectedness” of devices, through technologies and links 4.For M2M and 5.NFC 6
  • 7.
    Privacy, security andresilience • Array of threats faced by operators • Mobile phones evolve into personal data hubs • Threats are majorly coming from: 5.Cloud, 6.Web 2.0 and 7. Mobile apps 7
  • 8.
  • 9.
    Major policy driversin the growth of the sector 9
  • 10.
    Major policy driversin the growth of the sector 10
  • 11.
    Key drivers forgrowth • Multiple factors including • Low tariffs • Low handset prices • Effective government regulations • Higher incomes • Changes in customer behaviour
  • 12.
    The Top &The Bottom Telecomm-Service MTNL Airtel Idea RIL Tulip Nettlinx On mobile TATA Quadrant Operating Profit Margin (%) -23.7 34.34 25.38 35.14 28.21 -6.18 24.84 11.83 -45.91 Return On Capital Employed (%) -19.65 12.66 7.34 2.92 19.15 -6.84 8.39 0 0 Return On Net Worth (%) -34.86 13.07 7.44 2.77 28.63 -12.85 8.07 0 0 Debt Equity Ratio 0.47 0.79 0.71 0.81 1.4 0.24 0.16 1.94 0 Long Term Debt Equity Ratio 0.28 0.78 0.71 0.57 1.44 0.18 0.16 1.94 0 Adjusted Net Profit Margin (%) -74.67 9.92 5.82 4.75 13.03 -22.15 11.81 -5.85 -94.93 Cash Profit Margin (%) -36.68 27.08 21.35 30.86 20.32 -13.78 22.35 7.13 -57.74 Current Ratio 0.64 0.52 0.5 0.55 4.58 2.42 2.51 0.83 0.13 Interest Cover -5.1 4.03 2.9 1.99 5.76 -1.82 39.57 -0.24 -7.04 Debotors Turnover Ratio 5.4 15.16 30.23 6.83 4.03 3.4 2.73 5.53 6.1 Fixed Assets Turnover Ratio 0.13 0.52 0.51 0.29 1.37 0.47 0.69 0.74 0.17 Inventory Turnover Ratio 21.73 453.45 258.25 46.92 27.98 1.47 424.67 377.24 85.24 Total Assets Turnover Ratio 0.32 0.74 0.75 0.32 0.92 0.47 0.59 1 1.18
  • 16.
    Key capital investments •Expanding networks and services of Transmission system • Wire line telecom • Other costs like: 4. Copper Wires, 5. Coaxial Cable, 6. Fiber Optics, 7. 3G Connectivity and 8. Wi-Fi 16
  • 17.
    • FDI inflowsinto the telecom industry from April 2000 to April 2011 amounted to US$ 10.6 billion.
  • 18.
  • 19.
  • 20.