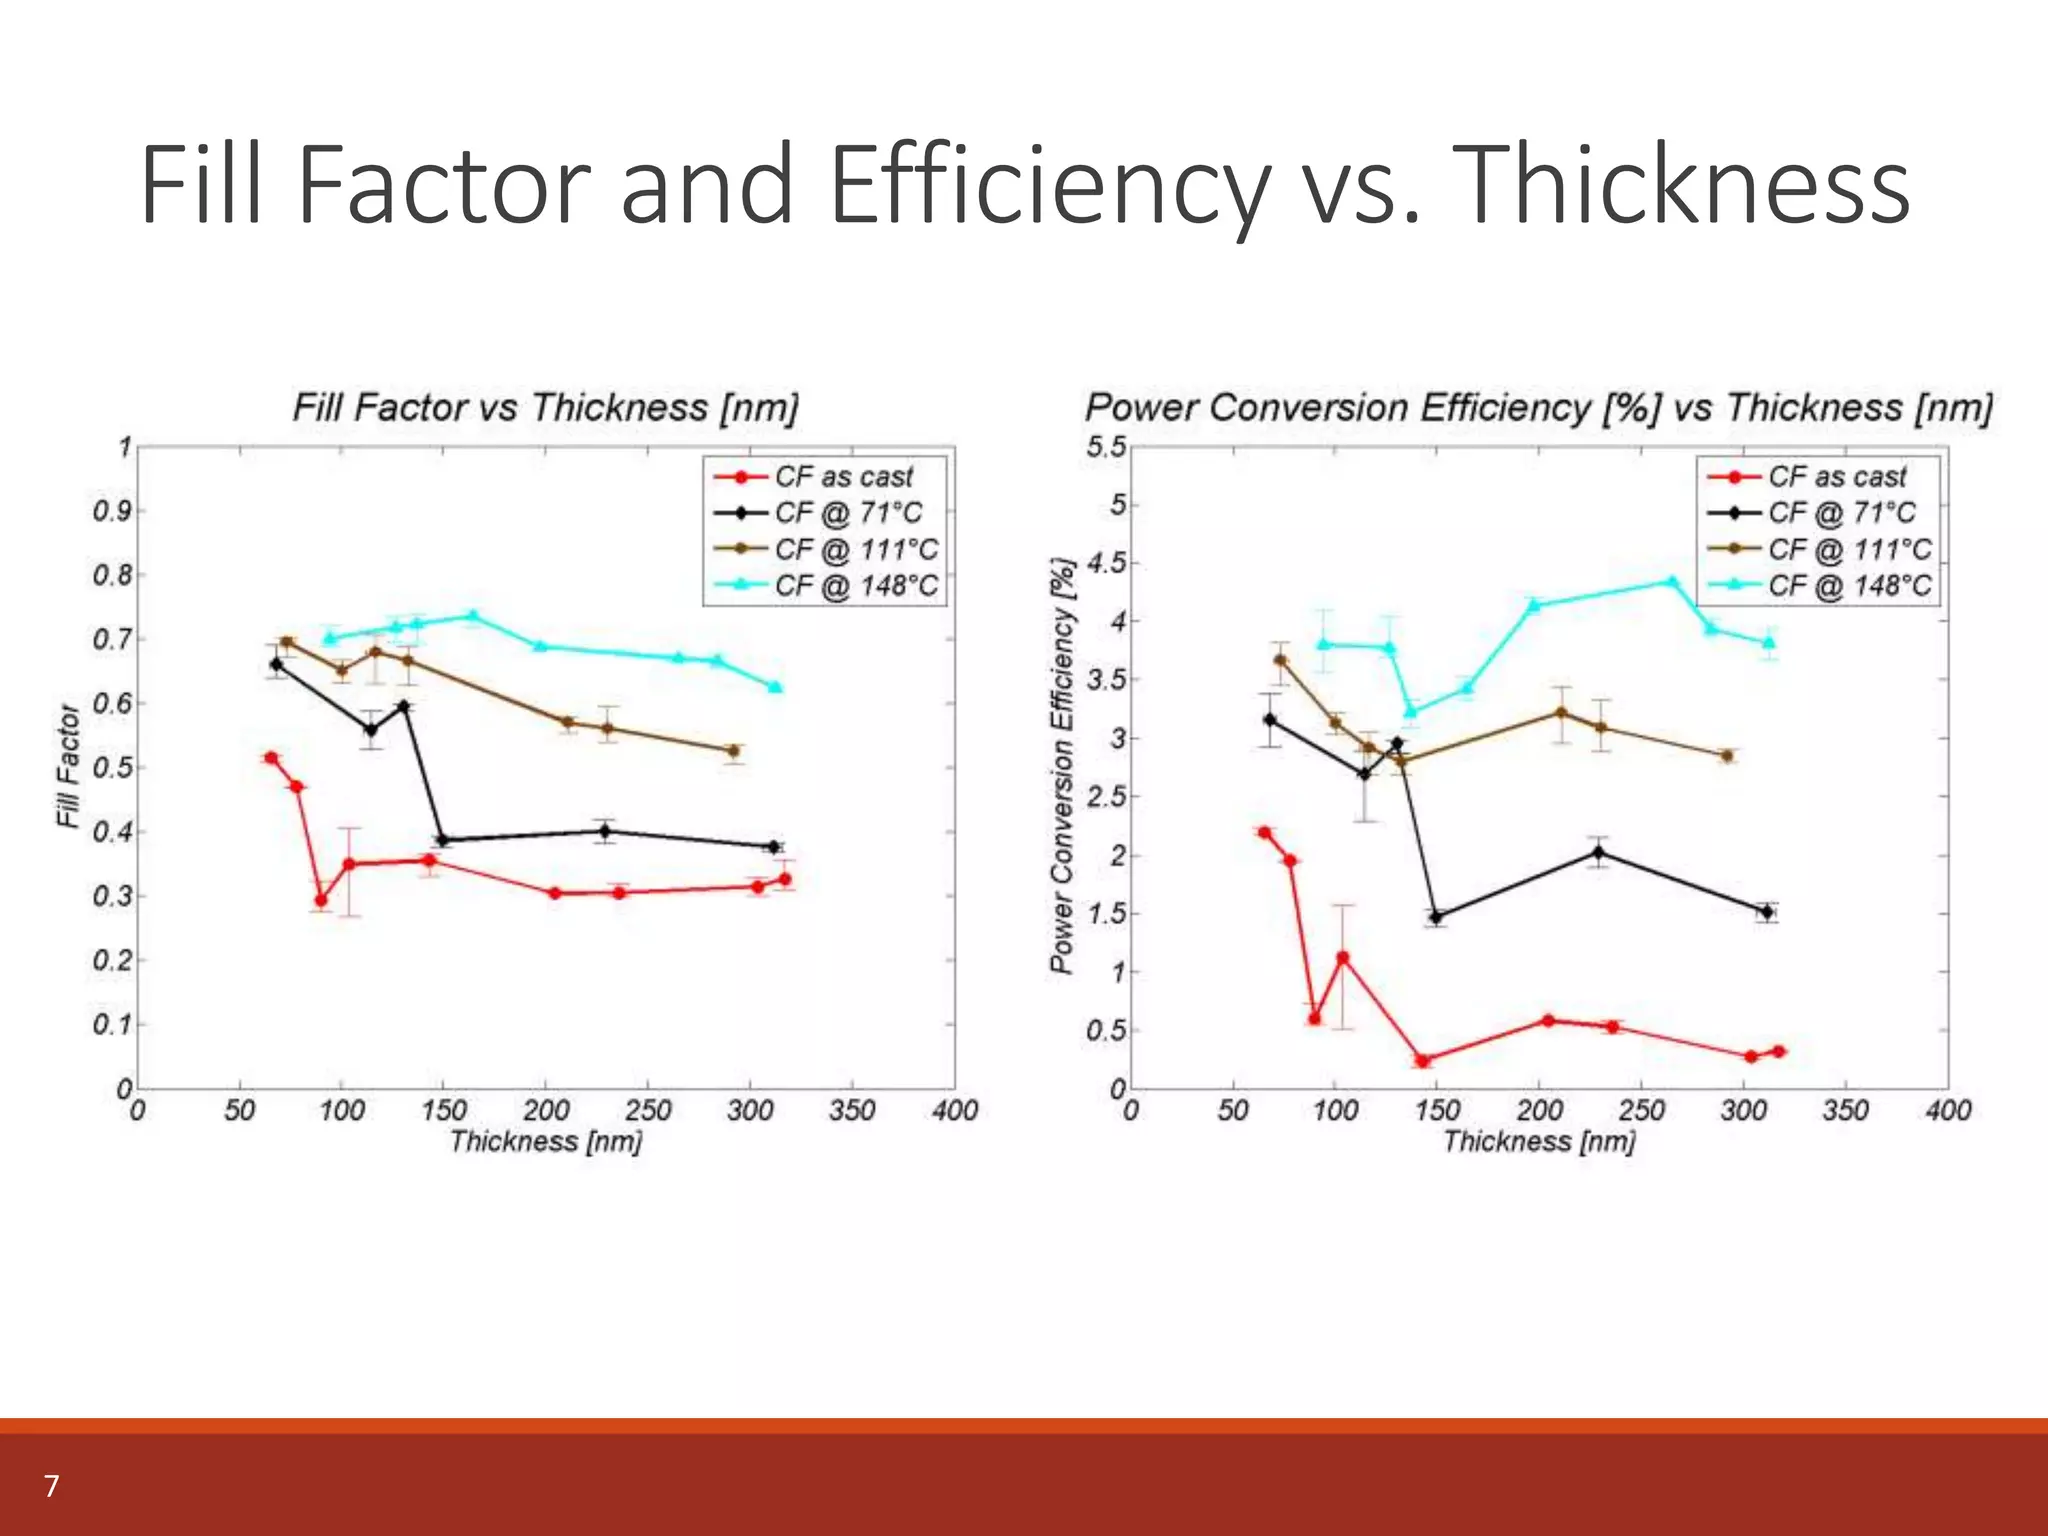
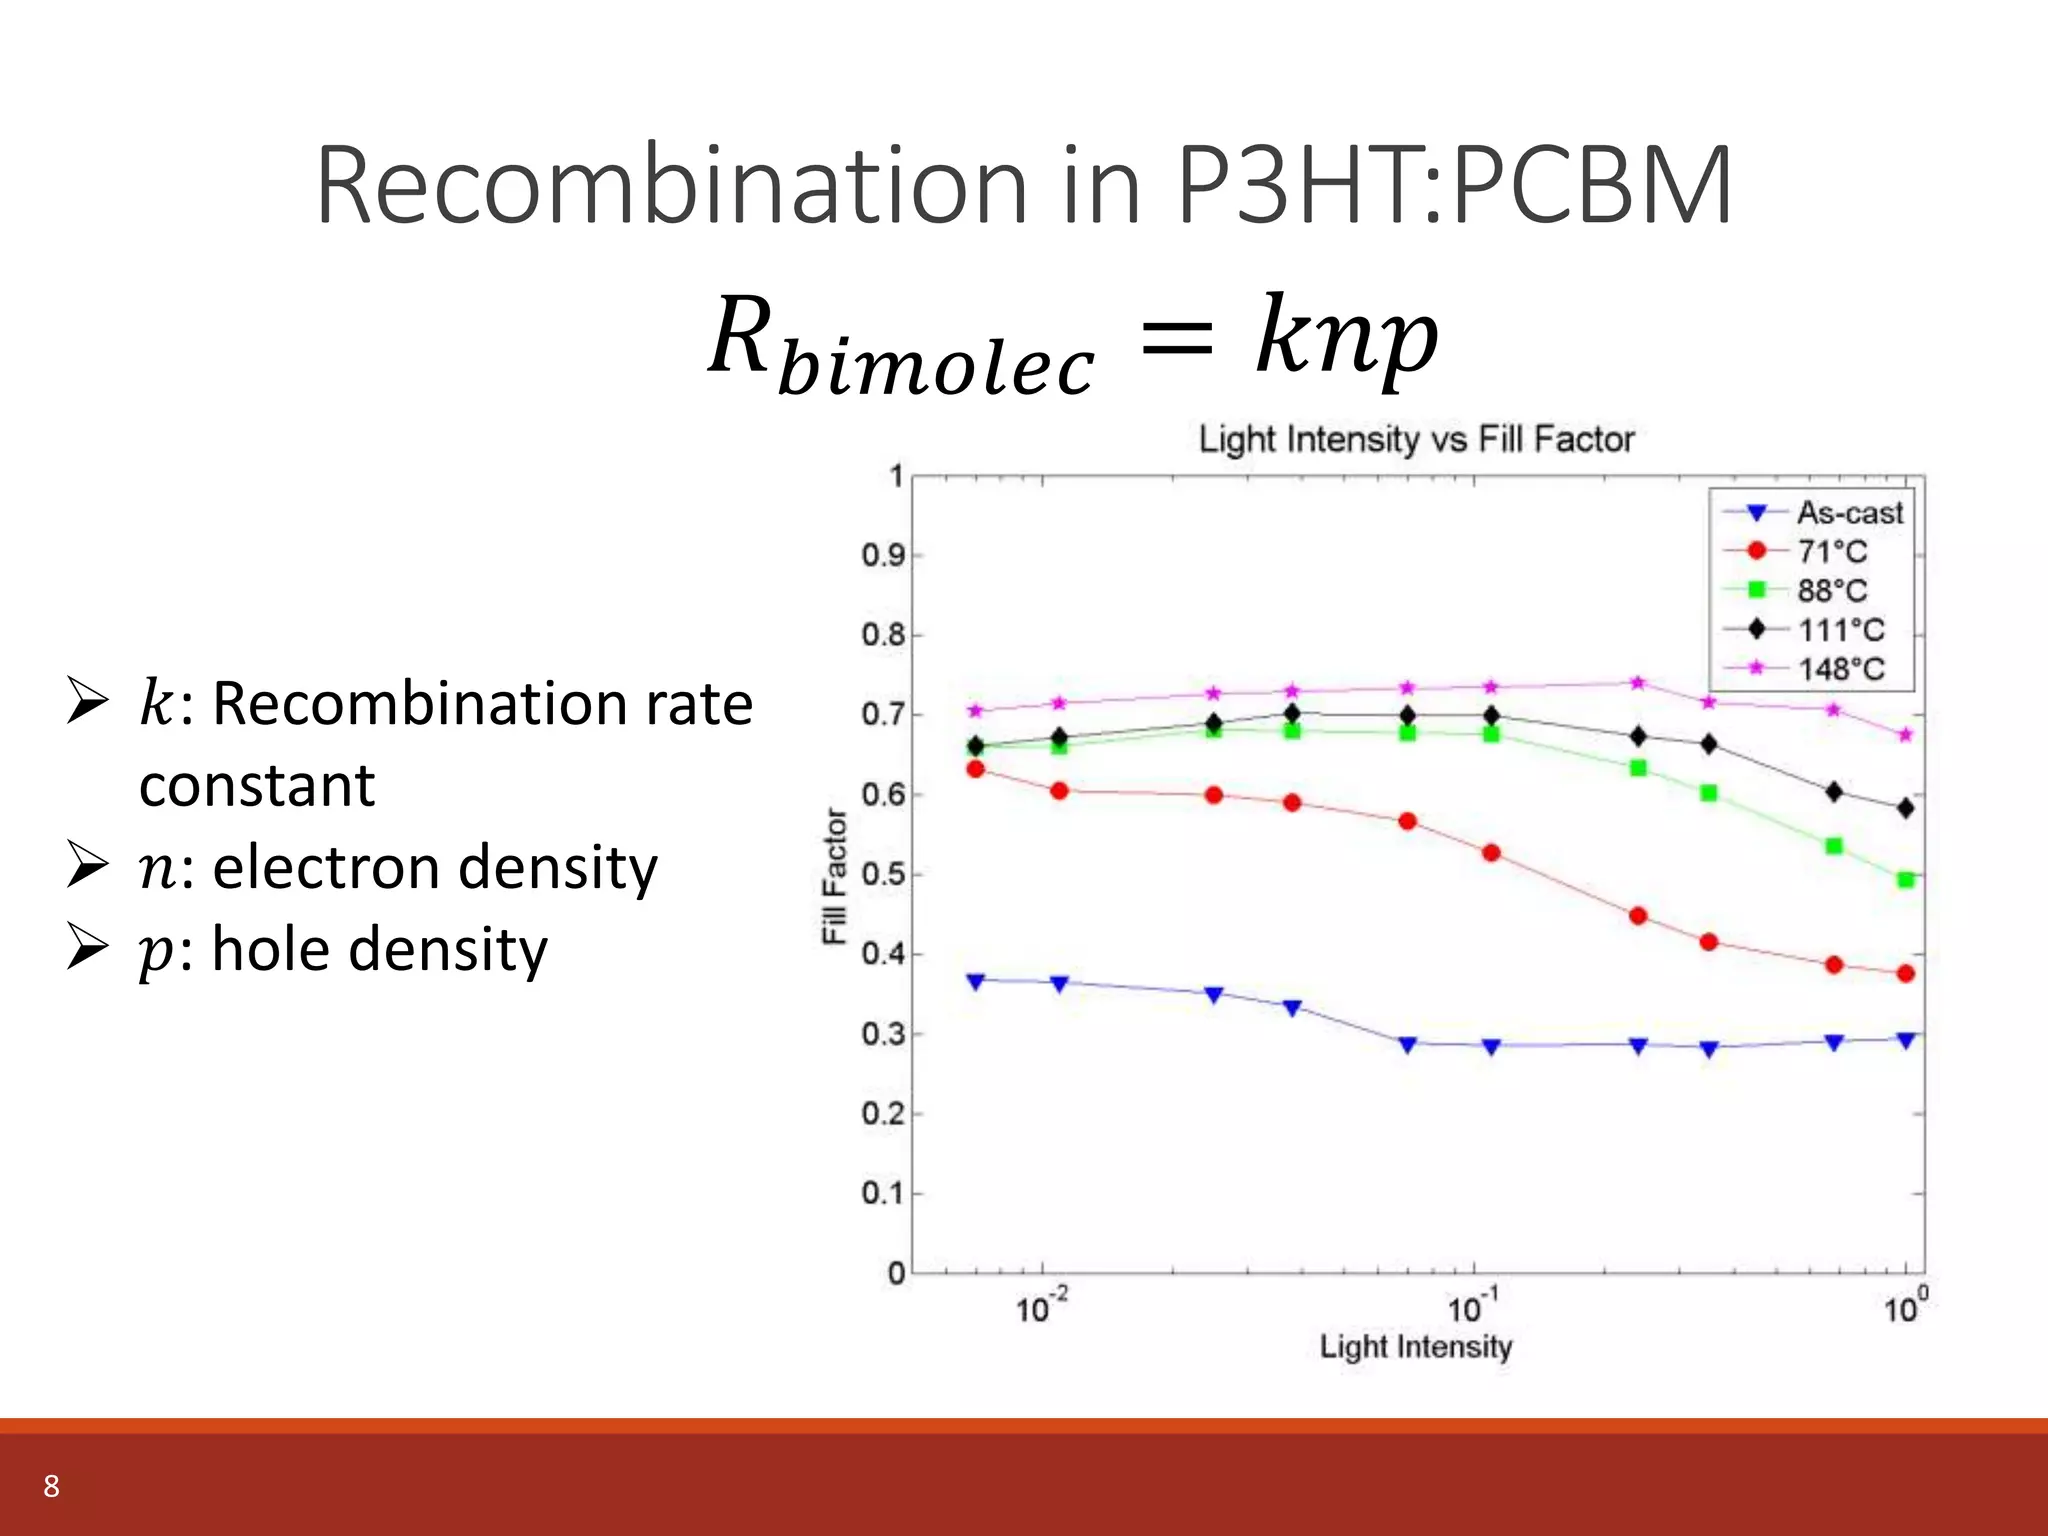
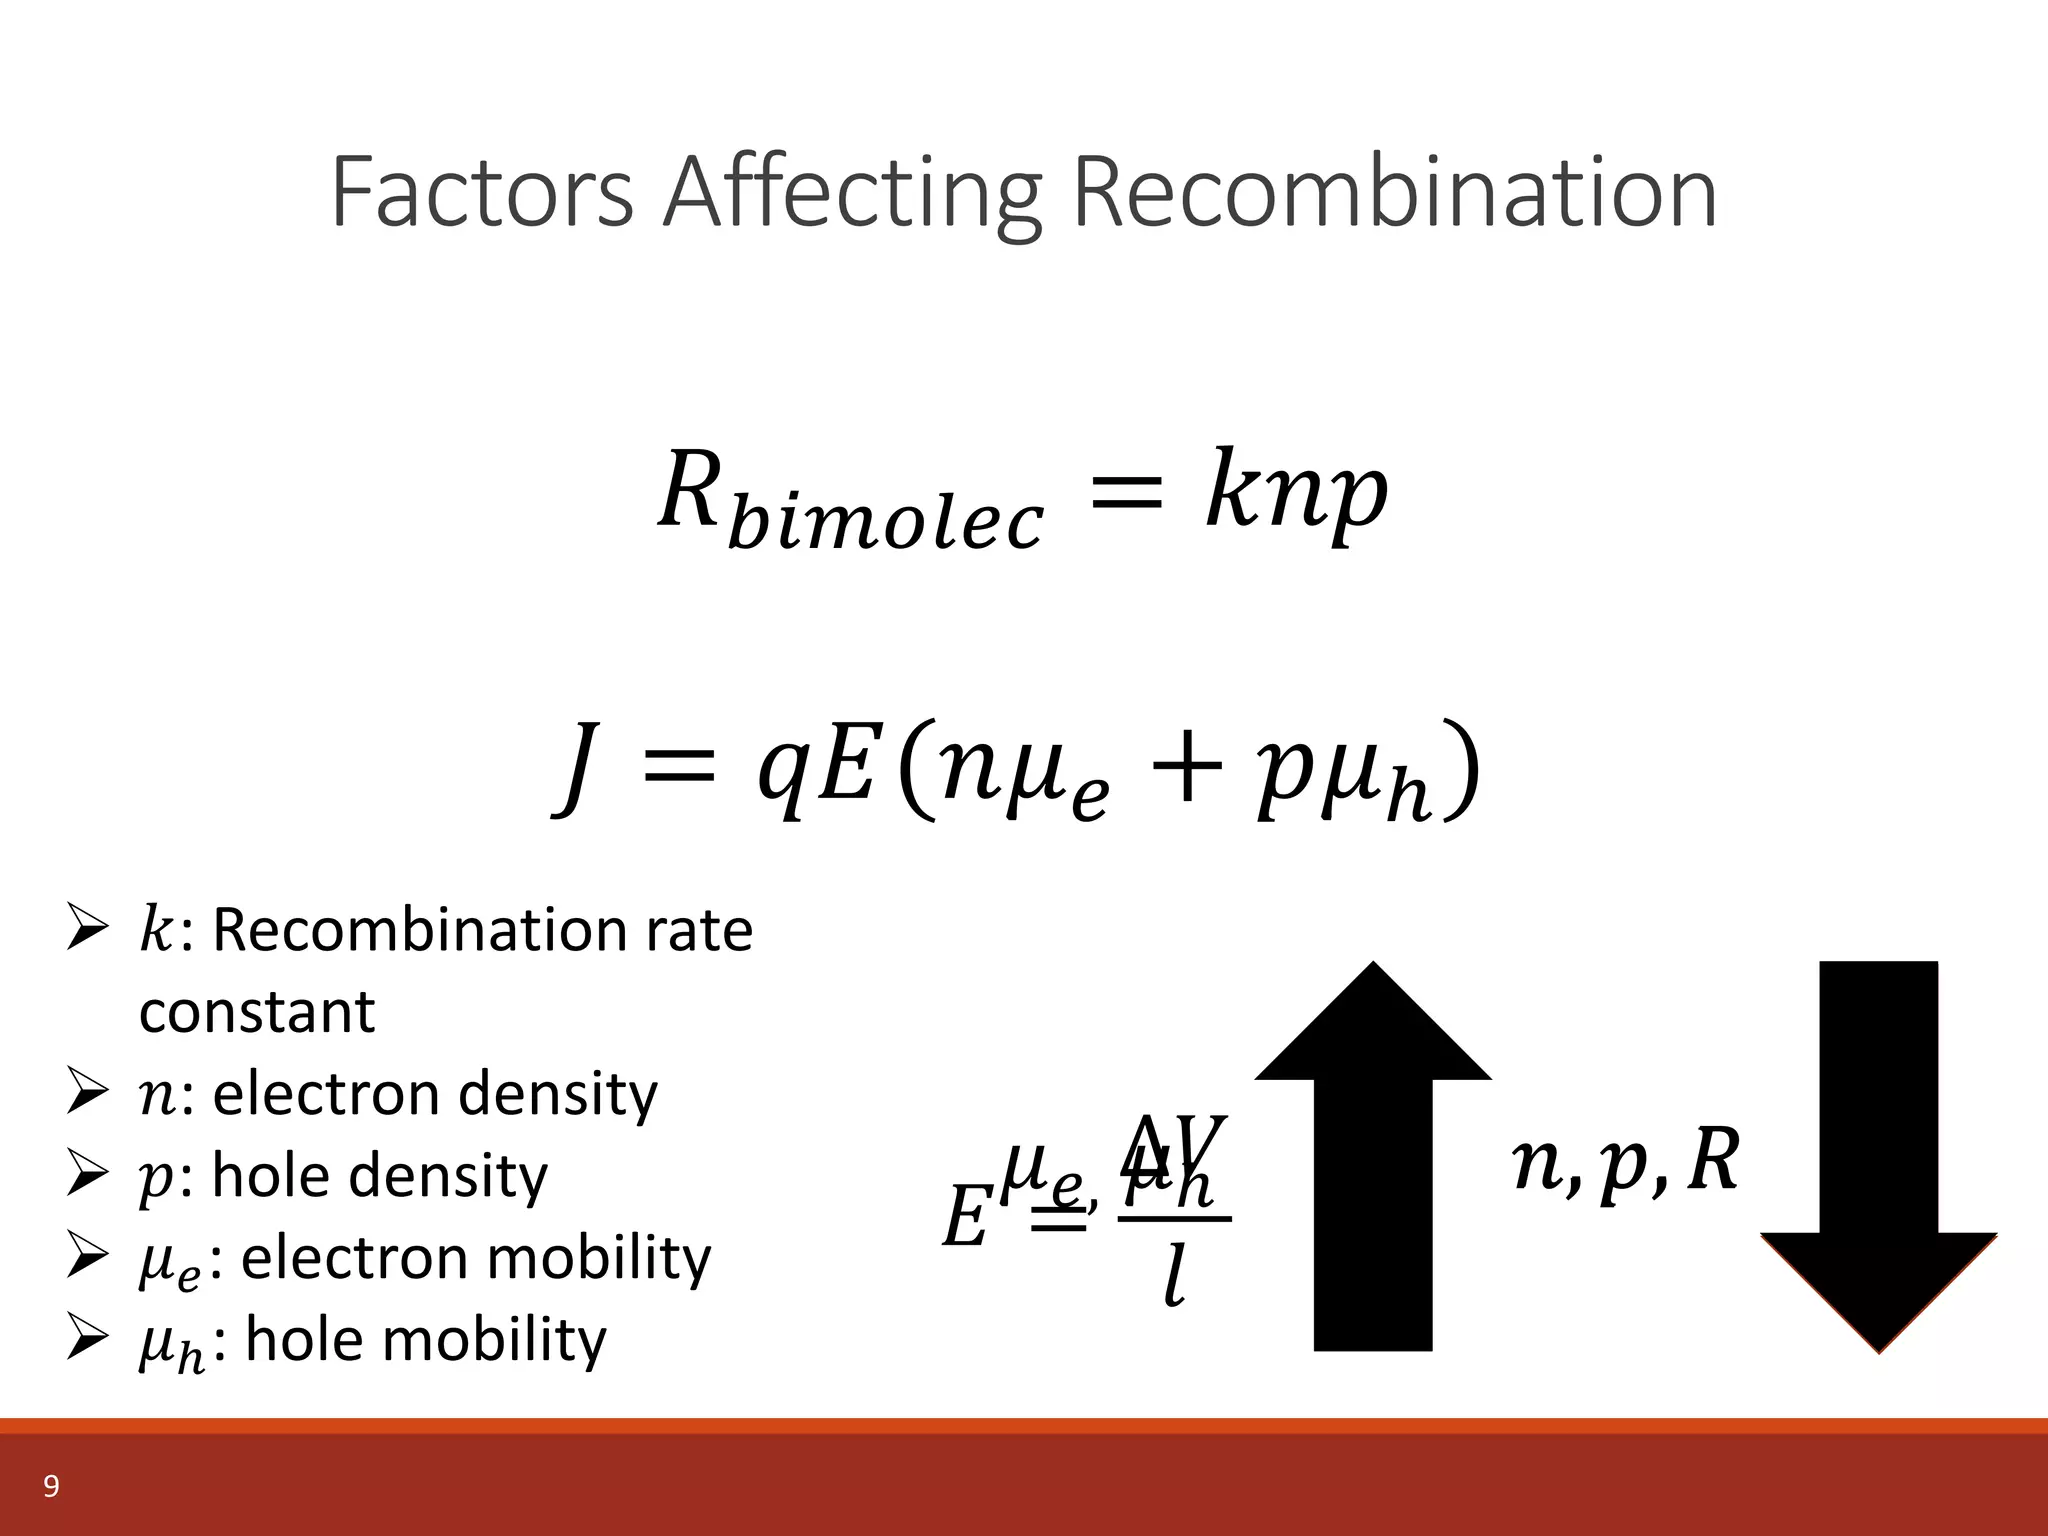
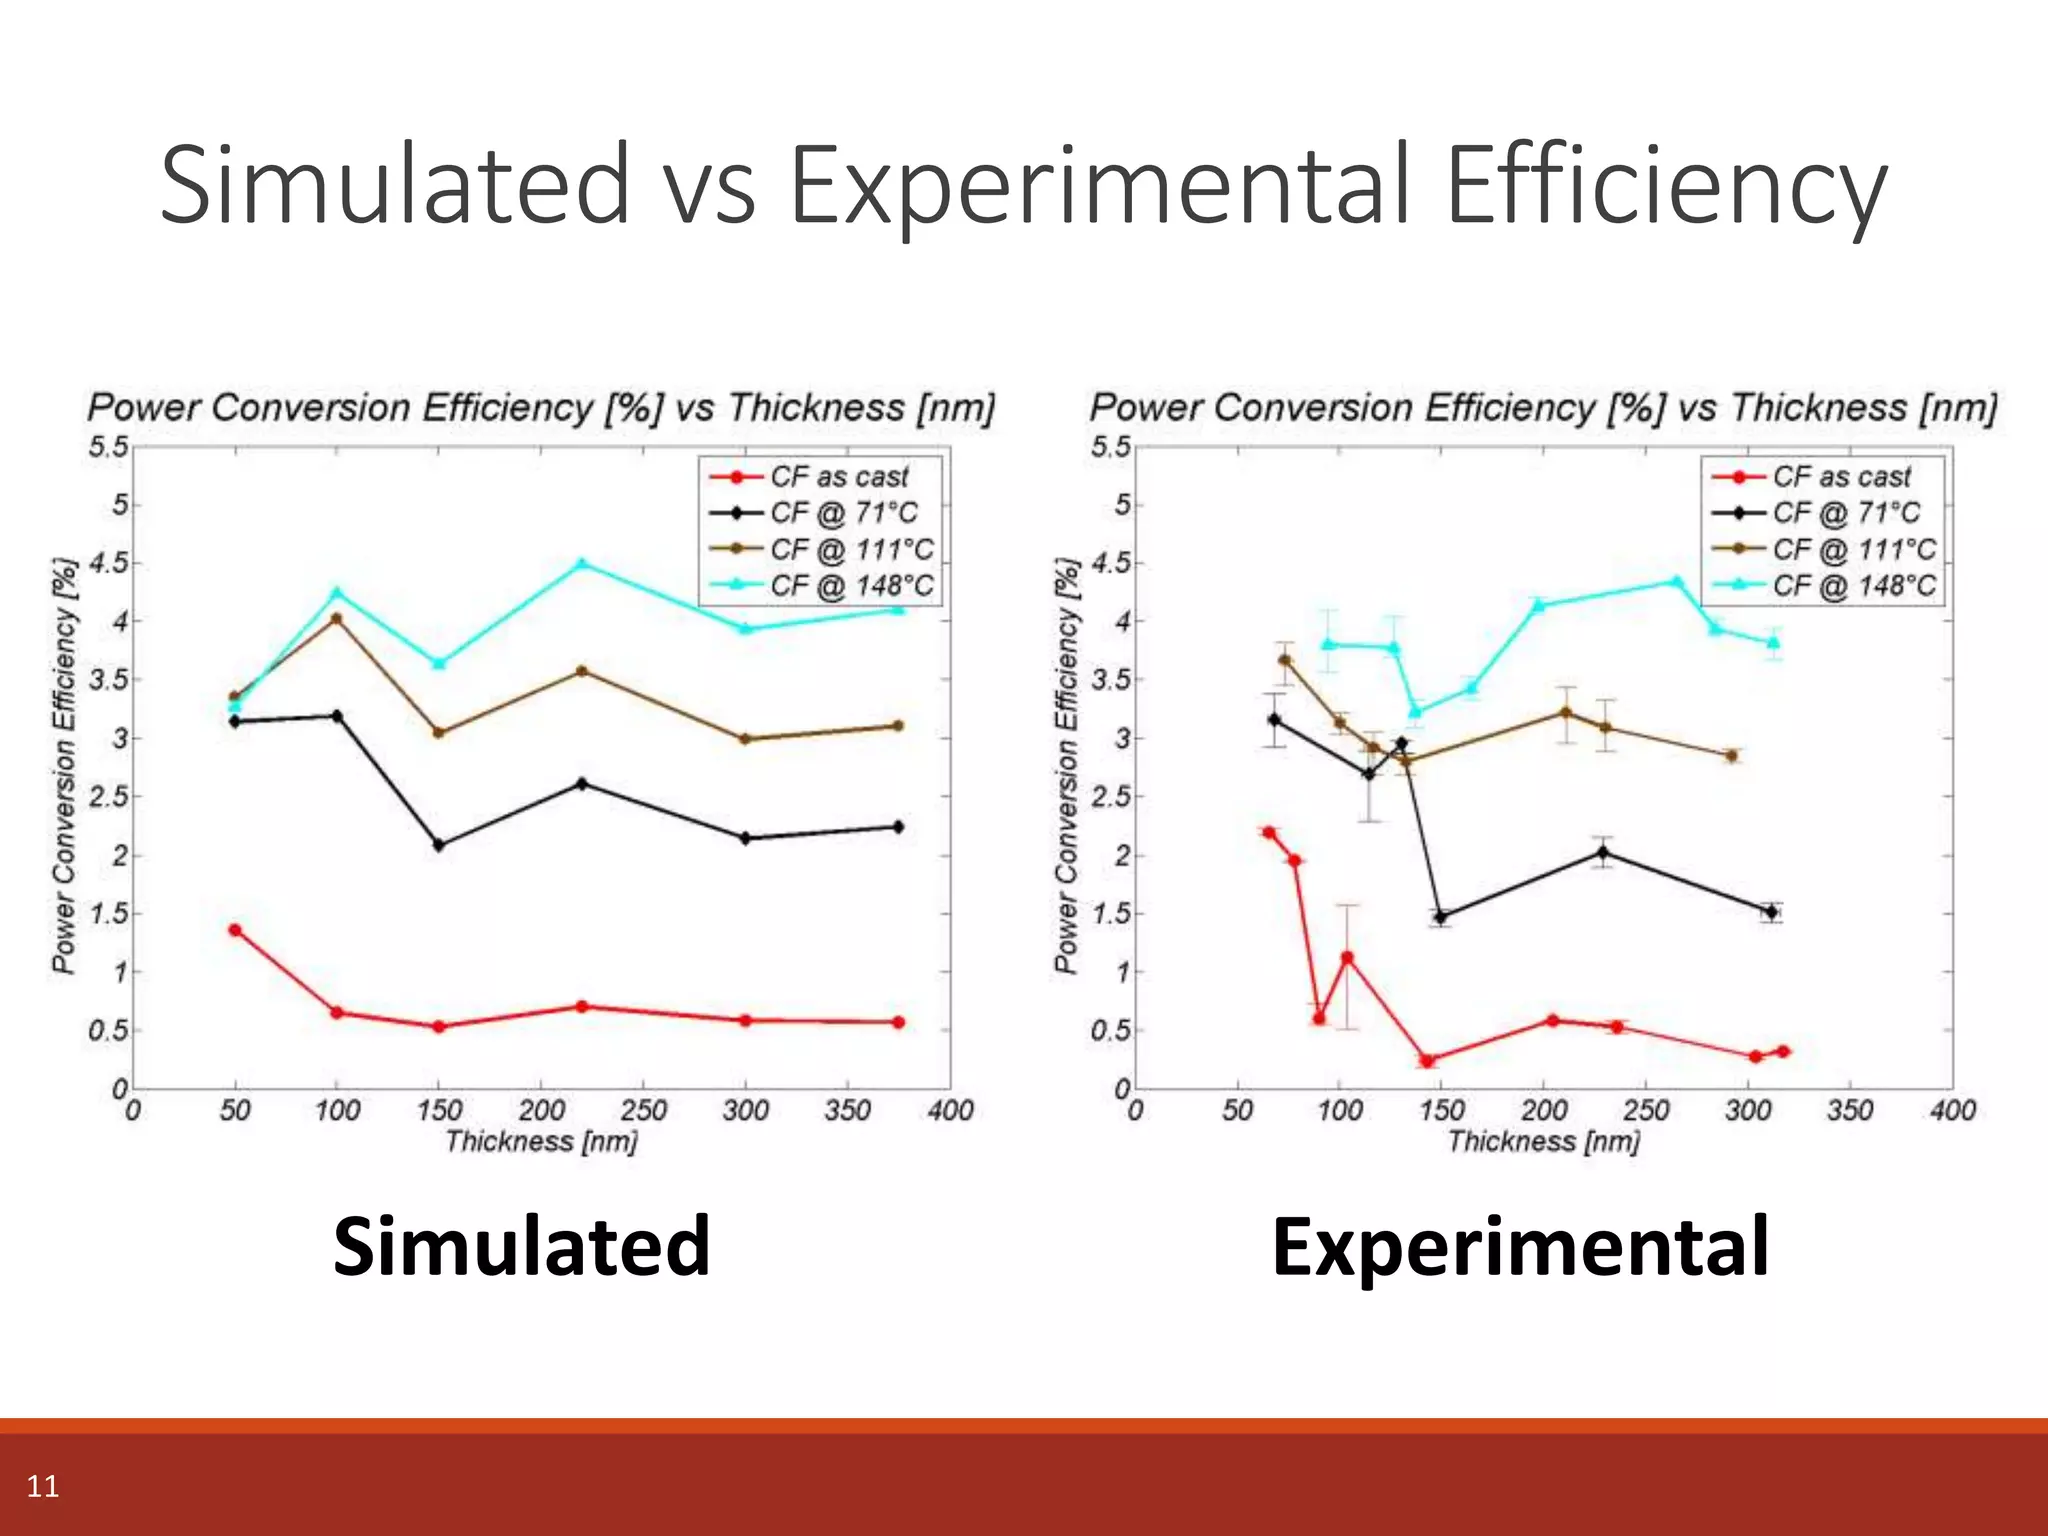
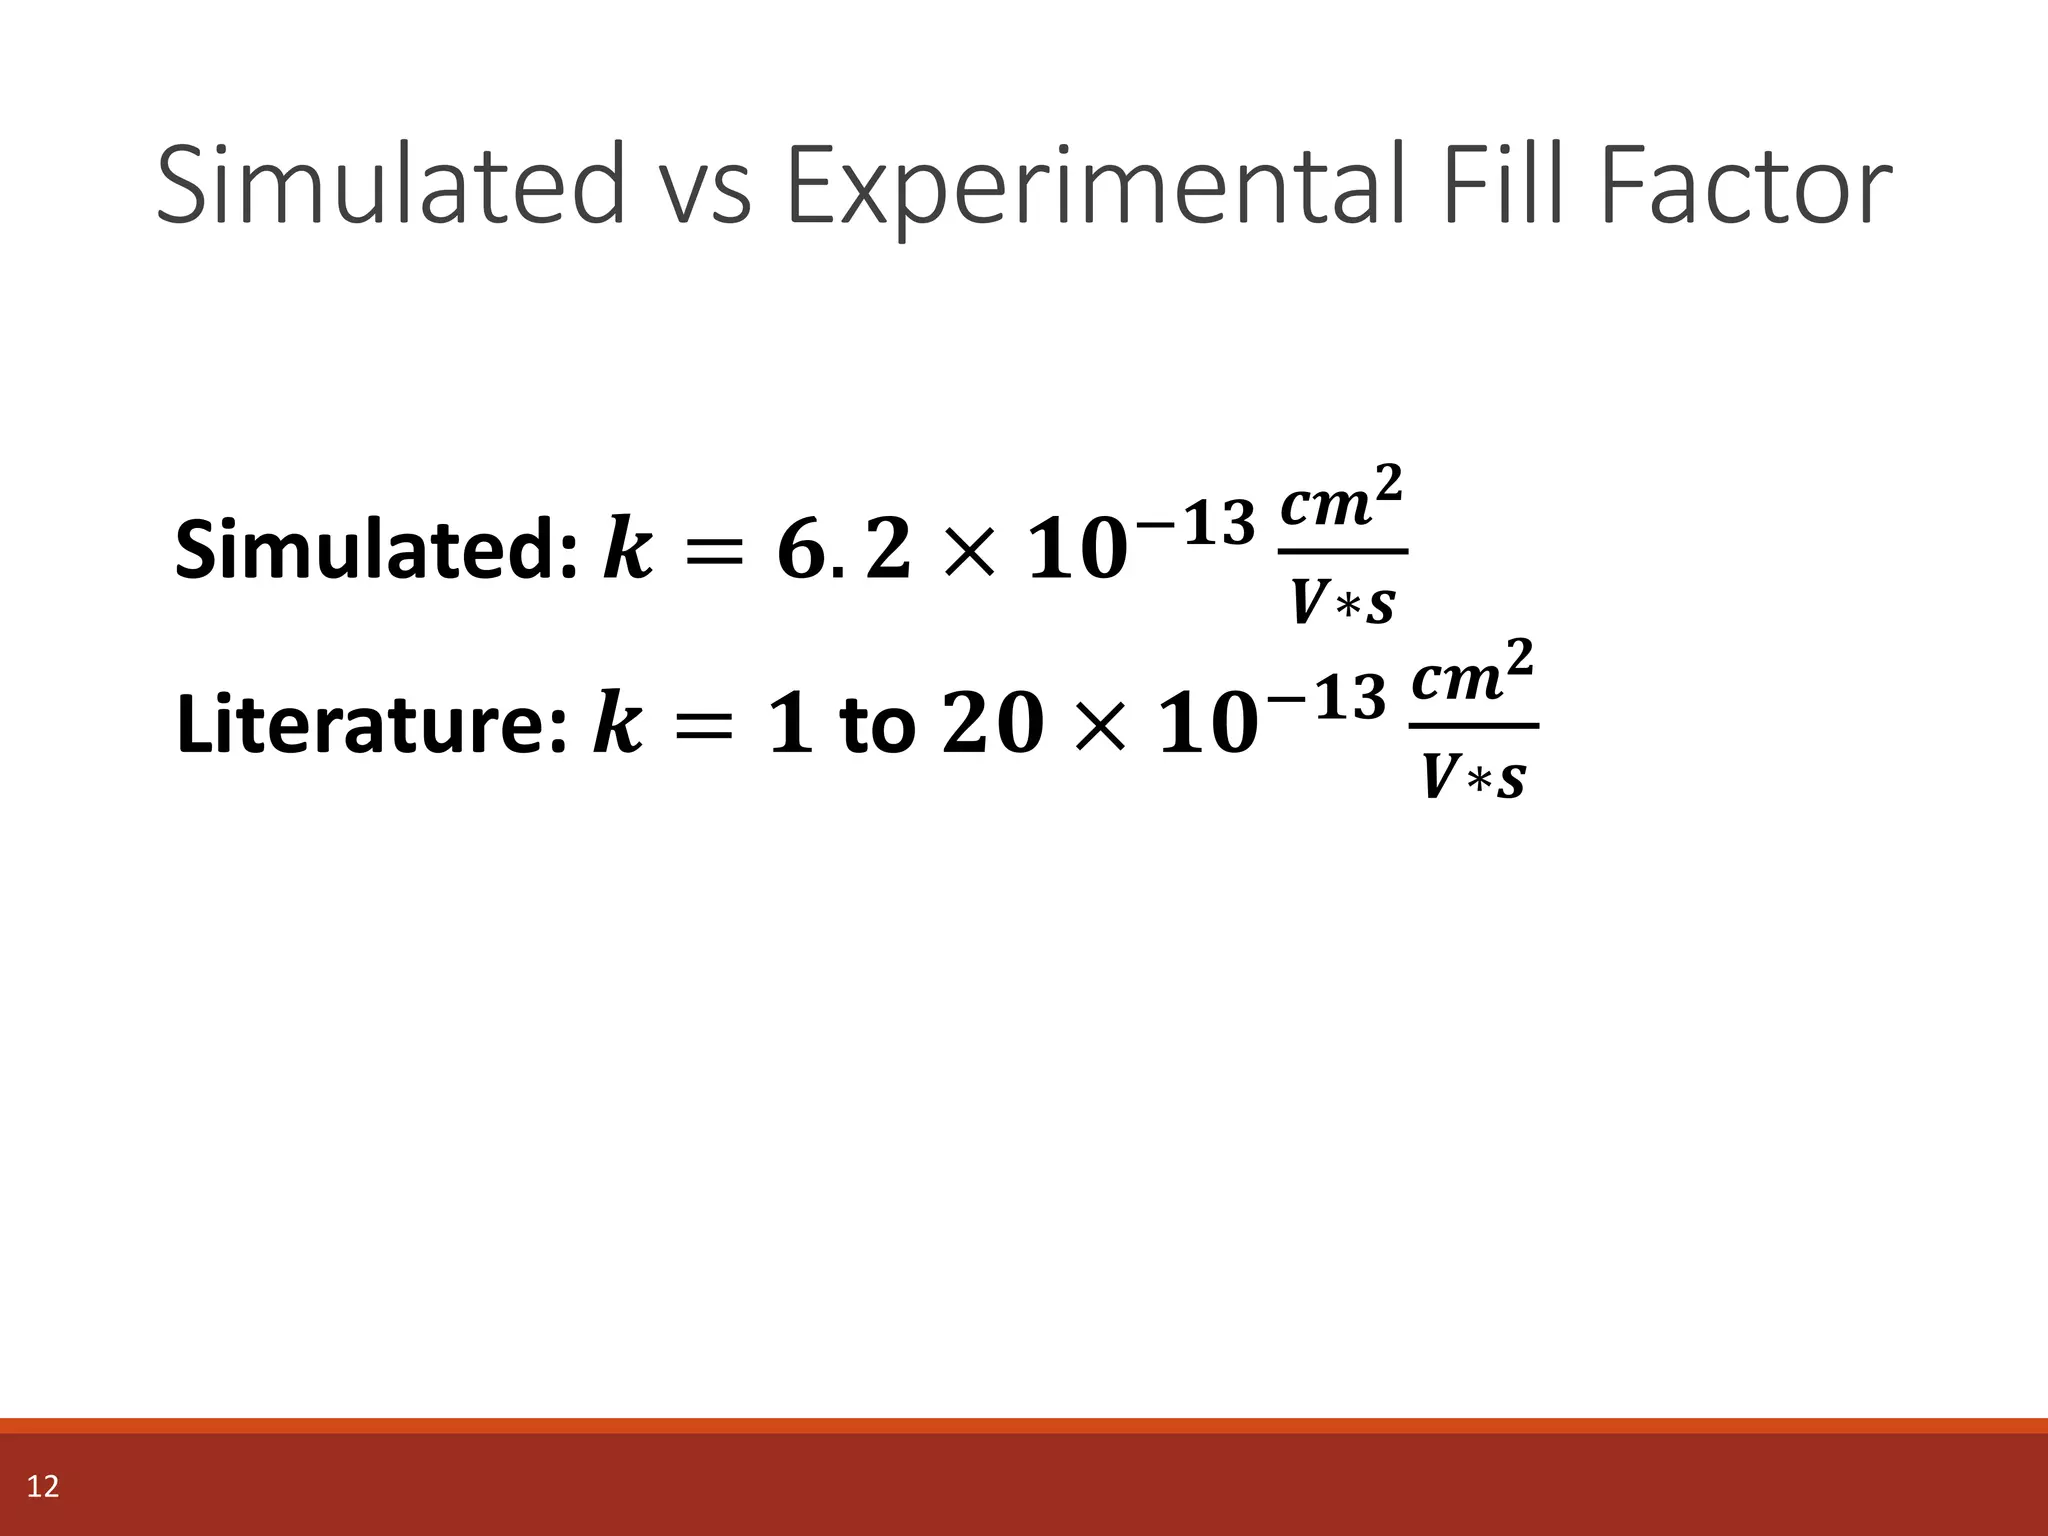
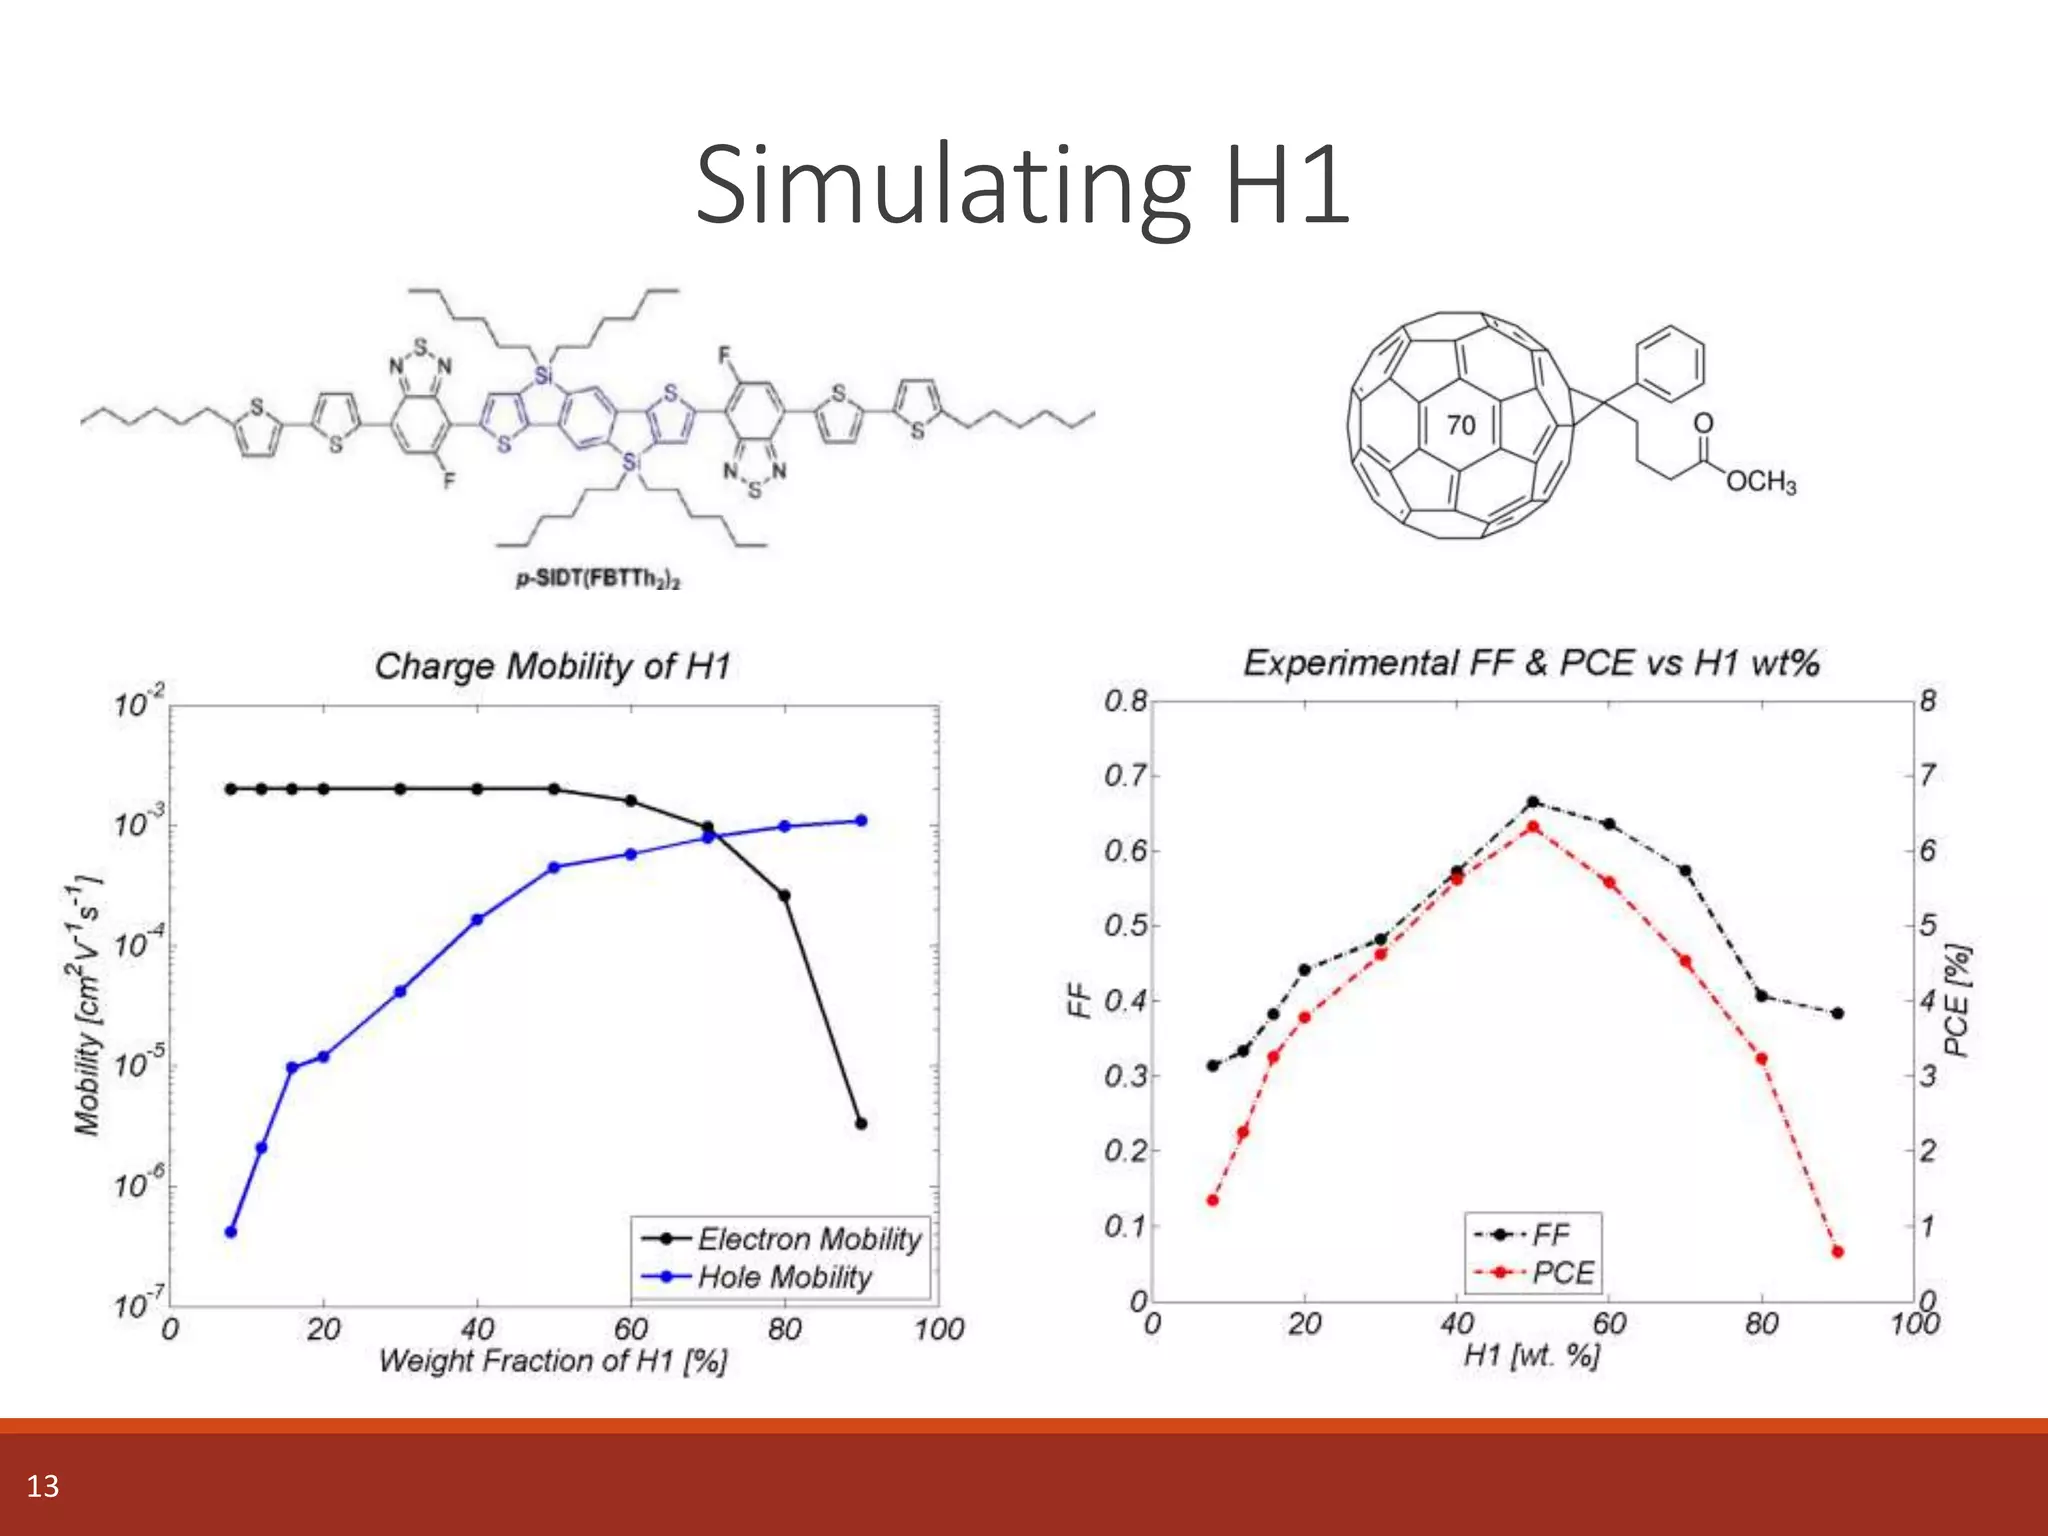
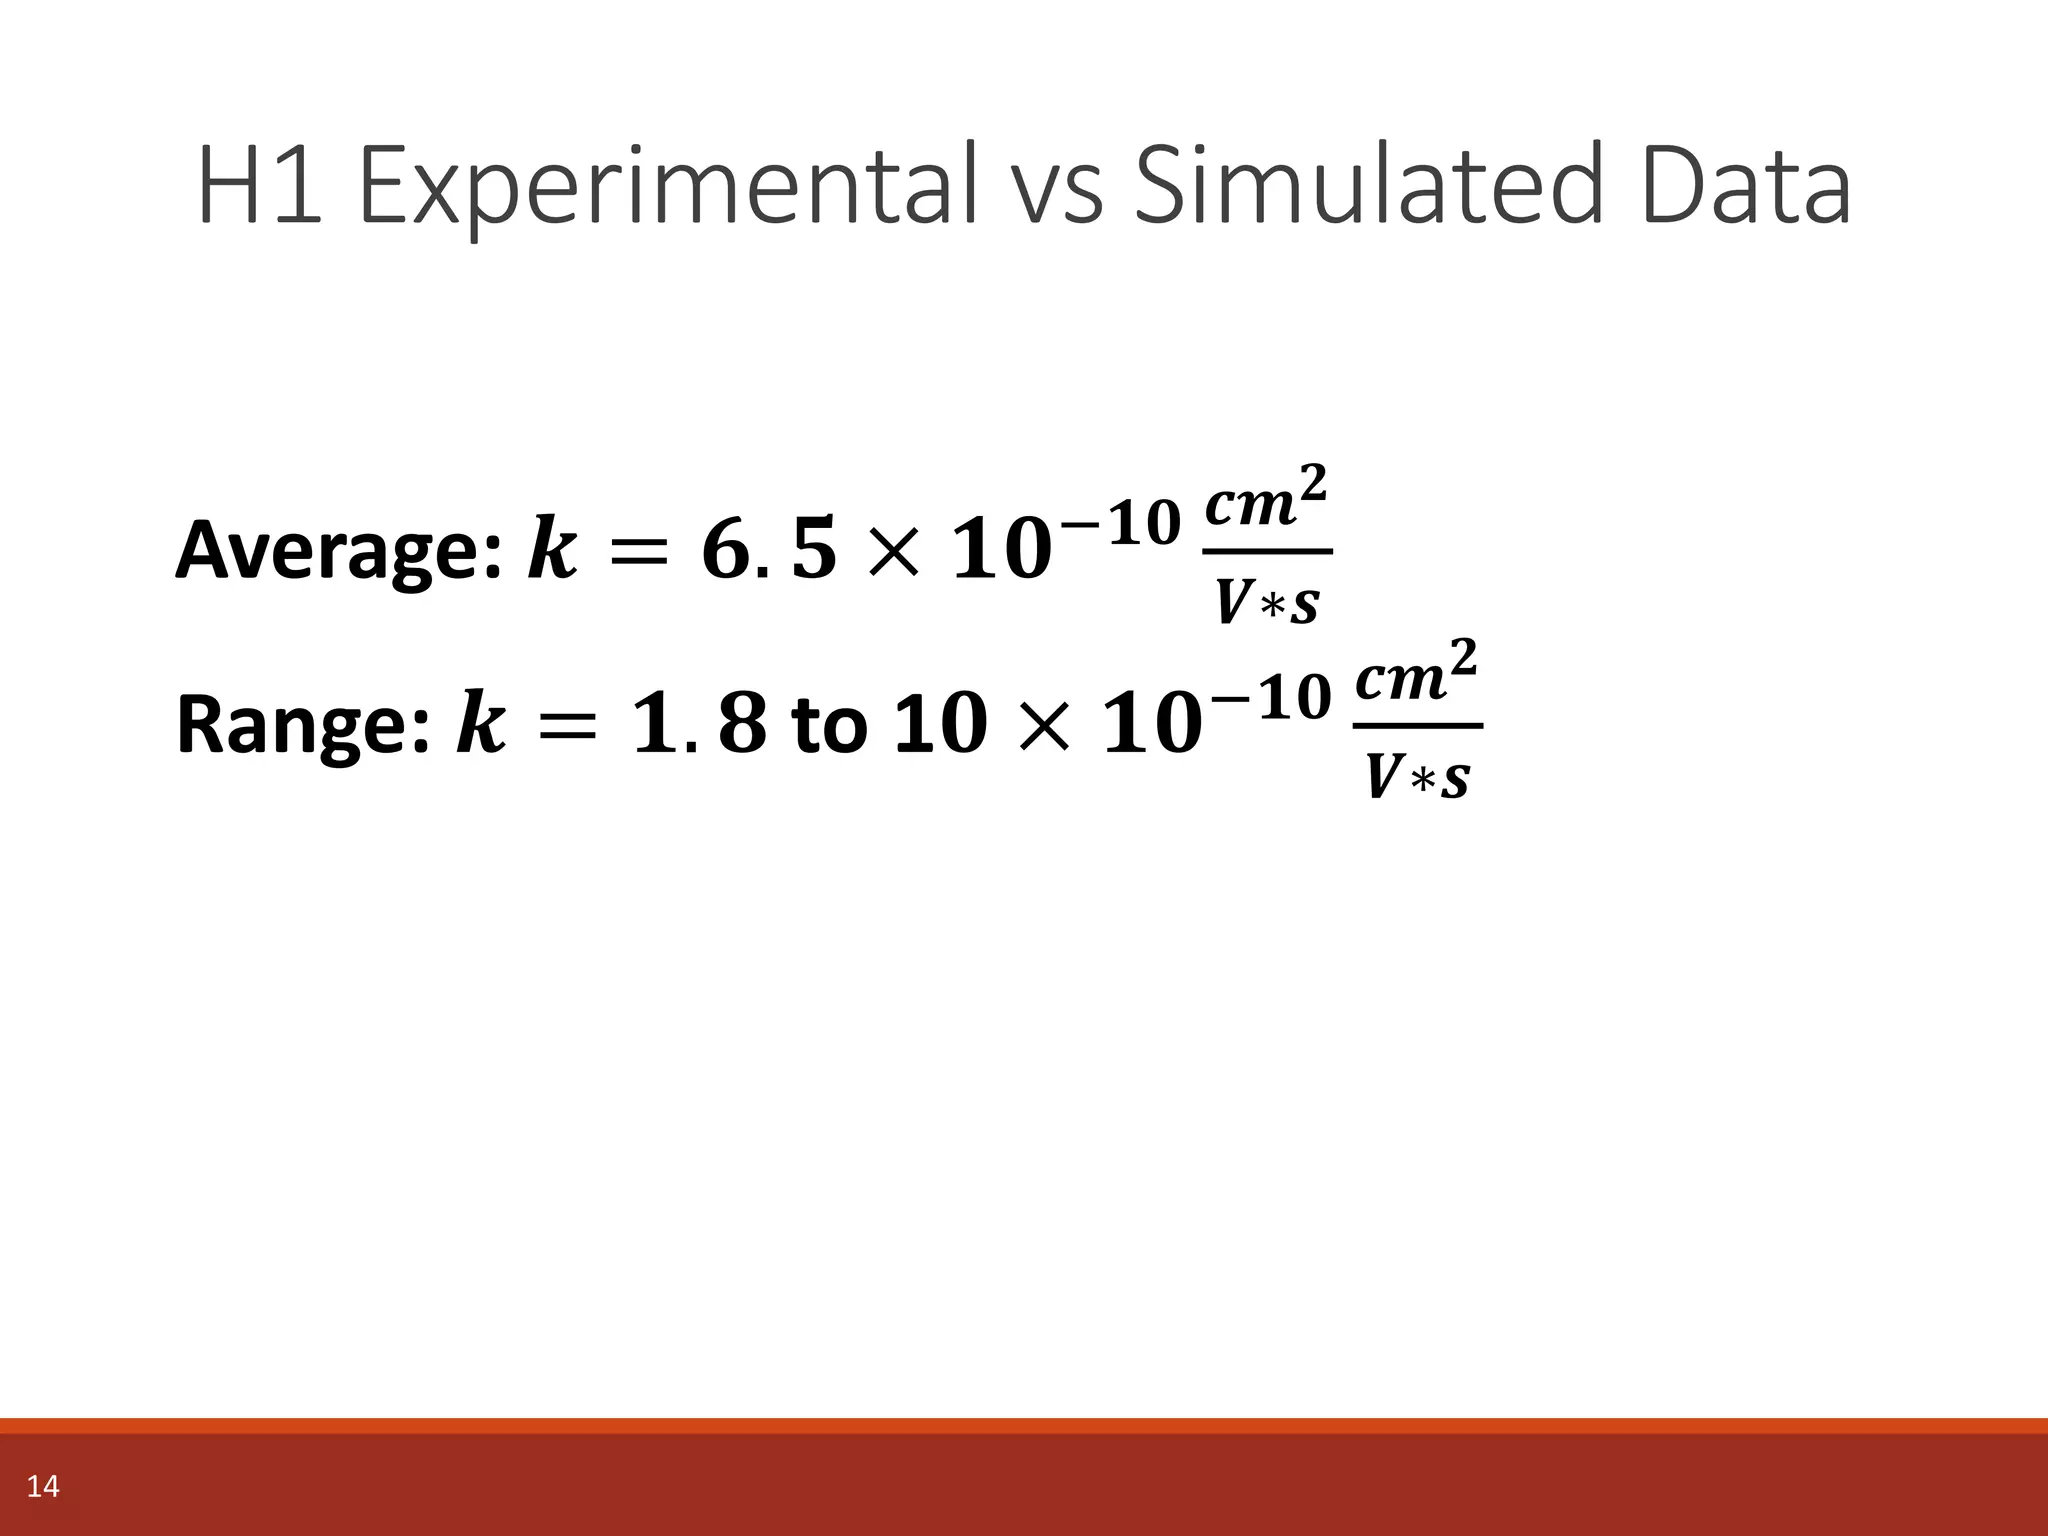
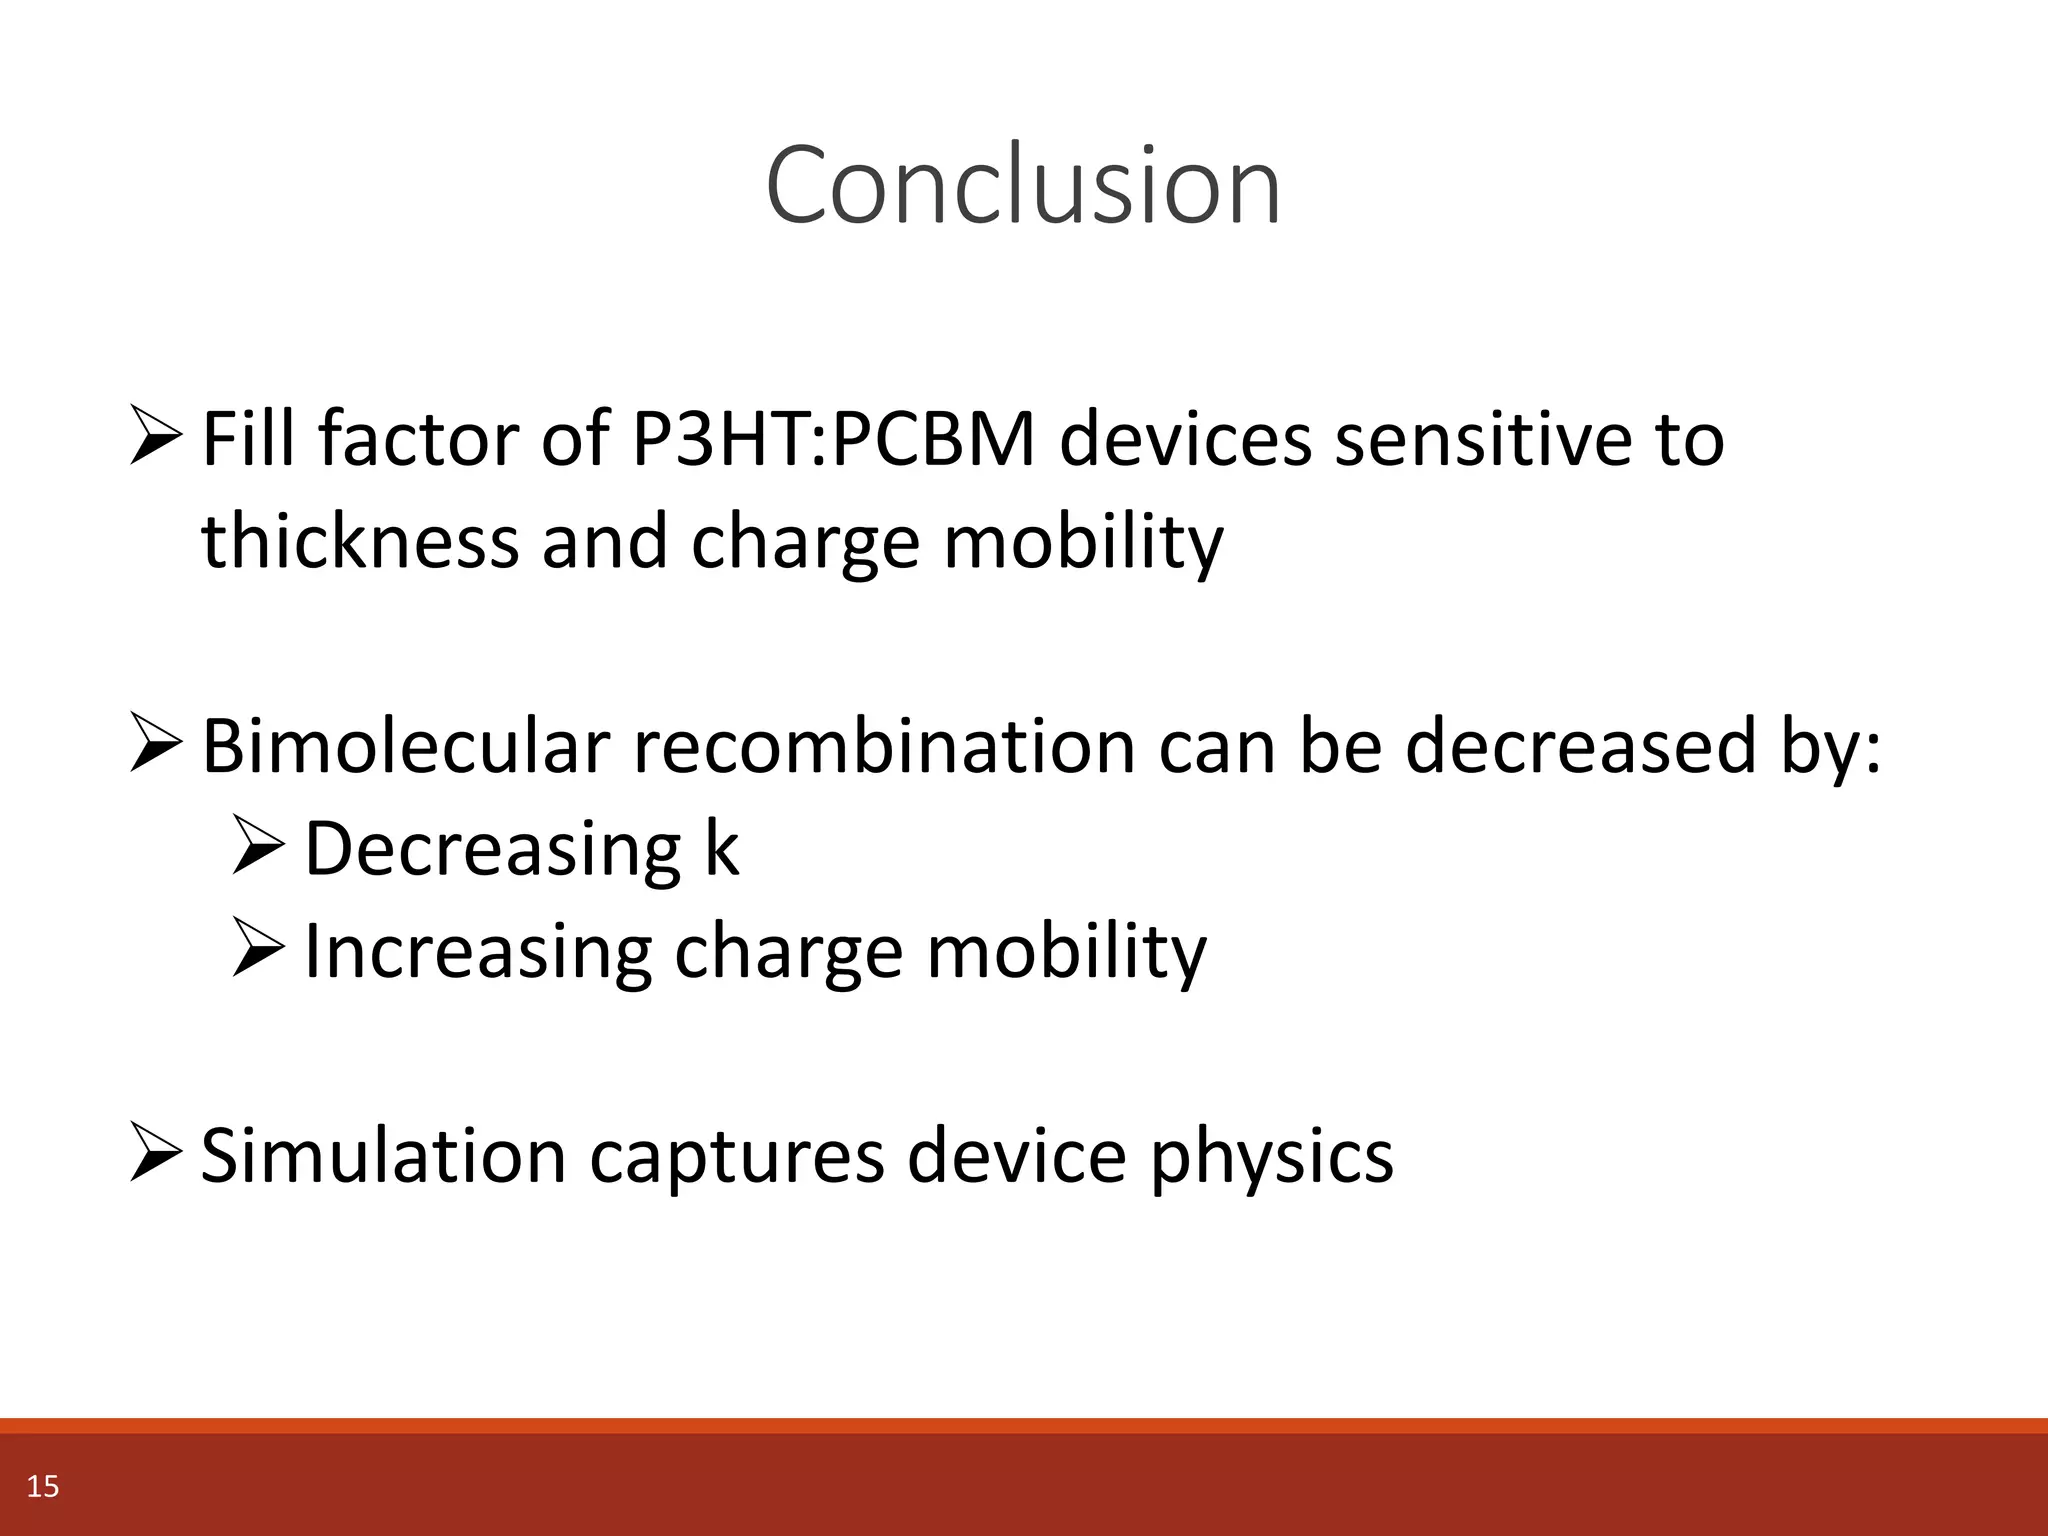
Understanding the Role of Charge
Mobility and Recombination in Organic
Photovoltaics
David Lam1
Advised by Professor Michael D. McGehee2
1. Department of Physics, Stanford University
2. Department of MaterialsScience and Engineering, Stanford University
May 18, 2015
EnergyConsumption[1015
BTU]
Year
Why Solar?
1
 Energy consumption increase
by 56% in 30 years1
 Ex: In 2003, 13.1 x 10¹⁵ BTU
used in U.S.2
 With 15% efficiency, only
need 100 km x 100 km
1. International Energy Outlook, U.S. EIA, 2013
2. Shaheen et al., MRS Bulletin, 2005
Why Organic Photovoltaics?
2 Image from popupcity.net, Solar Cells for Cheap, Cheap Soon
 Solution processed
 Low temperatures
 Inexpensive substrates
 Large-scale, wet-processing
production
 Blade-coating
 Roll-to-roll printing
Organic Photovoltaics Basics
3
Energy
Anode
Polymer
Fullerene
Cathode
1) Photon Absorption
2) Exciton Diffusion
3) Charge Transfer
4) Charge Drift
Exciton
+
-
+
-
Solar Cell Measurements
4
𝑉𝑜𝑐
𝑃𝑚𝑎𝑥
𝐽𝑠𝑐
 𝐸𝑄𝐸 =
𝐶ℎ𝑎𝑟𝑔𝑒 𝐸𝑥𝑡𝑟𝑎𝑐𝑡𝑒𝑑
𝑃ℎ𝑜𝑡𝑜𝑛𝑠 𝐼𝑛𝑐𝑖𝑑𝑒𝑛𝑡
OPV Goal #1: 90% EQE
OPV Goal #2: Thin (70-100 nm) ->
Thick (300 nm)
 𝐹𝐹 =
𝑃 𝑚𝑎𝑥
𝐽 𝑠𝑐∗𝑉𝑜𝑐
OPV Goal #3: 0.8 FF
 𝐽𝑠𝑐 : Current at short circuit
 𝐸𝑄𝐸 : External quantum
efficiency
 𝑉𝑜𝑐 : Voltage at open circuit
 𝑃𝑚𝑎𝑥 : Max power
 𝐹𝐹 : Fill factor
Research Questions
5
1) What causes poor fill factor in thick OPVs?
2) Can we use simulation to model device
physics?
P3HT:PCBM
6
PCBMP3HT
Mihailetchi et al., Adv. Funct. Mat., 2006
Fill Factor and Efficiency vs. Thickness
7
Recombination in P3HT:PCBM
8
𝑅 𝑏𝑖𝑚𝑜𝑙𝑒𝑐 = 𝑘𝑛𝑝
 𝑘: Recombination rate
constant
 𝑛: electron density
 𝑝: hole density
Factors Affecting Recombination
9
𝑅 𝑏𝑖𝑚𝑜𝑙𝑒𝑐 = 𝑘𝑛𝑝
𝐽 = 𝑞𝐸(𝑛𝜇 𝑒 + 𝑝𝜇ℎ)
𝜇 𝑒, 𝜇ℎ 𝑛, 𝑝, 𝑅
𝐸 =
Δ𝑉
𝑙
𝑛, 𝑝, 𝑅
 𝑘: Recombination rate
constant
 𝑛: electron density
 𝑝: hole density
 𝜇 𝑒: electron mobility
 𝜇ℎ: hole mobility
Why Simulation?
10
Glass
ITO
PEDOT:PSS
Ca/Al
Polymer:Fullerene Blend
(Active Layer)
 Measure:
 Electron, hole mobility
 Energy levels of
semiconductors
 Complex index of refraction
 Obtain:
 Recombination rate
constant
 Electrical and optical
profiles
Simulated vs Experimental Efficiency
11
Simulated Experimental
Simulated vs Experimental Fill Factor
12
Simulated Experimental
Simulated: 𝒌 = 𝟔. 𝟐 × 𝟏𝟎−𝟏𝟑 𝒄𝒎 𝟐
𝑽∗𝒔
Literature: 𝒌 = 𝟏 to 𝟐𝟎 × 𝟏𝟎−𝟏𝟑 𝒄𝒎 𝟐
𝑽∗𝒔
Simulating H1
13
H1 Experimental vs Simulated Data
14
Fill Factor Efficiency
Average: 𝒌 = 𝟔. 𝟓 × 𝟏𝟎−𝟏𝟎 𝒄𝒎 𝟐
𝑽∗𝒔
Range: 𝒌 = 𝟏. 𝟖 to 1𝟎 × 𝟏𝟎−𝟏𝟎 𝒄𝒎 𝟐
𝑽∗𝒔
Conclusion
15
Fill factor of P3HT:PCBM devices sensitive to
thickness and charge mobility
Bimolecular recombination can be decreased by:
Decreasing k
Increasing charge mobility
Simulation captures device physics
Acknowledgements
16
Acknowledgements
17
End
18
Langevin vs. Constant Recombination
19
𝑅 𝐿𝑎𝑛𝑔𝑒𝑣𝑖𝑛 = 𝛾
𝑞
𝜖0 𝜖 𝑟
𝜇 𝑒 + 𝜇ℎ 𝑛𝑝
𝑅 𝑐𝑜𝑛𝑠𝑡𝑎𝑛𝑡 = 𝑘𝑛𝑝
Seftos
20
𝑑𝐸 𝑥
𝑑𝑥
=
𝑞
𝜖 𝑟 𝜖0
[𝑝 𝑥 − 𝑛 𝑥 ]
𝐽𝑒 𝑥 = 𝑞𝜇 𝑒 𝑛 𝑥 𝐸 𝑥 + 𝐷 𝜇, 𝑇
𝑑𝑛 𝑥
𝑑𝑥
𝑑𝑛 𝑥
𝑑𝑡
=
1
𝑞
𝑑𝐽𝑒 𝑥
𝑑𝑥
− 𝑟𝑒𝑓𝑓 𝑟 𝑥 𝑝 𝑥 𝑛 𝑥 + 𝐺(𝑥)

FINAL Understanding the Role of Charge Mobility and Recombination

  • 1.
    Understanding the Roleof Charge Mobility and Recombination in Organic Photovoltaics David Lam1 Advised by Professor Michael D. McGehee2 1. Department of Physics, Stanford University 2. Department of MaterialsScience and Engineering, Stanford University May 18, 2015
  • 2.
    EnergyConsumption[1015 BTU] Year Why Solar? 1  Energyconsumption increase by 56% in 30 years1  Ex: In 2003, 13.1 x 10¹⁵ BTU used in U.S.2  With 15% efficiency, only need 100 km x 100 km 1. International Energy Outlook, U.S. EIA, 2013 2. Shaheen et al., MRS Bulletin, 2005
  • 3.
    Why Organic Photovoltaics? 2Image from popupcity.net, Solar Cells for Cheap, Cheap Soon  Solution processed  Low temperatures  Inexpensive substrates  Large-scale, wet-processing production  Blade-coating  Roll-to-roll printing
  • 4.
    Organic Photovoltaics Basics 3 Energy Anode Polymer Fullerene Cathode 1)Photon Absorption 2) Exciton Diffusion 3) Charge Transfer 4) Charge Drift Exciton + - + -
  • 5.
    Solar Cell Measurements 4 𝑉𝑜𝑐 𝑃𝑚𝑎𝑥 𝐽𝑠𝑐 𝐸𝑄𝐸 = 𝐶ℎ𝑎𝑟𝑔𝑒 𝐸𝑥𝑡𝑟𝑎𝑐𝑡𝑒𝑑 𝑃ℎ𝑜𝑡𝑜𝑛𝑠 𝐼𝑛𝑐𝑖𝑑𝑒𝑛𝑡 OPV Goal #1: 90% EQE OPV Goal #2: Thin (70-100 nm) -> Thick (300 nm)  𝐹𝐹 = 𝑃 𝑚𝑎𝑥 𝐽 𝑠𝑐∗𝑉𝑜𝑐 OPV Goal #3: 0.8 FF  𝐽𝑠𝑐 : Current at short circuit  𝐸𝑄𝐸 : External quantum efficiency  𝑉𝑜𝑐 : Voltage at open circuit  𝑃𝑚𝑎𝑥 : Max power  𝐹𝐹 : Fill factor
  • 6.
    Research Questions 5 1) Whatcauses poor fill factor in thick OPVs? 2) Can we use simulation to model device physics?
  • 7.
  • 8.
    Fill Factor andEfficiency vs. Thickness 7
  • 9.
    Recombination in P3HT:PCBM 8 𝑅𝑏𝑖𝑚𝑜𝑙𝑒𝑐 = 𝑘𝑛𝑝  𝑘: Recombination rate constant  𝑛: electron density  𝑝: hole density
  • 10.
    Factors Affecting Recombination 9 𝑅𝑏𝑖𝑚𝑜𝑙𝑒𝑐 = 𝑘𝑛𝑝 𝐽 = 𝑞𝐸(𝑛𝜇 𝑒 + 𝑝𝜇ℎ) 𝜇 𝑒, 𝜇ℎ 𝑛, 𝑝, 𝑅 𝐸 = Δ𝑉 𝑙 𝑛, 𝑝, 𝑅  𝑘: Recombination rate constant  𝑛: electron density  𝑝: hole density  𝜇 𝑒: electron mobility  𝜇ℎ: hole mobility
  • 11.
    Why Simulation? 10 Glass ITO PEDOT:PSS Ca/Al Polymer:Fullerene Blend (ActiveLayer)  Measure:  Electron, hole mobility  Energy levels of semiconductors  Complex index of refraction  Obtain:  Recombination rate constant  Electrical and optical profiles
  • 12.
    Simulated vs ExperimentalEfficiency 11 Simulated Experimental
  • 13.
    Simulated vs ExperimentalFill Factor 12 Simulated Experimental Simulated: 𝒌 = 𝟔. 𝟐 × 𝟏𝟎−𝟏𝟑 𝒄𝒎 𝟐 𝑽∗𝒔 Literature: 𝒌 = 𝟏 to 𝟐𝟎 × 𝟏𝟎−𝟏𝟑 𝒄𝒎 𝟐 𝑽∗𝒔
  • 14.
  • 15.
    H1 Experimental vsSimulated Data 14 Fill Factor Efficiency Average: 𝒌 = 𝟔. 𝟓 × 𝟏𝟎−𝟏𝟎 𝒄𝒎 𝟐 𝑽∗𝒔 Range: 𝒌 = 𝟏. 𝟖 to 1𝟎 × 𝟏𝟎−𝟏𝟎 𝒄𝒎 𝟐 𝑽∗𝒔
  • 16.
    Conclusion 15 Fill factor ofP3HT:PCBM devices sensitive to thickness and charge mobility Bimolecular recombination can be decreased by: Decreasing k Increasing charge mobility Simulation captures device physics
  • 17.
  • 18.
  • 19.
  • 20.
    Langevin vs. ConstantRecombination 19 𝑅 𝐿𝑎𝑛𝑔𝑒𝑣𝑖𝑛 = 𝛾 𝑞 𝜖0 𝜖 𝑟 𝜇 𝑒 + 𝜇ℎ 𝑛𝑝 𝑅 𝑐𝑜𝑛𝑠𝑡𝑎𝑛𝑡 = 𝑘𝑛𝑝
  • 21.
    Seftos 20 𝑑𝐸 𝑥 𝑑𝑥 = 𝑞 𝜖 𝑟𝜖0 [𝑝 𝑥 − 𝑛 𝑥 ] 𝐽𝑒 𝑥 = 𝑞𝜇 𝑒 𝑛 𝑥 𝐸 𝑥 + 𝐷 𝜇, 𝑇 𝑑𝑛 𝑥 𝑑𝑥 𝑑𝑛 𝑥 𝑑𝑡 = 1 𝑞 𝑑𝐽𝑒 𝑥 𝑑𝑥 − 𝑟𝑒𝑓𝑓 𝑟 𝑥 𝑝 𝑥 𝑛 𝑥 + 𝐺(𝑥)

Editor's Notes

  • #3 Rising energy usage Solar good avenue Example OECD: Organization for Economic Cooperation and Development
  • #4 Inorganic PVs bad because of costly purification OPVs good because solution processed Inexpensive, large scale production
  • #5 Photon absorption: polymer absorbs a photon, which excites an electron. Creates ehp, which is tightly bound due to low dielectric constant in OSC Diffusion Diffuses to heterojunction CT Energy difference splits the Exciton Charge Drift Difference in wf of contacts leads to built in electric field Sweeps out charge carriers to contacts for collection Talk about recombination
  • #6 EQE Related to Jsc, affected by absorption and extraction. Higher charge mobility should mean better extraction. Thicker samples should mean more absorption. FF affects the max power, higher FF means higher P. FF affected by recombination Goals to hit PCE of 15%: 90% EQE (high!) Increase thickness Optimized at 70-100 nm, but if we increase to 300 nm (thick active layer), absorbs all light 0.8 FF (high!) FF decreases when we make devices thicker! Actually hurts performance Why? Note: Pick 90% eqe because ITO para absorb, 0.8 FF because highest recorded
  • #7 How can we improve performance? What causes poor FF? We think it’s recombination and charge mobility. Can we simulate this?
  • #8 P3HT conjugated polymer, light absorber, electron donor PCBM fullerene C60 derivative, electron acceptor Vary charge mobility of P3HT:PCBM by annealing devices
  • #9 Low temperatures: 25 C uniformly low before 100 nm, then shoots up above 100 nm Intermediate temp: 71 C FF low initially, then shoots up around 150 nm 111 C FF starts off higher and rises Both approach same FF at 60 nm High Temp: Constant at 0.7 FF
  • #10 To figure out what kind of recombination in our devices Bimolecular is k -> constant, n and p, electron and hole density Bimolecular recombination dependent on light intensity squared We see fill factor go up as a fcn of light intensity
  • #11 Combine bimolecular recombination expression with current expression If we maintain same J (good approx. since Jsc is same order of magnitude): Increase charge mobility N, p must decrease to balance out the products. R decreases Decrease thickness means increase in E field Again, n p must decrease to balance out the sum. R decreases.
  • #12 Inorganic PVs have many simulators that augment research Allows them to determine performance from measured quantities OPVs don’t have as many simulators because of complicated heterojunctions -> Effective medium? Measure then obtain Focus on k
  • #13 Compare trends Captures device physics!
  • #14 Compare FF trends. Also agrees! One important thing to note is that simulated predicts 0.8 FF for intermediate and high temp: pinholes shunt resistance hurt experimental performance Compare simulated and literature k
  • #15 Double check by simulating another system: H1: Small molecule PCBM fullerene Vary weight fraction of H1 to change charge mobility. Experimental data shown on right. Max FF of 0.7
  • #16 Comparing FF and efficiency: for the most part, they agree. Compare average k and range of k. They fall within same order of magnitude.
  • #18 Acknowledge VPUE Major Grant
  • #20 Alex: Have the whole phrase on slide 4 and 9 Talk slower Black on Brown No white covering graphs Don’t say you’re done at the end