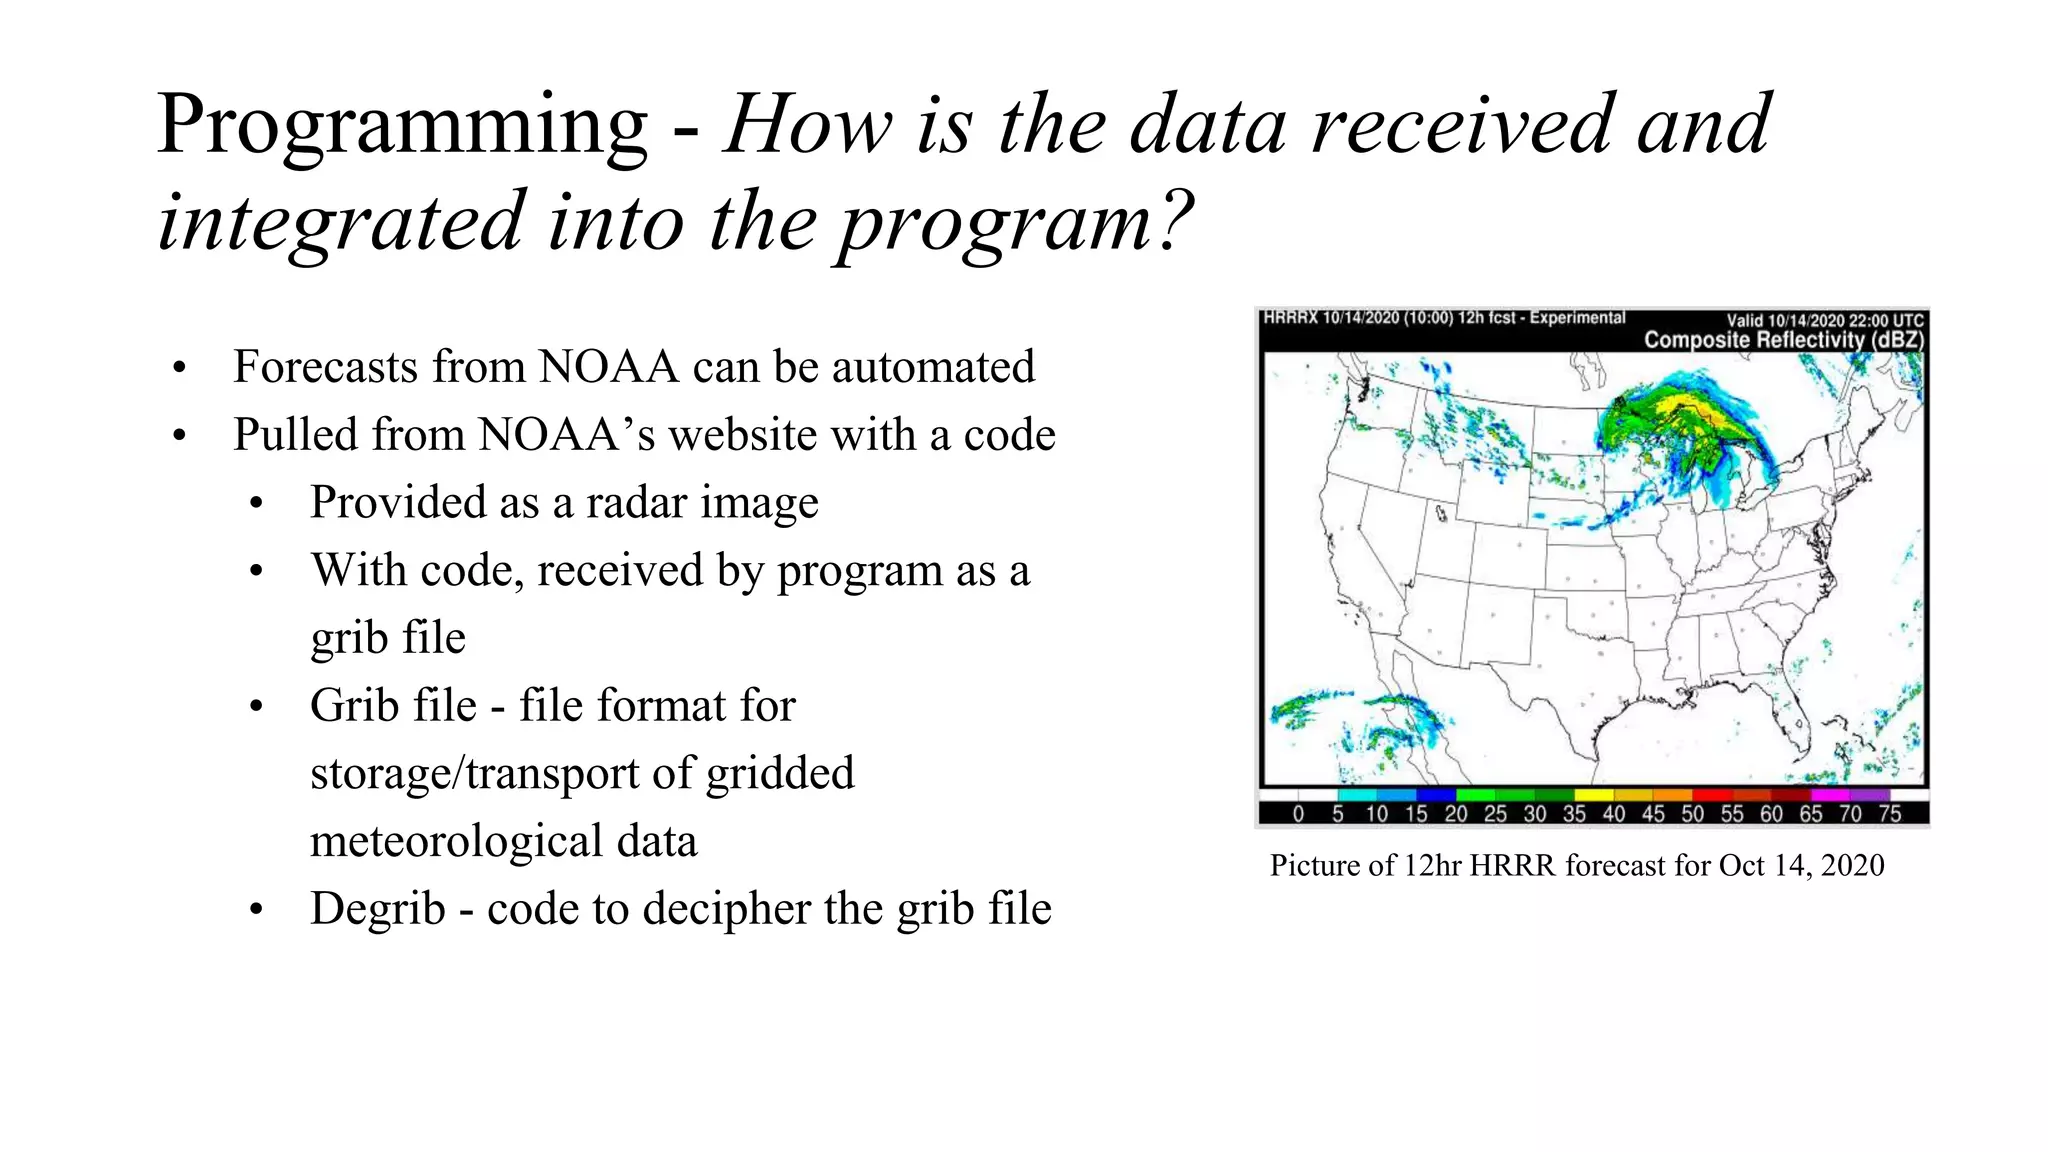
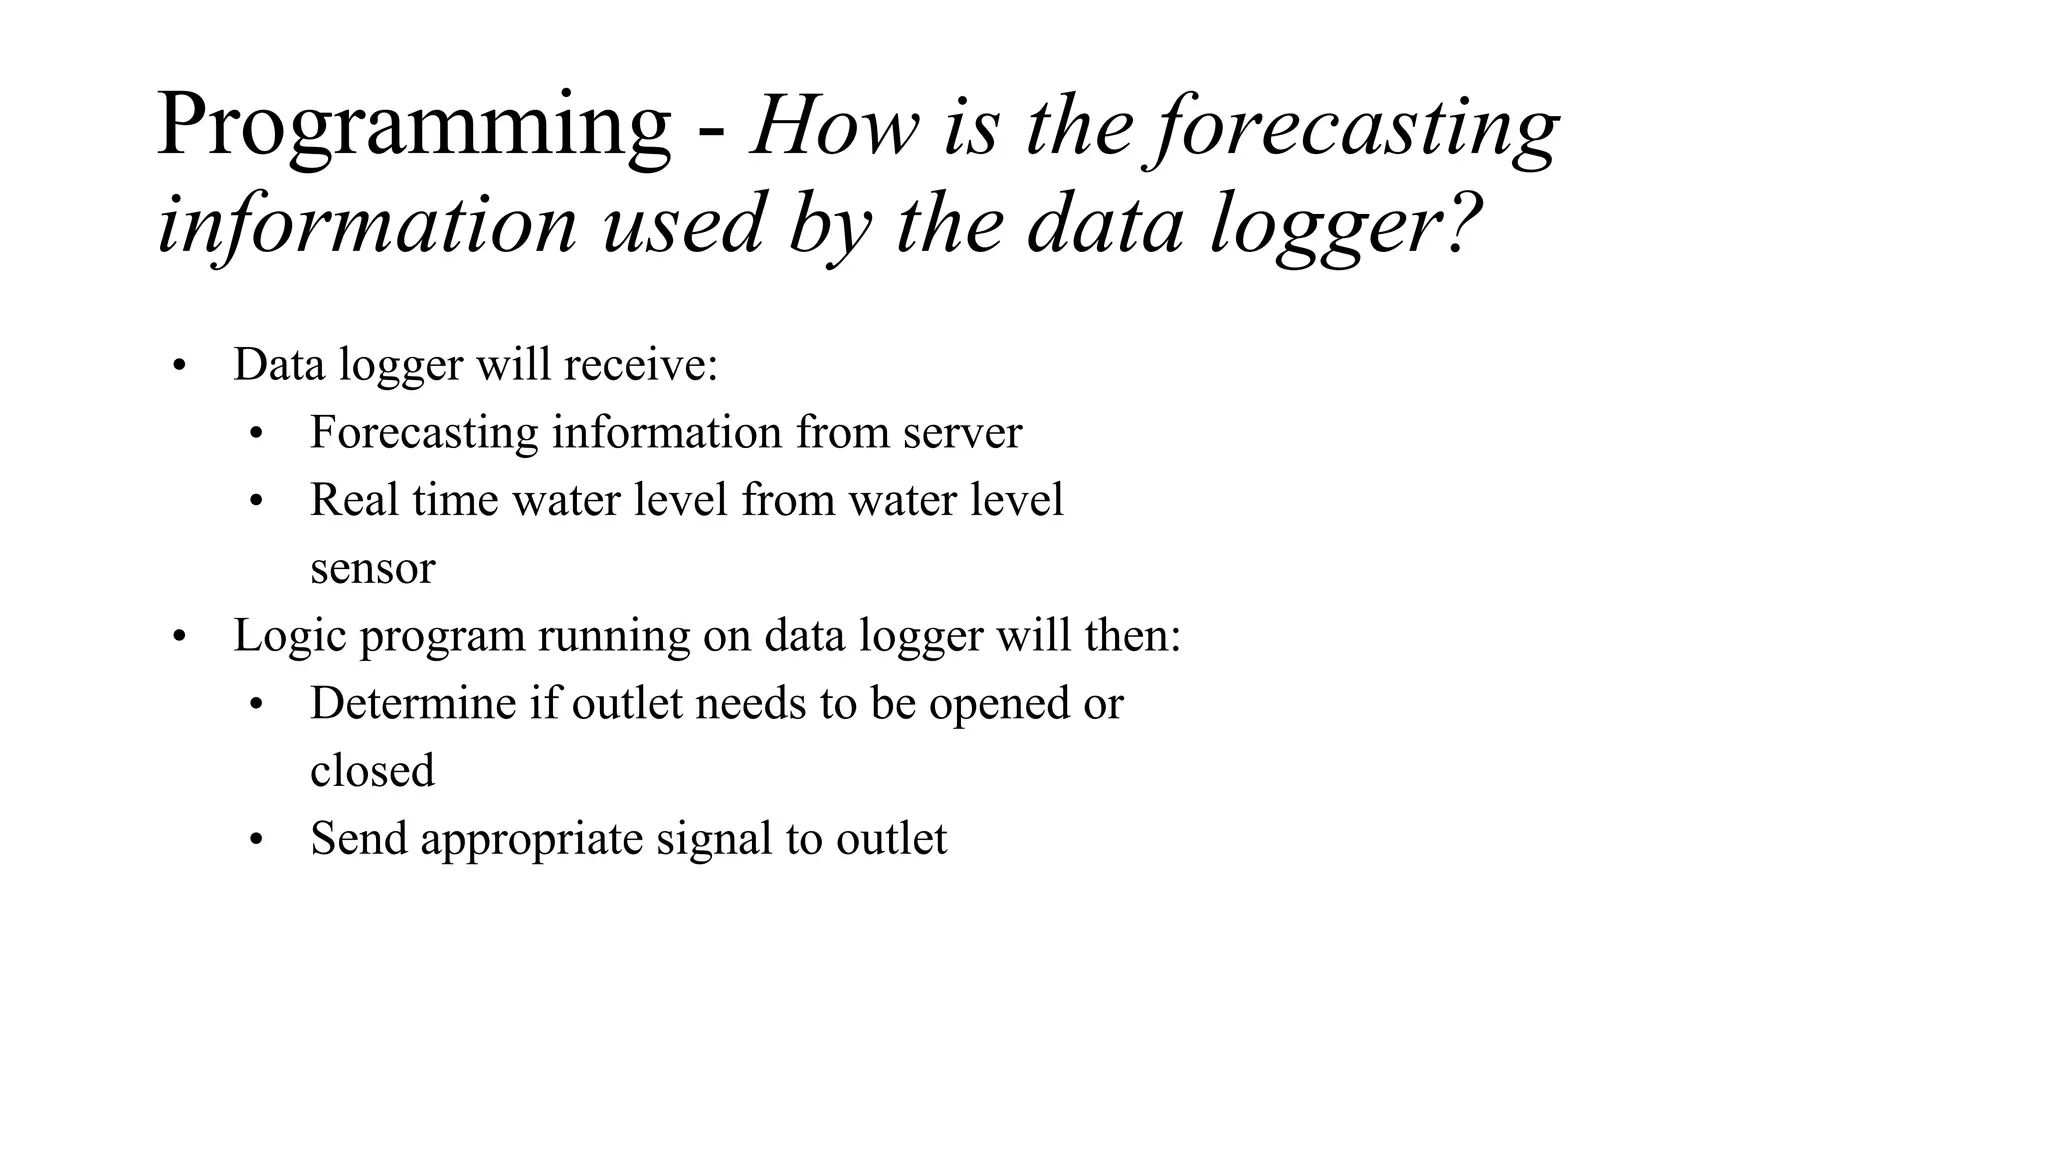
This document outlines the design of an active control outlet for a stormwater drainage basin in Pelzer, SC. It discusses the background and rationale for using an active control outlet, which can adjust based on weather forecasts and pond water levels, compared to a static outlet. The objectives are to design and evaluate the impact of the active control outlet on water quality and quantity. Approaches include literature review, data collection, modeling, and design of the control structure. Instrumentation options and programming logic for integrating weather forecasts from NOAA into controlling the outlet are also covered.
The document outlines the design of an active control outlet for a stormwater drainage basin in Pelzer, South Carolina. It discusses the background and rationale for the project, which is to improve stormwater management through an adjustable outlet that can be opened, partially opened, or closed based on weather forecasts and pond water levels. This aims to maximize pollutant retention time and better mimic pre-development flow conditions. The document reviews programming approaches to retrieve weather forecast data and integrate it into the control logic to adjust the outlet in real-time.
This document outlines the design of an active control outlet for a stormwater drainage basin. It provides background on climate change, increasing impervious surfaces, and the rationale for small-scale stormwater solutions. Traditional static outlets are discussed alongside the potential benefits of active control outlets, which can adjust outlet conditions based on factors like weather forecasts and pond water levels. The objective, approaches, deliverables, timeline, and materials/methods are presented for a project to design and evaluate an adaptive control structure for a pond in Pelzer, SC. Literature on programming, instrumentation, and regulations is also reviewed.
This document provides guidance on how to carry out secondary validation of water level data. It discusses comparing hydrographs between adjacent monitoring stations to identify suspect values or timing errors. Graphical inspection of hydrographs is the primary validation method. Peaks and troughs should generally match between stations, with earlier occurrences upstream. Examples demonstrate identifying anomalies by comparing multiple station hydrographs and examining lag times between peaks. Combined hydrograph and rainfall plots can further assess timing errors and intervening rainfall effects. The overall goal is to flag potential errors for further investigation while transforming data to discharge where possible for more robust comparisons.
This document provides guidance on correcting and completing rainfall data. It discusses using autographic rain gauge (ARG) and standard rain gauge (SRG) data to correct errors when one instrument fails. When the SRG fails but ARG data is available, the SRG data can be replaced with totals from the ARG record. When the ARG fails, hourly distributions from neighboring stations can be used to estimate missing hourly values based on the daily total from the station's SRG. The document also discusses correcting errors like wrong dates and apportioning partial daily accumulations. It describes using double mass analysis to adjust for systematic shifts and spatial interpolation methods to estimate missing values using data from surrounding stations. Examples are provided to demonstrate the techniques.
Scheme for the construction of water channelsmirzaqadeer
we are giving only idea for making water channel for poor less un economical area for different counties where people need water for drinking we present presentation in univsty CIIT
The document discusses the implementation of the Water Erosion Prediction Project (WEPP) model through web-based applications and database services. WEPP is a process-based, daily time step model that simulates crop growth and soil erosion on a field scale over multiple years. It includes sub-models for soil, climate, management, hydrology, plant growth, decomposition, and erosion. The implementation provides conservation planners tools to model both wind and water erosion and evaluate management practices. It allows for risk-based planning by running simulations over 100 years of climate data. WEPP results and reports are accessible online without software installation.
This document summarizes a presentation on an updated regional water facilities master plan. It outlines near-term and long-term water supply and conveyance projects to address constraints and risks identified in supply/demand and storage utilization analyses through 2025 and beyond. Near-term projects focus on untreated water conveyance and operational flexibility. Long-term projects include a second crossover pipeline, Pipeline 6, Colorado River conveyance, and Camp Pendleton desalination. It recommends Board approval of proposed near-term projects and distribution of the initial master plan draft for review.
The document summarizes a case study of obtaining an air permit for a new natural gas-fired power block at an existing power plant facility. It describes identifying the project, applicable air permitting regulations, unique solutions to air permitting issues like modeling for particulate matter and nitrogen dioxide standards, and an 18 month timeline. Key lessons learned include planning ahead, developing an air quality modeling protocol early, and identifying emissions reduction credits upfront.
This document outlines the guiding objectives and planning process for a 2035 infrastructure master plan. The objectives are to optimize the existing water conveyance and treatment systems, evaluate remaining and potential new infrastructure projects, integrate future supplies like desalination, develop surface water storage strategies with agencies, and adapt to changing supply and demand conditions. The planning process will analyze scenarios of water demands, local supplies, hydrology data and climate impacts. It will identify supply shortages, conveyance impacts, costs of alternatives, and make recommendations to address shortages and increase supplies through imported water, local supplies or reservoir operations. Key stakeholders will provide input throughout the process.
The document summarizes a project to construct a regional reservoir in Tampa Bay, Florida to serve over 2 million residents. Key aspects of the project included:
- Constructing a 15 billion gallon earthen reservoir on over 1,000 acres to supplement the region's existing water supply from three river sources.
- Laying over 42,000 feet of 84-inch pipeline to connect the reservoir to the water treatment plant and distribution system.
- Implementing extensive mitigation and environmental permitting, including preserving over 600 acres of upland and creating 450 acres of wetlands.
- Facing and overcoming construction challenges like cracks in the soil-bentonite cutoff wall and soil cement slope protection that required innovative solutions
The document summarizes activities related to updating the desired future conditions (DFC) for Groundwater Management Area 13, including:
1) Comparing actual groundwater level data to the current DFC through hydrographs of 92 wells.
2) Extending the groundwater availability model with updated pumping estimates from 2000 to 2011.
3) Completing alternative simulations with updated future pumping estimates and different pumping scenarios.
4) Drafting an explanatory report to document review of the nine required factors for establishing a proposed DFC.
This document summarizes water supply and demand projections for a water agency through 2035. It analyzes the agency's baseline supply and demand under normal weather conditions, and identifies potential supply shortages during dry years. The document evaluates the agency's existing water storage and conveyance infrastructure and identifies needs to improve system performance and reliability. Metrics and thresholds are established to determine when new infrastructure or supplies may be needed to address risks to the system from high conveyance utilization or low delivery reliability. Near-term and long-term options are considered to address identified needs and ensure a reliable water supply for the region.
This document summarizes Ken Weinberg's presentation on the water resources master plan. It discusses evaluating supply and demand, the role of water storage, conveyance constraints, and system performance metrics. It analyzes different project scenarios and their impacts on storage levels. The presentation recommends near-term projects to address untreated water delivery bottlenecks and reviews potential long-term supply and conveyance options. It outlines the process for selecting a preferred project list for environmental review.
This document outlines the stages of surface water data processing under the Hydrological Information System (HIS) in India. It discusses: 1) Receipt of data from field stations and storage of raw records; 2) Data entry at sub-divisional offices; 3) Validation of data through primary, secondary, and hydrological checks; 4) Completion and correction of missing or erroneous data; 5) Compilation, analysis, and reporting of validated data; 6) Transfer of data between processing levels from sub-division to division to state centers. The overall goal is to process field data in a systematic series of steps to produce quality-controlled hydrological information.
DSD-INT 2019 Delft FEWS-based flood forecasting system for Czech Hydrometeoro...Deltares
Presentation by Stanislav Vaněček, Pavel Tachecí, DHI CZ, at the Delft-FEWS User Days, during Delft Software Days - Edition 2019. Thursday, 7 November 2019, Delft.
This document summarizes the Hydrology Project Phase-II being implemented in Himachal Pradesh. The key points are:
1. The project was approved in 2006 for Rs. 49.50 Crore with an implementation period of 6 years, which was later extended by 23 months.
2. The project aims to strengthen hydrological monitoring networks and institutional capacity in Himachal Pradesh. It includes installation of rain gauges, weather stations, piezometers, labs, and data management systems.
3. As of 2014, most of the planned networks have been installed but some equipment procurement and installations are still ongoing. Data is being collected from most stations and shared with other organizations.
DSD-INT 2019 Introduction to wflow concepts, Features & developments, New rel...Deltares
This document provides an overview of the Delft Software Days - wflow user day 2019. It introduces Pieter Hazenberg as the presenter and discusses his background. It then provides an agenda that will cover what wflow is, its latest features, applications, integration with other models, and future plans. The presentation engages the audience to discuss their interests and perspectives on wflow's limitations and improvements. It concludes by announcing the new wflow 2019.1 release and highlighting updated features including redesigns to the subsurface flow algorithm in wflow_sbm and addition of new hydrological models to the framework.
DSD-INT 2019 wflow and the River Suir operational flood forecasting system, R...Deltares
Presentation by Jan Verkade, Deltares, at the wflow - User Day (Developments in distributed hydrological modelling), during Delft Software Days - Edition 2019. Friday, 08 November 2019, Delft.
The document discusses the Strategic Surface Route Plan (SSRP) which aims to balance supply and transportation costs to lower overall supply chain costs while maintaining velocity. The SSRP directs consolidation of shipments at consolidation and container points and deconsolidation at transportation control and staging points. A five version plan is outlined to develop the SSRP and integrate it with a Strategic Air Route Plan to optimize routing for over 60% of air and surface shipments globally.
DSD-INT 2020 Real Time Hydrologic, Hydraulic and Water Quality Forecasting in...Deltares
Presentation by Tony McAlister, WaterTech, at the Delft3D User Days - Australian Time zone: Inland to Estuary, during Delft Software Days - Edition 2020. Tuesday, 10 November 2020.
The document summarizes the Tamilnadu Hydrology Project-II. It provides details on achievements of the project including institutional strengthening through equipment procurement and capacity building. It discusses the development of decision support systems in 3 basins, including setting up hydrological models. Challenges faced and plans for utilizing outputs post-project are also outlined. Financial status and plans for utilizing the remaining budget are presented.
This document provides guidance on using hydrological models to validate hydrological data and fill in missing data. It describes a training module on hydrological data validation using the Sacramento hydrological rainfall-runoff model. The module includes an introduction to hydrological models, the conceptualization and components of the Sacramento model, and case studies of applying the model. The overall aim is to teach participants how to carry out hydrological data validation and fill in missing data by calibrating the Sacramento model using measured rainfall, evapotranspiration, and runoff time series from catchments.
The document provides an overview of the update to the Northern Trinity/Woodbine Groundwater Availability Model (NTWO GAM) being conducted by Mullican & Associates for four groundwater conservation districts in Groundwater Management Area 8. Key points:
- The project aims to overhaul a critical modeling tool for the districts to aid in joint groundwater planning.
- It will address limitations in the existing NTWO GAM through expanding the calibration period to 2010, providing more accurate predictions at the county scale, and developing a new GAM compatible with the joint planning process.
- The work involves tasks such as conceptual model development, model construction, calibration, and documentation.
- Over 1,400 wells have been
DSD-INT 2014 - Delft-FEWS Users Meeting - Challenges related to extending, te...Deltares
This document discusses the challenges faced by the National Weather Service in extending, testing, and delivering its Community Hydrologic Prediction System (CHPS), which is based on the Flood Early Warning System (FEWS). It outlines strategies used to develop software within the FEWS framework, release updates that incorporate new FEWS versions, and conduct regression testing to address issues arising from CHPS's dependency on the evolving FEWS platform. The strategies aim to minimize disruptions to CHPS operations at the 13 River Forecast Centers it supports.
The document summarizes the major activities and achievements of the Central Pollution Control Board's Hydrology Project-II regarding water quality monitoring. Some of the key points include:
- Installation of 10 real-time water quality monitoring stations on the Ganga and Yamuna rivers
- Development of a GIS-based water quality web portal to visualize historical and current water quality data
- Organization of 30 training workshops on water quality monitoring that reached over 750 laboratory staff
- Renovation of the CPCB water laboratory and development of water quality criteria and standards
The project aims to continue activities like annual maintenance of monitoring stations and the web portal, as well as propose new initiatives for the next phase including nationwide water pollution
This document summarizes the objectives, partners, and services of the SERVIR Network, which is a regional partnership that uses earth observation data and geospatial technologies to address issues related to food security, water resources, weather and climate, and land use in Southeast Asia. The SERVIR Network aims to build capacity for using geospatial data and tools, improve access to this information, and support decision-making. It develops products and services through stakeholder engagement and open data sharing. A needs assessment identified priorities like land cover mapping, early warning systems, water resources management, and crop forecasting. The document describes datasets and tools developed by SERVIR, including a dam inundation areas dataset and online and desktop tools for modeling reservoir areas
The Big Data Project is an innovative approach to publishing NOAA’s vast data resources and positioning them near cost-efficient high performance computing, analytic, and storage services provided by the private sector. This collaboration combines three powerful resources - NOAA’s tremendous volume of high quality environmental data and advanced data products, private industry’s vast infrastructure and technical capacity, and the American economy’s innovation and energy - to create a sustainable, market-driven ecosystem that lowers the cost barrier to data publication. This project will create a new economic space for growth and job creation while providing the public far greater access to the data created with its tax dollars.
Hydrologic Data Collection is an environmental consulting firm established in 2001 that specializes in water resource monitoring. The company has over 350 years of combined experience from the USGS and private sector. It provides services such as surface water monitoring, water quality monitoring, groundwater monitoring, and TMDL studies. Hydrologic Data Collection aims to collect and analyze high quality data rapidly and cost-effectively for its clients.
From Data to insight: Emerging Opportunities in Africa for 2018mdn_dan
When the oil price was last in $100 per barrel range Africa was a major hotspot for exploration and appraisal.
Due to various geopolitical developments the region quickly cooled off and has been largely quiet until now. With such a diverse range of basins, countries and petroleum systems anyone considering entering the region needs a robust and accurate benchmark.
Using a dataset purchased from DrillingInfo and Alteryx we explored some of the trends within the contienent from Q1/Q2 this year.
The document discusses implementing a groundwater decision support system in Denmark. It describes a 4 step process for building an effective DSS: 1) Create a fast hydrological screening calculator, 2) Set up an intuitive screening paradigm, 3) Identify relevant screening parameters, and 4) Make it a joint effort across stakeholders. The resulting DSS, called BEST, provides a fast yet comprehensive analysis of potential impacts of groundwater extraction on hydrology, nature types, and riverine ecosystems to inform permitting decisions.
Objectives:
Develop a replicable integrated model (methodology) for evaluating the extent and development potential of renewable (non-renewable) groundwater resources in arid lands, with the Eastern Desert of Egypt as a pilot site.
The model will be replicable for similar arid areas; North of Sudan, Tibesty, Yemen, and Saudi Arabia.
Building national capacities.
DOES SFO 2016 - Avan Mathur - Planning for Huge ScaleGene Kim
Installing one CI server or configuring a deployment pipeline for a specific application might be easy enough. However, as enterprises look to scale their DevOps adoption and optimize their software delivery practices across the organization (to support additional teams, product lines, application releases, processes and infrastructure) -- software delivery pipeline(s) need to scale to support enterprise workloads.
For some enterprises, this means having a pipeline that can withstand the velocity and throughput of thousands of product releases, supporting tens of thousands of developers and distributed teams, hundreds of thousands of infrastructure nodes, multitudes of inter-dependent application components, or millions of builds and test-cases.
This scale poses unique challenges and implications for your pipeline design. This talk covers best practices for analyzing and (re)designing your software delivery pipeline – regardless of your chosen tool-set or technologies. Obtain tips and tools for ensuring your pipelines and DevOps infrastructure have the right architecture and feature-set to support your software production as it scales, while also ensuring manageability, governance, security, and compliance.
Learn best practices for how to:
1) Plan for scale: how to project for the types of performance indicators/vectors you’d need to scale across.
2) How to design of your pipeline and supporting infrastructure and operations (such as data retention, artifact retrieval, monitoring, etc.).
3) Design your pipeline workflows and processes to allow reusability and standardization across the organization, while also enabling flexibility to support the needs of specific teams/apps.
4) Design your pipeline in a way that enables fast rollout- easy onboarding thousands of applications, across hundreds of teams
5) Incorporate security access controls, approval gates and compliance checks as part of your pipeline and have them standard across all releases
6) Ensure your architecture support HA, DR and business continuity.
7 - AECOM Water Resources Seminar World Bank -16-Septindiawrm
The document discusses AECOM's work on rehabilitating the Pattamundai Canal System in Odisha, India. It overviews AECOM's scope of work, which included surveys, design, drawings and cost estimates. It describes the canal system and key challenges including lack of data on the old system. AECOM's methodology involved condition surveys, GIS mapping, designs for canal modifications and new structures, and contract documents. The process included surveys, investigation, planning, design, quantities and cost estimation, and completion documents.
Modern tools and techniques can help address challenges in water data management. Water data management platforms use data sharing platforms to integrate data from multiple agencies in a standardized format. These platforms incorporate a hydrological geofabric to establish a single point of truth for water mapping, and use cloud computing to provide scalable access and analysis of large water datasets. For example, a demonstration showed how sensor data, water storage data, and river flow models could be integrated in a sensor cloud to help manage water sharing in a catchment.
DSD-INT 2023 Hydrology User Days - Presentations - Day 2Deltares
Presentation by several speakers at the Hydrology Suite User Days (Day 2) - wflow and HydroMT, during the Delft Software Days - Edition 2023 (DSD-INT 2023). Wednesday, 29 November 2023, Delft.
DSD-INT 2019 - Global Data Services and Analysis Frameworks - TwigtDeltares
Presentation by Daniel Twigt and Mark Hegnauer, Deltares, at the Delft3D - User Days (Day 1: Hydrology and hydrodynamics), during Delft Software Days - Edition 2019. Monday, 11 November 2019, Delft.
Water presentation port of corpus christijeshaml10
The document discusses water resource management strategies for the City of Corpus Christi. It provides an overview of the current water supply system, which serves nearly 500,000 residents across 18 communities. It also outlines water management strategies recommended in the 2011 regional water planning process, including expanding existing reservoirs and promoting water conservation. Finally, it discusses plans to conduct a variable salinity desalination pilot project to develop an alternative, drought-resistant water source and determine the feasibility of a full-scale desalination facility.
Examples of how Blueback tools can expand and enhance your Petrel workflowMitch Sutherland
A poster designed to give you a flavour of some of the cool Petrel plug-ins available from Blueback Reservoir. For exploration, interpretation, inversion, QI, data analysis, geomodeling & project management.
This document discusses a hydrology project in India that uses a decision support system (DSS) to analyze water resource scenarios. The DSS integrates tools and databases to help decision-makers analyze alternatives and consequences without an in-depth knowledge of modeling techniques. It provides timely information and allows scenario analysis. The river basin is divided into sub-basins modeled using hydrological and allocation models within the DSS to estimate components like rainfall, recharge, flow, and allocate surface and groundwater resources. The DSS is used to analyze scenarios like reservoir filling likelihoods and risks of low water levels under different planned water allocation scenarios.
Revised intensity frequency-duration (ifd) design rainfalls estimates for wa ...Engineers Australia
This document summarizes the revision of Intensity-Frequency-Duration (IFD) design rainfalls for Australia. A team updated the IFDs using a larger database that includes sub-daily rainfall data. They quality controlled the data, tested different frequency distributions, and derived short duration estimates using Bayesian modeling. The revised IFDs will be disseminated online and provide rainfall depths for standard durations, exceedance probabilities, and incorporate climate change considerations through ongoing research.
1. The document provides an introduction to computer-based flood risk modelling in the UK and overseas. It discusses the history and types of modelling, including 1D, 2D and 3D approaches.
2. Types of modelling include steady state and unsteady state approaches. Steady state does not consider variations over time while unsteady state does.
3. Models are used for a variety of functions like system operations, design works, assessing development impacts, and detecting triggered conditions. They help inform risk-based decision making.
The document describes the Ocean Thermal Extractable Energy Visualization (OTEEV) project, which aims to assess the maximum practically extractable ocean thermal energy (MPEE) on a global scale. The project uses output from a high-resolution ocean model run through an energy extraction model to produce estimated net power per location. This data will be integrated into an interactive GIS tool for public visualization of the global ocean thermal energy resource. Key accomplishments to date include completing the OTEC power extraction model and validating it using ocean temperature and depth profiles. Remaining work includes incorporating full model output into the GIS tool and delivering the final report.
This document discusses the importance of assessing water demand and sewage flow projections for planning purposes. It outlines key principles for determining demand, including separating internal and external demand and considering factors like peaking factors and infiltration. The document also explains that demand projections should be based on historical data, management programs, and growth projections. Accurately assessing current and future demand is important for identifying service needs, objectives, and infrastructure options.
ICLR Friday Forum: Modelling of Future Flood Risk Across Canada (May 31, 2019)glennmcgillivray
On May 31, 2019, ICLR conducted a Friday Forum webinar lead by Dr. Slobodan Simonovic of Western University titled 'Modelling of Future Flood Risk Across Canada Under Climate Change.'
Climate change has induced changes in key climate variables and the hydrological cycle across Canada. With continuous emission of greenhouse gases, this trend is expected to continue over the 21st century and beyond. In this study, a macro-scaled hydrodynamic model is used to simulate 25 km resolution daily streamflow across Canada for historical (1961-2005) and future (2061-2100) timelines.
Future projections from 21 GCMs following four Representative Concentration Pathways (RCPs) were used for the analysis. Changes in the frequency and magnitude of historical 100-year and 250-year return period flood events and month of occurrence of peak flow are analyzed. Results obtained from uncertainty analysis for both return period flood events found that flood frequency will increase in most of the northern Canada, southern Ontario, southern British Columbia, northern Alberta, Manitoba and Saskatchewan. However, northern British Columbia, northern Ontario, Manitoba and northeastern Quebec will be facing decrease in flood frequency. Results indicate that 40%-60% of Canada’s 100 most populated cities including many prominent cities such as Toronto and Montreal are high at risk of increased riverine flooding under climate change.
Slobodan P. Simonovic is Professor of Civil and Environmental Engineering at the University of Western Ontario and Director of Engineering Studies at ICLR. Prof. Simonovic is globally recognized for his unique interdisciplinary research in Systems Analysis and has over 500 professional publications and three major textbooks. Prof. Simonovic was inducted to the Canadian Academy of Engineering in June of 2013.
Hydrology and hydraulics for design designavirup naskar
This document provides an overview of hydrology and hydraulic considerations for bridge design. It discusses calculating design discharges using USGS reports, collecting channel and bridge characteristics through field surveys, performing hydraulic analysis using HEC-RAS software, meeting requirements of the National Flood Insurance Program, analyzing scour, and ODOT submittal requirements. The key steps involve estimating flood flows, modeling water surface profiles, evaluating flood risks and impacts, and designing protections against scour.
Software Engineering and Project Management - Introduction, Modeling Concepts...Prakhyath Rai
Introduction, Modeling Concepts and Class Modeling: What is Object orientation? What is OO development? OO Themes; Evidence for usefulness of OO development; OO modeling history. Modeling
as Design technique: Modeling, abstraction, The Three models. Class Modeling: Object and Class Concept, Link and associations concepts, Generalization and Inheritance, A sample class model, Navigation of class models, and UML diagrams
Building the Analysis Models: Requirement Analysis, Analysis Model Approaches, Data modeling Concepts, Object Oriented Analysis, Scenario-Based Modeling, Flow-Oriented Modeling, class Based Modeling, Creating a Behavioral Model.
Tools & Techniques for Commissioning and Maintaining PV Systems W-Animations ...Transcat
Join us for this solutions-based webinar on the tools and techniques for commissioning and maintaining PV Systems. In this session, we'll review the process of building and maintaining a solar array, starting with installation and commissioning, then reviewing operations and maintenance of the system. This course will review insulation resistance testing, I-V curve testing, earth-bond continuity, ground resistance testing, performance tests, visual inspections, ground and arc fault testing procedures, and power quality analysis.
Fluke Solar Application Specialist Will White is presenting on this engaging topic:
Will has worked in the renewable energy industry since 2005, first as an installer for a small east coast solar integrator before adding sales, design, and project management to his skillset. In 2022, Will joined Fluke as a solar application specialist, where he supports their renewable energy testing equipment like IV-curve tracers, electrical meters, and thermal imaging cameras. Experienced in wind power, solar thermal, energy storage, and all scales of PV, Will has primarily focused on residential and small commercial systems. He is passionate about implementing high-quality, code-compliant installation techniques.
Prediction of Electrical Energy Efficiency Using Information on Consumer's Ac...PriyankaKilaniya
Energy efficiency has been important since the latter part of the last century. The main object of this survey is to determine the energy efficiency knowledge among consumers. Two separate districts in Bangladesh are selected to conduct the survey on households and showrooms about the energy and seller also. The survey uses the data to find some regression equations from which it is easy to predict energy efficiency knowledge. The data is analyzed and calculated based on five important criteria. The initial target was to find some factors that help predict a person's energy efficiency knowledge. From the survey, it is found that the energy efficiency awareness among the people of our country is very low. Relationships between household energy use behaviors are estimated using a unique dataset of about 40 households and 20 showrooms in Bangladesh's Chapainawabganj and Bagerhat districts. Knowledge of energy consumption and energy efficiency technology options is found to be associated with household use of energy conservation practices. Household characteristics also influence household energy use behavior. Younger household cohorts are more likely to adopt energy-efficient technologies and energy conservation practices and place primary importance on energy saving for environmental reasons. Education also influences attitudes toward energy conservation in Bangladesh. Low-education households indicate they primarily save electricity for the environment while high-education households indicate they are motivated by environmental concerns.
Open Channel Flow: fluid flow with a free surfaceIndrajeet sahu
Open Channel Flow: This topic focuses on fluid flow with a free surface, such as in rivers, canals, and drainage ditches. Key concepts include the classification of flow types (steady vs. unsteady, uniform vs. non-uniform), hydraulic radius, flow resistance, Manning's equation, critical flow conditions, and energy and momentum principles. It also covers flow measurement techniques, gradually varied flow analysis, and the design of open channels. Understanding these principles is vital for effective water resource management and engineering applications.
Supermarket Management System Project Report.pdfKamal Acharya
Supermarket management is a stand-alone J2EE using Eclipse Juno program.
This project contains all the necessary required information about maintaining
the supermarket billing system.
The core idea of this project to minimize the paper work and centralize the
data. Here all the communication is taken in secure manner. That is, in this
application the information will be stored in client itself. For further security the
data base is stored in the back-end oracle and so no intruders can access it.
Digital Twins Computer Networking Paper Presentation.pptxaryanpankaj78
A Digital Twin in computer networking is a virtual representation of a physical network, used to simulate, analyze, and optimize network performance and reliability. It leverages real-time data to enhance network management, predict issues, and improve decision-making processes.
Null Bangalore | Pentesters Approach to AWS IAMDivyanshu
#Abstract:
- Learn more about the real-world methods for auditing AWS IAM (Identity and Access Management) as a pentester. So let us proceed with a brief discussion of IAM as well as some typical misconfigurations and their potential exploits in order to reinforce the understanding of IAM security best practices.
- Gain actionable insights into AWS IAM policies and roles, using hands on approach.
#Prerequisites:
- Basic understanding of AWS services and architecture
- Familiarity with cloud security concepts
- Experience using the AWS Management Console or AWS CLI.
- For hands on lab create account on [killercoda.com](https://killercoda.com/cloudsecurity-scenario/)
# Scenario Covered:
- Basics of IAM in AWS
- Implementing IAM Policies with Least Privilege to Manage S3 Bucket
- Objective: Create an S3 bucket with least privilege IAM policy and validate access.
- Steps:
- Create S3 bucket.
- Attach least privilege policy to IAM user.
- Validate access.
- Exploiting IAM PassRole Misconfiguration
-Allows a user to pass a specific IAM role to an AWS service (ec2), typically used for service access delegation. Then exploit PassRole Misconfiguration granting unauthorized access to sensitive resources.
- Objective: Demonstrate how a PassRole misconfiguration can grant unauthorized access.
- Steps:
- Allow user to pass IAM role to EC2.
- Exploit misconfiguration for unauthorized access.
- Access sensitive resources.
- Exploiting IAM AssumeRole Misconfiguration with Overly Permissive Role
- An overly permissive IAM role configuration can lead to privilege escalation by creating a role with administrative privileges and allow a user to assume this role.
- Objective: Show how overly permissive IAM roles can lead to privilege escalation.
- Steps:
- Create role with administrative privileges.
- Allow user to assume the role.
- Perform administrative actions.
- Differentiation between PassRole vs AssumeRole
Try at [killercoda.com](https://killercoda.com/cloudsecurity-scenario/)
1. Design of an Active Control Outlet
in a Stormwater Drainage Basin
Rose Degner, Paige Kimble, Brandon Perkins & Pa-Sweet Betancourt
Clemson University, Clemson, SC
October 22, 2020
4. Background - Climate Change
• Warming climate
• Atmosphere holds
more water
• More frequent and
more intense storms
50 year trends in river discharge
5. Background - Growing Urban Development
• Global population is growing
• Countries are becoming more
urban
• 55% world population
• Increasing development leads
to increasing impervious
surface areas
Urbanization in the past 500 years for 4 major countries and the world
6. Background - Impervious Surface Area
• Impervious surface areas
• Less infiltration
• Higher rates of runoff
• 1.1 year return period storm
• Natural peak flow: 82.45 m3/s
• Urban peak flow: 209.29 m3/s
• Larger storms hitting a larger
area of impervious surfaces
• Flooding, erosion, water quality
Shape of flood hydrographs for surfaces with
varying imperviousness
7. Background - Small Solutions
• Larger infrastructures needed for
extensive flooding
• Small changes on a universal
scale
• Improve widespread water quality
• Reduce hydraulic stress on smaller
receiving water bodies
Stormwater
management for a
neighborhood
Flooding in
Philadelphia
8. Background - Stormwater Retention Basins
• 1987 National Pollutant Discharge
Elimination System
• Stormwater retention systems used for
the first time
• Main benefit: Total Suspended
Solids (TSS) reduction
• Erosion control and flooding
management Pre and post development hydrologic cycles
9. Background - Stormwater Retention Basins
• How do they help?
• Runoff retention (TSS
settling)
• Steady release of the water
• Infiltration
• Some vegetative uptake
• Basin design is for
• Certain % TSS removal
• Certain storm event
• Ex. 10 year, 24 hour storm
Stormwater Retention Pond diagram
10. Background - Static Outlets
• Open pipe outlet
• TSS settles as the water is
released
• Designed for average conditions
• Not always effective for
• More intense storms
• If field conditions change
• Water released to mimic pre-
development flows
• Young technology
• 30 years
• Room for improvement
Outlet structure at design site (above)
Close up of static outlet at design site
(left)
11. Background - Active Outlets
• Outlet can be adjusted
• Open, partially open,
closed
• Can consider
• Weather forecast
• Pond water level
• Maximize retention time
• Better mimic pre
development flow
Stormwater basin outlet structure
12. Background - Active Outlets
• Can increase efficiency in
• Water pollutant reduction
• Basin location
• Basin design
• Smaller ponds
• More cost effective
• Better use of land
• Can be retrofitted onto pre-
existing retention ponds Flow Duration Curves for static and active outlet
systems
13. Background - Site Information
• Pre-existing pond in Pelzer, SC
• At the base of Bargain Food Store
• Main constituent is nutrients
• TSS can be used to gauge success
• 2004 inflow and outflow data taken by Woolpert
• 6 sampling events
• 12 samples throughout storm event
• Max TSS inlet concentration: 876 mg/L
• Average TSS inlet concentration: 124 mg/L
• Average % reduction: 56.05%
• More site information covered later
Satellite image of site with stormwater basin
outlined in red
14. Rationale
● Increased intensity of rain and continuous urbanization
○ Flooding concerns
○ Water quality concerns
● Active control outlets
○ Stormwater drainage is more efficient
○ Improves stormwater quality
○ Smaller stormwater pond size
○ Can be retrofitted onto current ponds
● Success of active control outlets on large scale
○ Critical to consider efficacy of technology on a small scale
15. Objective
The objective of the project is to design and evaluate the impact of an active outlet
control structure for stormwater management applications for water quality and
quantity benefit using a pond in Pelzer, SC as a case study.
16. Approaches
• Task 1: Discuss with Woolpert the extent of the project
• Task 2: Review scientific literature on engineering design related to stormwater
management
• Task 3: Apply adaptive control structure to retention pond for water quality control
• Task 4: Determine and assess the site properties (physical, chemical, hydrologic) and
collect data (hydrology, topography)
• Task 5: Create site exhibits in GIS and input values for modeling
• Task 6. Develop a watershed study using EPA SWMM program
• Task 7: Evaluate and compare the new models to pre existing models
• Task 8: Simulate pre- and post-hydrologic conditions
• Task 9: Optimize and Design the active outlet control structure
• Task 10: Apply for permits
19. Literature Review - Programming
• Writing code is out of the scope of this project
• Programming Logic Controller (PLC)
• Also called a data logger
• A data logger - a point of communication
between outlet and weather forecast
programming
• CR1000X data logger from Campbell
• Ideal for outdoor conditions
● Where is the data for the program coming from?
● How is the data received and integrated into the program?
● How is the forecasting information used by the data logger?
CR1000X Flagship Data Logger from Campbell
20. Programming - Where is the data coming from?
• NOAA, or the National Oceanic and
Atmospheric Administration
• Offers multiple public models
• High Resolution Rapid Refresh
(HRRR) model (experimental)
• Reasonable precipitation
predictions, cloud coverage
• Resolution of 3-km
• Forecasts up to 12h in 1-hour
increments; can extend up to 48h
in 6-hour increments
Picture of 12hr HRRR forecast for Oct 14, 2020
21. Programming - Where is the data coming from?
• Weather Prediction Center
(WPC) under NOAA also has
models
• WPC offers long, medium, and
short range forecasts
• The Quantitative Precipitation
Forecasts (QPF)
• Focuses on heavy rain, snow
events, and flash flooding
• Resolution of 20-km
• Forecasts in 6-, 24-, and 48-
hour increments
Picture of 24hr QPC forecast for Oct 14, 2020
22. Programming - Where is the data coming from?
• National Centers for
Environmental Protection
• North American Mesoscale
Model (NAM)
• Precipitation, lightning,
temperature, kinetic energy;
good for large storm events
(eg hurricanes)
• Resolution of 12-km
• Short-term weather forecasting
Picture of 6hr NAM forecast for Oct 14, 2020
23. Programming - Where is the data coming from?
• Global Forecast System (GFS)
• Covers the entire globe
• Includes wind, precipitation,
soil moisture, atmospheric
ozone concentration, etc.
• Resolution of 18 miles
• Predicts weather up to 16
days
Picture of 12hr GFS forecast for Oct 14, 2020
24. Programming - Where is the data coming from?
• Forecasting model used will depend on:
• Area of the stormwater basin
• Resolution and time frame desired
• Type of forecasting desired
• Potentially time of year.
• HRRR is sufficient for this design project
• Forecasting model used can be updated
Picture of 12hr HRRR forecast for Oct 14, 2020
25. • Where is the data for the program coming from?
• HRRR forecast from NOAA
• How is the data received and integrated into the program?
• How is the forecasting information used by the data logger?
26. Programming - How is the data received and
integrated into the program?
• Forecasts from NOAA can be automated
• Pulled from NOAA’s website with a code
• Provided as a radar image
• With code, received by program as a
grib file
• Grib file - file format for
storage/transport of gridded
meteorological data
• Degrib - code to decipher the grib file
Picture of 12hr HRRR forecast for Oct 14, 2020
27. Example screenshot of
program (left). These lines
of code pull the 18 hour
forecast
18 hour forecast output for
October 19, 2020 (right)
from above code
28. Programming - How is the data received and
integrated into the program?
• Subcodes written to:
• Update the forecast
• Specify what to do
• Program reading the forecasting data is not enough
• Forecast needs to be sent to the data logger
29. • Where is the data for the program coming from?
• HRRR forecast from NOAA
• How is the data received and integrated into the program?
• Both grib files and degrib code can be found on NOAA’s
website
• How is the forecasting information used by the data logger?
30. Programming - How is the forecasting
information used by the data logger?
• File and data transfer
• Ex. computer browser uses
HTTP
• Sends/receives data to/from
website server
• FTP or File Transfer Protocol
• One of the oldest and simplest
protocols
• User can download/upload
files to a server
• Data logger/server
• Unique IP address
31. Programming - How is the forecasting
information used by the data logger?
• Forecasting program written by Woolpert
• Stored on a server in Dayton, OH
• Interacts with the data logger located in Pelzer, SC using FTP
• Lines of code for:
• Getting grib file
• Degribbing forecasting data
• Using FTP to send information to data logger
32. Programming - How is the forecasting
information used by the data logger?
• Data logger will receive:
• Forecasting information from server
• Real time water level from water level
sensor
• Logic program running on data logger will then:
• Determine if outlet needs to be opened or
closed
• Send appropriate signal to outlet
33. • Where is the data for the program coming from?
• HRRR forecast from NOAA
• How is the data received and integrated into the
program?
• Both grib files and degrib code can be found on
NOAA’s website
• How is the forecasting information used by the data
logger?
• FTP is used to send forecast to the data logger
36. Valve: Butterfly
- Butterfly valves opens, closes and regulates a fluid passage by
reciprocating about 90° with a disc type opening and closing
member
Advantages
● Simple structure, small
volume, light weight
● Small flow resistance
and opening/closing time
● Low pressure drop, high
pressure recovery
Disadvantages
● Flow adjustment range is
small, open 30% → flow
rate 95%
● Difficult to clean
● Difficulty with slurries
● Potential for cavitation
and choke
37. Valve: Pinch
- Pinch valves have a full-bore design. This means they can
intrinsically allow unrestricted flow and ensure complete
stoppage.
Advantages
● Very clean, excellent
drainage
● Inexpensive
● Minimal turbulence
● Low weight
● Low maintenance
Disadvantages
● Cannot be used in high
temperature
applications
● Cannot be used in high
pressure applications
● Cannot be used with
Gas media
38. Valve: Ball
- Ball valve consists of a large sphere with a central hole equal to
the inside diameter of the pipe in mounted
Advantages
● Maintains and regulates high
volume
● Does not require lubrication
● Superior ease of operation
● Low maintenance cost
● High pressure and high temp
flow
● Low purchase cost
Disadvantages
● Not suitable for throttling
applications
● Suspended particles can settle
and become trapped, causes:
○ Wear
○ Leakage
○ Valve failure
● Difficult to clean, leads to
contamination
39. Valve: Gate
- Gate valves work by inserting a rectangular gate or wedge into the path
of a flowing fluid
Advantages
● Used as shut off valve
● Inexpensive
● Available in large sizes
● Bi-directional
● Suitable for use with slurries
and viscous liquids
Disadvantages
● Low pressure limitations
● Difficult to repair
● Slow open/close time
● Seat and disk erosion can occur
● Poor throttling characteristics
40. Valve: Globe
- Globe valves have a spherical body shape with the two halves of the body
being separated by an internal baffle.
Advantages
● Can be fast-acting
● Precise control
● Can be used in high-pressure
systems
Disadvantages
● High head loss
● Not good for clean or sterile
application
● Low coefficient of flow -
Cantilevered mount of disk to
stem
● Heavier than other valves
42. Actuator: Electric
- An actuator requires a control signal and a source of
energy. The control signal is relatively low and in this
case would be electric voltage or current.
Advantages
● Fast and accurate
● Very fast development times for new
models
● Possible to apply sophisticated control
techniques to motion
● Relatively inexpensive
Disadvantages
● Gear backlash limits precision
● Problems of overheating in stalled
conditions
● Inherently high speed with a low torque
● Brakes are needed to lock them into
position
43. Actuator: Pneumatic
- A pneumatic actuator requires a control signal and a
source of energy. The control signal is relatively low
and in this case would be pressurized air
Advantages
● Low cost
● Ease at reversion movement
● High speed of moving
● Explosion and fire safe
Disadvantages
● Compressibility of air
● Problems of overheating in stalled
conditions
● Impossibility to receive uniform air
output
● Performance difficulty at slow/constant
speed
● Requires good preparation
● Brakes are needed to lock them into
position
44. Design Criteria
• TSS removal
• Driven by detention time
• 60% in 24 hour detention time
• Greenville County
Regulations
• 80% TSS removal
• 72 hour drawdown of standing
water
45. Critical Storm
25-year, 24-hour storm event
6.69-inches of precipitation
• Applied to assess how our
design reacts under crucial
circumstances
• Before and after
implementation of
retrofitting
46. Design Storm
10-year, 24-hour storm event
5.40-inches of precipitation
• Applied to determine
necessary parameters for
design
• Before and after
implementation of
retrofitting
49. Materials and Methods - Programming Logic
• Many inputs to consider in
programming
• Current water level
• Precipitation forecasts
• Local regulations
• Logic flowchart was made to
visualize
• On/off system was assumed
• Flowchart can be expanded
for partially opening valve
Programming Logic Flowchart
51. Materials and Methods - ArcGIS ArcMap 10.8
• ArcMap is used to display geographic information as a
collection of layers and other elements in a map view
• The data frame provides a geographic window that allows
the user to display and work with geographic information
as a series of map layers
• These layers can also be used to store data relevant to the
project such as:
• Soil Data
• Digital Elevation
• Geometric Values (Area, Length)
• ArcMap also has the ability to perform geoprocessing
operations to assist in calculating necessary input values for
modeling
52. Basin Delineation
● Basin delineation exhibits are used for overall
visualization of all stormwater drainage being
deposited into the pond via overland flow or pipe
network (through yard inlets/junction boxes)
○ 2004 delineation based on 2004 Woolpert area values
○ Current conditions
● The layers present in this view include:
○ Landsat 8 Basemap Imagery: Provides satellite view
of the area of study
○ USGS Topo Map: Provides topographic information
for delineation of basin & subcatchments
○ Digital Elevation Model: Provides point-coverage
elevation data that is compiled into a raster file which
displays a connected elevation cover of the land (light
green=low elevation to red/white=high elevation) used
for delineation of the basin/subcatchments
○ Basin .shp file: Shows delineation of basin for area of
study
2004
2020
53. ArcMap Data: Basin Delineation
● The geometric calculation of area is based on the basin
boundary and stored within the basin .shp file for each
year of study
● Drainage basin delineated based on 2004 Woolpert
study area provided and replicated effectively
○ Inputs needed for replicate modeling
● Current conditions drainage basin area delineated
based on current information and site visits/pictures
54. Land Cover
● Land cover exhibits are used to show the land cover
classifications of the basin that will be used in the
determination of subcatchment curve numbers
● The layers present in this view include:
○ Landsat 8 Basemap Imagery: Provides satellite view
of the area of study
○ USGS Topo Map: Provides topographic information
for delineation of basin & subcatchments
○ Digital Elevation Model: Provides point coverage
elevation data that is compiled into a raster file which
displays a connected elevation cover of the land (light
green=low elevation to red/white=high elevation) used
for delineation of the basin/subcatchments
○ Land Cover .shp file: Shows land cover classification
of basin area
○ Basin .shp file: Shows delineation of basin for area of
study
2004
2020
55. ArcMap Data: Land Cover
● The geometric calculation of area
is separated by the land cover type
and stored within the Land Cover
.shp file for each year of study
● Land cover type was determined
using aerial imagery as well as
site visit information/pictures
● Area and land cover type are also
used in the determination of curve
number for each subcatchment in
each year
56. Soils
● Soils exhibits are used to show the soil types and
hydraulic classifications in the watershed that will be
used in the determination of subcatchment curve
numbers
● The layers present in this view include:
○ Landsat 8 Basemap Imagery: Provides satellite view
of the area of study
○ USGS Topo Map: Provides topographic information
for delineation of basin & subcatchments
○ Digital Elevation Model: Provides point coverage
elevation data that is compiled into a raster file which
displays a connected elevation cover of the land (light
green=low elevation to red/white=high elevation) used
for delineation of the basin/subcatchments
○ Soils .shp file: Shows the soil types and hydraulic
classifications in the basin area
○ Basin .shp file: Shows delineation of basin for area of
study
2004
2020
57. ArcMap Data: Soils
● Geometric calculation of area is separated
by soil type and stored within the Soils
.shp file for each year of study
● Soil types and hydraulic soil grades
obtained from NRCS Web Soil Survey
data within basin boundary
● Hydraulic soil grades are classified on an
A-D scale based on runoff potential of the
soil
○ Lowest potential - A
○ Highest potential - D
58. Subcatchments
● Subcatchment exhibits are used for overall
visualization of all subcatchment divisions within
the Pelzer Pond Basin
● The layers present in this view include:
○ Landsat 8 Basemap Imagery: Provides satellite view
of the area of study
○ USGS Topo Map: Provides topographic information
for delineation of basin & subcatchments
○ Digital Elevation Model: Provides point coverage
elevation data that is compiled into a raster file which
displays a connected elevation cover of the land (light
green=low elevation to red/white=high elevation) used
for delineation of the basin/subcatchments
○ Subcatchments .shp file: Shows delineation of
subcatchments (divided by node method) within basin
○ Basin .shp file: Shows delineation of basin for area of
study
2004
2020
59. ArcMap Data: Subcatchment
● The geometric calculation of area
is separated by each subcatchment
and stored within the
Subcatchment .shp file for each
year of study
● Subcatchment boundaries were
determined using the node
method
○ Each node (inlet) is divided into
individual drainage basins within
the Pelzer Pond Basin
60. Link Node
● Link Node exhibits are used to show the existing inlet
structures and the pipe linkages connecting them to each
other and the pond
● The layers present in this view include:
○ Landsat 8 Basemap Imagery: Provides satellite view of
the area of study
○ USGS Topo Map: Provides topographic information for
delineation of basin & subcatchments
○ Digital Elevation Model: Provides point coverage
elevation data that is compiled into a raster file which
displays a connected elevation cover of the land (light
green=low elevation to red/white=high elevation) used for
delineation of the basin/subcatchments
○ Subcatchments .shp file: Shows delineation of
subcatchments (divided by node method) within the basin
○ Node .shp file: Shows the location of inlet structures
(white) within the basin
○ Link .shp file: Shows the piping (green) connecting the
inlet structures to each other and the pond
○ Basin .shp file: Shows delineation of basin for area of
study
2004
2020
61. ArcMap Data: Link Node
● Nodes are placed over inlet
structures located within the
Pelzer Pond Basin
○ Aerial imagery
○ Site visit observations
○ Names stored in Node .shp file
● Links are drawn following the
underground pipe linkages
connecting each node to the pond
● The link lengths are determined
using a geometric calculation
operation and stored in the Link
.shp file
62. Slope
● Slope exhibits are used to show the overland flow path
within each sub catchment.
● The layers present in this view include:
○ Landsat 8 Basemap Imagery: Provides satellite view of
the area of study
○ USGS Topo Map: Provides topographic information for
delineation of basin & subcatchments
○ Digital Elevation Model: Provides point coverage
elevation data that is compiled into a raster file which
displays a connected elevation cover of the land (light
green=low elevation to red/white=high elevation) used for
delineation of the watershed/subcatchments
○ Subcatchments .shp file: Shows delineation of
subcatchments (divided by node method) within the basin
○ Node .shp file: Shows the location of inlet structures
(white) within the basin
○ Slope .shp file: Shows the overland flow path (orange)
from highest, furthest elevation in the subcatchment from
the inlet structure to the inlet structure
○ Basin .shp file: Shows delineation of basin for area of
study
2004
2020
63. ArcMap Data: Slope
● The overland flow path is draw within each subcatchment
from the furthest, highest elevation point to the inlet
structure (node)
● Upslope and downslope elevations are obtained by using
the information tool on the digital elevation model layer at
each endpoint of the overland flow paths
○ Elevations stored in the Slope .shp file
● Slopes are then calculated using length and elevation
values for each
subcatchment
64. Methods and Materials - EPA SWMM 5.1
Stormwater Management Model
• Water quantity and quality
modeling for urban watersheds
• Developed to aid local, state,
and federal stormwater
management by reducing
runoff
• Facilitate the incorporation of
our design to the industry
• Many capabilities and options
for stormwater routing
User interface for as-built Pelzer model.
65. EPA SWMM 5.1 Limitations
• Limited memory
• Rain event duration and time
interval
• Limits continuous modeling
• Urban-watersheds
• Developed to combat
urbanization
• Makes assumptions of
infiltration in pervious areas that
are exaggerated in rural
watersheds
• Quality of user provided data
Bargain Foods development
66. Model Validation
• 2004 amendments to watershed
required permitting by
Greenville County
• Approval was granted based on
a model prepared in Microsoft
Excel
• Conditions were replicated in
EPA SWMM to verify the
software’s similarity to
validated design calculations
• Finalized variables estimated
from a small range of values Hydrograph derived using Microsoft Excel in 2004
67. Models
2004 Permitted Existing
● 6” orifice with bleeders
● Watershed properties from
historical data
2020 As-Built Existing
● 2.5” orifice, 3 overflow weirs
knocked in the structure
● Watershed properties from current
public data and field measurements
Proposed Modifications
● Dynamic valve covering existing
2.5" orifice
● Keep all other spillways from as-
built condition
● Tweak weirs and orifices as
necessary
68. Modeling an Active Control Outlet
By Pond Depth and Simulation Time
1. Find freeboard threshold depth of
collection pond
2. Find pond drawdown time
3. Manipulate Control Options by
If/Then Statements
a. For pond depth
b. For holding time Control Rules determine how pumps and regulators in
the conveyance system will be adjusted over the course
of a simulation.
77. Features:
• 304 Stainless Steel construction
• Clevis design and horizontal bolting stabilizes gate, proper alignment
• Multi-layer square packing provides exceptional gland sealing
• Unique body design, enables self draining
• Zero leakage isolation
• Lugged body suitable for all mounting orientations
Built for:
• Severe service performance
• Low pressure applications
Bray: Series 940 Knife Gate Valve
78. Rotork: IQ3 - Multi-turn
Features:
• Continuous positions tracking at all times, even without power
• Detailed trend analysis and diagnostic data available for asset management
• Increased protection by using independent torque and position sensing
• Remote operation, configuration and commission up to 100m from actuator
• Safe, motor-independent, handwheel operation available at all times
• Real time valve and actuator performance information viewable on screen
• Easy installation and maintenance using detachable thrust bases
• Explosion proof to international standards
• Oil bath lubricant provides extended life and the ability to mount in any
orientation
• On power loss, graphical interface, remote indication and data logger are
maintained and accessible
● 3rd Generation Intelligent Actuator
79. Programming Specifications
• Keep water level just below
depth of weirs
• Time to drain pond from
holding depth to outlet invert is
17.5-hours
• Open outlet 56.5 hours into a
24-hour storm event to drain by
72-hours