Download to read offline
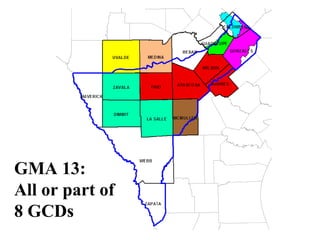
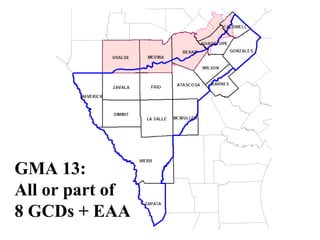

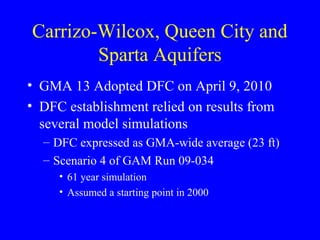
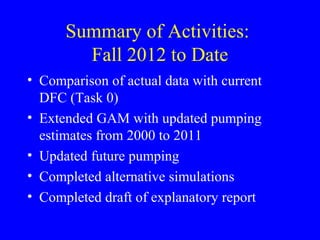
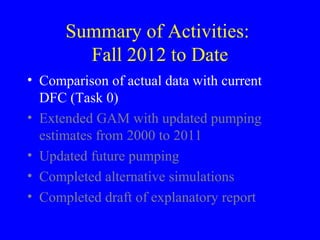

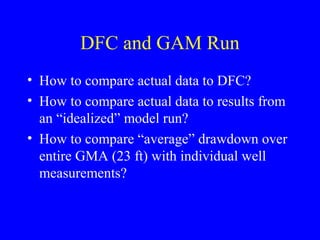


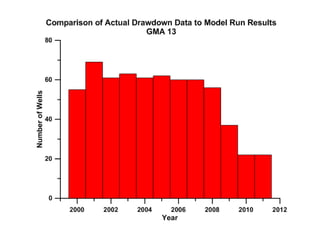
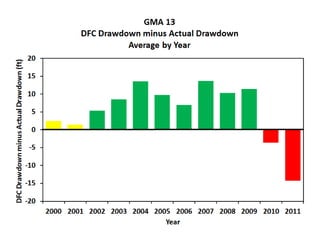

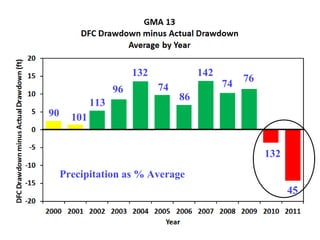

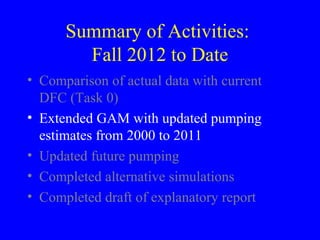

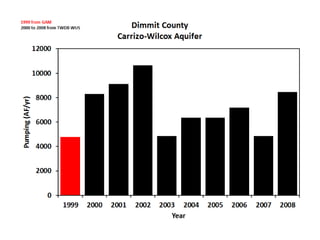
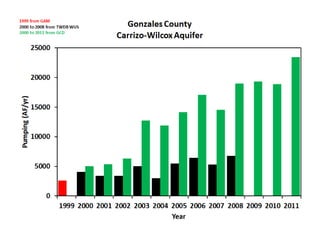
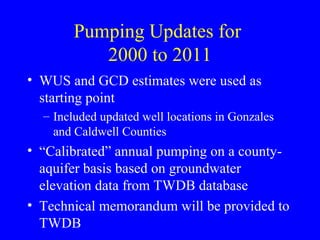
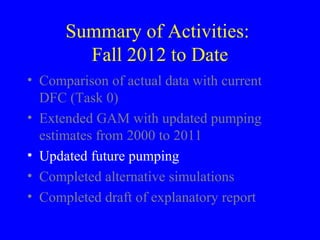
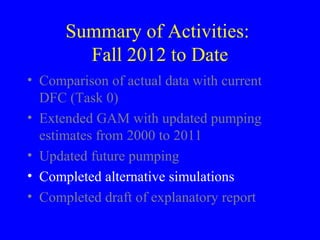
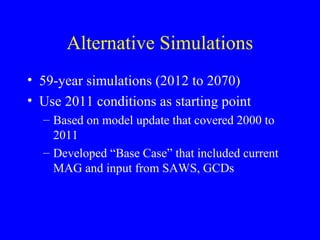
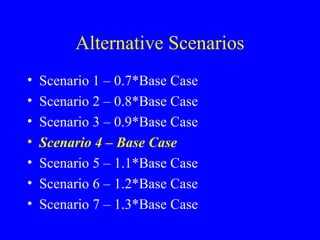


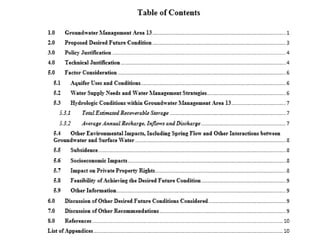


The document summarizes activities related to updating the desired future conditions (DFC) for Groundwater Management Area 13, including: 1) Comparing actual groundwater level data to the current DFC through hydrographs of 92 wells. 2) Extending the groundwater availability model with updated pumping estimates from 2000 to 2011. 3) Completing alternative simulations with updated future pumping estimates and different pumping scenarios. 4) Drafting an explanatory report to document review of the nine required factors for establishing a proposed DFC.