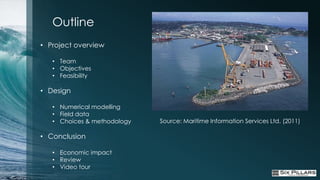
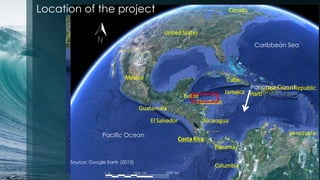
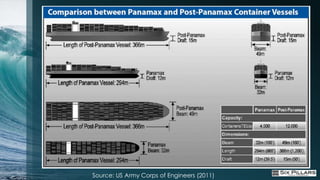
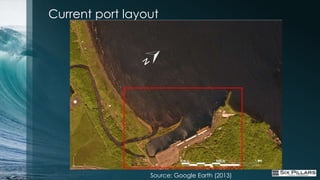
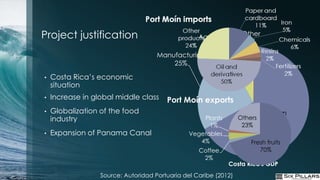
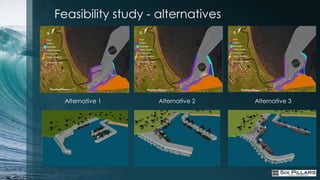
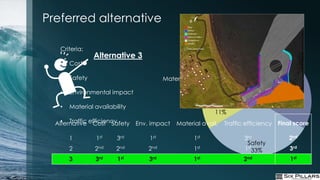
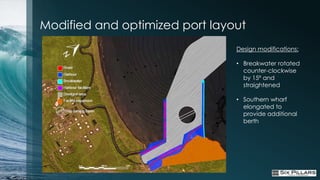
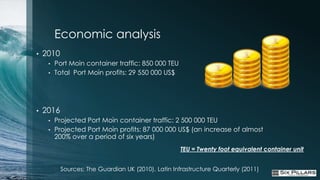
Six Pillars Coastal Engineering
Outline
• Project overview

   • Team
   • Objectives
   • Feasibility

• Design

   • Numerical modelling
   • Field data
   • Choices & methodology   Source: Maritime Information Services Ltd. (2011)

• Conclusion

   • Economic impact
   • Review
   • Video tour
Project team


                                            Gabriel
 Robin   Christian   Frederic   Matthew                   Luc
                                          Beauchesne-
Malyon    Viau       Dagenais   Mantle                  Lendrum
                                            Sévigny
Project support team


           Seth Logan                      Graham Frank
             M.A.Sc.                           P.Eng                      Dr. Ioan Nistor
W.F. Baird & Associates Coastal   W.F. Baird & Associates Coastal              P.Eng
         Engineers Ltd.                    Engineers Ltd.           Hydrotechnical Consultant
Coastal Engineering Consultant    Coastal Engineering Consultant
Objectives
• Increase the capacity of Port Moìn, Costa Rica


• Design a breakwater to protect the newly expanded port


• Provide accommodations for Post-Panamax class container vessels


• Construct 1.5km of new wharf and expand existing channel


• Provide 50 hectares for container yard and facilities
Location of the project


                                     Caribbean Sea


                                    Panama Canal


                   Pacific Ocean


      Source: Google Earth (2013)
Source: US Army Corps of Engineers (2011)
Current port layout


                 Source: Google Earth (2013)
Project justification                           Agriculture        Other
                                                    7%              1%
                                     Manufacturing
                                         25%

•   Costa Rica’s economic
    situation
•   Increase in global middle class     Port Moín exports
•   Globalization of the food                                              Tourism
    industry                                        Plants        Others
                                                                             67%
                                                      1%           23%
•   Expansion of Panama Canal                   Vegetables
                                                   4%                 Fresh fruits
                                                   Coffee                70%
                                                    2%
                                                             Costa Rica's GDP
                  Source: Autoridad Portuaria del Caribe (2012)
Feasibility study - alternatives


 Alternative 1      Alternative 2   Alternative 3
Preferred alternative

   Criteria:
                Alternative 3                                    Traffic
   •   Cost
                                                               Efficiency
                                                                   17%               Cost
   •   Safety                            Material Avail.                             33%
                                              6%
   •   Environmental impact

   •   Material availability                              Env. Impact
                                                              11%
  Alternative efficiency
    • Traffic Cost Safety      Env. impact   Material avail.    Traffic efficiency Final score

       1        1st     3rd        1st              1st                 3rd            2nd
                                                                         Safety
       2        2nd     2nd        2nd              1st                 1st33%         3rd
       3        3rd     1st        3rd              1st                 2nd            1st
Numerical modeling of wave
hydrodynamics
•   Spectral Wave module – MIKE21
     •   Simulates growth, decay and transformation of waves
     •   For analysis of wave climates in offshore and coastal areas


•   Provides details of wave-harbour interaction
     •   Fast simulation times allow for iterative design and optimization
     •   Breakwater was modelled as land; a limitation of MIKE 21
Computational domain
•   Mesh generation and interpolation of available
    bathymetric data
Statistical analysis
•   Offshore wave and wind conditions


                                         Wind climate


                                        Wave climate
Model results of significant height conditions
Model results - wave data
For the 200 years storm event approaching from 60 degrees
 direction (nautical) with following offshore wave
 characteristics:

   •   Significant wave height: 5 m
   •   Significant wave period : 12 s


Model results, breakwater location:
   •   Significant wave height, Hs : 3.41 m
   •   Wave period, T01 : 8.92s
   •   Maximum wave height, Hmax : 6.25 m
   •   Peak wave period, Tpeak : 12.21s
Modified and optimized port layout
                                Design modifications:

                                • Breakwater rotated
                                  counter-clockwise
                                  by 15º and
                                  straightened

                                • Southern wharf
                                  elongated to
                                  provide additional
                                  berth
Field data – Geotechnical
     •   Deep silty sand layer
         underlain by 3m of dense
         sand
     •   Bed rock (limestone)
         located at approximately
         17m below seafloor

 Soil layer    Angle     Cohesion (c')   Unit Weight (γ‘)
                  of
              friction
                 (º)        (kPa)           (kN/m³)
 Silty Sand     32            2               19.62
Dense Sand      40            0               22.60
Types of breakwater-wharf systems

Pile system type
•   Rubble mound breakwaters with
    piles


Composite type
•   Horizontal composite breakwater


                                      Source: Takahashi (1996)
Breakwater armouring – Options


        Quarry stones                Accropodes

 Source: US Army Corps (2005)   Source: Behance.net (2009)
Design calculations for breakwater with
        option 1 – Quarry stone
Typical rubble-mound
breakwater cross section


                    Source: CEM (2011)
Selection of allowable
overtopping discharge


   Source: Caitlin Pilkington (2007)


                                       Source: CEM (2011)
Freeboard


                                    Source: CEM (2011)


                                           Rc = 4.75 m

  van der Meer and Janssen (1995)
Armour unit weight


                              Source: CEM (2011)


                                M50 = 7710 kg


  Hudson’s equation, (1984)
Toe berm design


                  Source: CEM (2011)
Final design drawing – Quarry stone
Design calculations for breakwater with
        option 2 – Accropodes
Source: Arthur de Graauw (2007)

                                                   M = 2400 kg

Source: Concrete Layer Innovations (2012)
Final design drawing – Accropodes
Final design drawing – Breakwater head
              (Accropodes)
Final design drawing – Parapet wall
Potential failure modes – Rubble section

•   CEM recommends using the following “performance function” :
            G = Factored resistance – Factored loadings
            Where “G” must be greater than 0 for stability


•   Armour stability
      •   G = 0.08

•   Toe berm stability
      •   G = 0.26

•   Run-up
      •   G = 0.02

•   Scour for steady stream
      •   G = 0.06
                                  Sources: Caitlin Pilkington (2007), Baird (2010)
Potential failure modes – Caisson section

•   Sliding
     •   F.S.=4.91


•   Overturning
     •   F.S.=5.62


                               Source: Van De Meer (2007)

•   Bearing
     •   F.S=3.02
Slip surface analysis – GeoStudio


  F.S (left slope) : 1.64   F.S (right slope) : 1.49
Economic analysis
•   2010
     •   Port Moìn container traffic: 850 000 TEU
     •   Total Port Moìn profits: 29 550 000 US$


•   2016
     •   Projected Port Moìn container traffic: 2 500 000 TEU
     •   Projected Port Moìn profits: 87 000 000 US$ (an increase of almost
         200% over a period of six years)
                                                     TEU = Twenty foot equivalent container unit


           Sources: The Guardian UK (2010), Latin Infrastructure Quarterly (2011)
Cost analysis

 Armouring     Cost/ linear     Cost of     Cost of   Cost of add. port   Project cost   Return
                meter of      Breakwater   dredging    and harbour                       period
               Breakwater                                 facilities                     (i=5%)


                  (US$)        (M US$)     (M US$)        (M US$)           (M US$)      (years)

Quarry stone     250 300         216         81             739              1036         18.7
Accropode        208 300         180         81             739              1000         17.5
Conclusions
•   SAFETY: The redesigned port will meet or exceed all safety criteria,
    providing safe harbour for years to come


•   EFFICIENCY: The harbour has been optimized for the protection of
    traffic and the minimization of downtime


•   PROFIT: The additional revenue will provide an acceptable return
    period, justifying the investment,.
Video
Acknowledgements
•   Dr. Ioan Nistor


•   Baird & Associates


•   DHI Water & Environment


•   Faculty of Engineering, University of Ottawa


•   Video music track: “Ave Maria”, composed by Franz Schubert (1825), performed by Daniel Perret
    (1995). All rights reserved.
Questions?
References
•   Administracion Portuaria. (2012). Panorama Portuario en Cifra 2011. Retrieved November 2012, from Autoridad
    Portuaria del Caribe: http://www.japdeva.go.cr/adm_portuaria/Estadisticas.html#223

•   Allen, R. T. (1998). Concrete in Coastal Structures. London UK: Thomas Telford.

•   Allsop, N. W. (2005). International Conference on Coastlines, Structures and Breakwaters. Maritime Board of the
    Institutes of Civil Engineers. London UK.

•   Autoridad Portuaria del Caribe. (2011). Panorama Portuario en Cifras 2011. Retrieved October 2, 2012, from
    TERMINAL DE MOÍN: http://www.japdeva.go.cr/adm_portuaria/estadisticas.html

•   Bischof, B. (2008). Surface Currents in the Caribbean. Retrieved October 2012, from
    http://oceancurrents.rsmas.miami.edu/caribbean/caribbean_2.html

•   Bureau of Western Hemisphere Affairs. (2012, April). Background Note: Costa Rica. Retrieved November
    2012, from U.S Department of State: http://www.state.gov/r/pa/ei/bgn/2019.htm

•   Canadian Society of Civil Engineers. (2006). whatiscivilengineering.csce.ca. Retrieved September 24, 2012, from
    http://whatiscivilengineering.csce.ca/coastal_breakwaters.htm

•   Christian, C. D., & Palmer, G. N. (1997). A Deforming Finite Element Mesh for use in Moving One-Dimenstional
    Boundary Wave Problems. International Journal for Numberical Methods in Fluids , 407-420.

•   CIRIA. (2007). The Rock Manual 2nd Edition. London UK: CIRIA.

•   Delta Marine Consultants. (2012). Retrieved September 37, 2012, from xbloc.com: www.xbloc.com

•   Fisheries and Oceans Canada. (2010). Guidelines for the safe design of commercial shipping channels .
    Retrieved 10 28, 2012, from http;//www.ccg-gcc.gc.ca/folios/00020/docs/gdreport01-eng.pdf
References
•   Jordan, M. (1995). Tandem-40 Dockside Container Cranes and Thier impact on Terminals. Retrieved November 15, 2012, from
    http://www.liftech.net/Publications/Cranes/Procurement%20and%20New%20Developement/Dockside%20Container%20Cran
    e.pdf

•   Jorgen Fredsoe, R. D. (1992). Mechanics of coastal sediment transport. Singapore: World Scientific Publishing Co. Pte. Ltd.

•   Kamphuis, J. W. (2000). Introduction to coastal engineering and management. Singapore: World Scientific Publishing Co. Pte.
    Ltd.

•   Kweon, H., I.H, K., & J.L., L. (2010). Rip Current Control Behind Steel-Type Multiple Breakwaters. Journal of Coastal Research
    , 1779-1783.

•   Mangor, K. (2012, October 1). Detached Breakwaters. Retrieved from Coastal Wiki:
    http://www.coastalwiki.org/coastalwiki/Detached_breakwaters

•   Marle, G. v. (2012, March 23). Port Technology International. Retrieved November 2012, from
    http://www.porttechnology.org/blogs/moin_deal_means_a_new_era_for_costa_ricas_farmers/

•   Muttray, M., Reedijk, B., & M, K. (2003). Development of an Innovative Breakwater Armour Unit. Coasts and Ports Australasian
    Conference. New Zealand.

•   Takahashi, S., (1996). Design of Vertical Breakwaters. Port and Airport Research Institute, Japan.

•   Torum, A., & Sigurdarson, S. Guidlines for the Design and Construction of Berm Breakwaters. Proceedings of the International
    Conference, ICE, (pp. 373-377). United Kingdom .

•   US Army Corps of Engineers. (2011). Coastal Engineering Manual. Washington DC.

•   US Army Corps of Engineers. (1994). Numerical Model Study of Breakwaters at Grand Isle, Louisiana. Vicksburg: US Army Corps
    of Engineers.

Final presentation

  • 1.
  • 2.
    Outline • Project overview • Team • Objectives • Feasibility • Design • Numerical modelling • Field data • Choices & methodology Source: Maritime Information Services Ltd. (2011) • Conclusion • Economic impact • Review • Video tour
  • 3.
    Project team Gabriel Robin Christian Frederic Matthew Luc Beauchesne- Malyon Viau Dagenais Mantle Lendrum Sévigny
  • 4.
    Project support team Seth Logan Graham Frank M.A.Sc. P.Eng Dr. Ioan Nistor W.F. Baird & Associates Coastal W.F. Baird & Associates Coastal P.Eng Engineers Ltd. Engineers Ltd. Hydrotechnical Consultant Coastal Engineering Consultant Coastal Engineering Consultant
  • 5.
    Objectives • Increase thecapacity of Port Moìn, Costa Rica • Design a breakwater to protect the newly expanded port • Provide accommodations for Post-Panamax class container vessels • Construct 1.5km of new wharf and expand existing channel • Provide 50 hectares for container yard and facilities
  • 6.
    Location of theproject Caribbean Sea Panama Canal Pacific Ocean Source: Google Earth (2013)
  • 7.
    Source: US ArmyCorps of Engineers (2011)
  • 8.
    Current port layout Source: Google Earth (2013)
  • 9.
    Project justification Agriculture Other 7% 1% Manufacturing 25% • Costa Rica’s economic situation • Increase in global middle class Port Moín exports • Globalization of the food Tourism industry Plants Others 67% 1% 23% • Expansion of Panama Canal Vegetables 4% Fresh fruits Coffee 70% 2% Costa Rica's GDP Source: Autoridad Portuaria del Caribe (2012)
  • 10.
    Feasibility study -alternatives Alternative 1 Alternative 2 Alternative 3
  • 11.
    Preferred alternative Criteria: Alternative 3 Traffic • Cost Efficiency 17% Cost • Safety Material Avail. 33% 6% • Environmental impact • Material availability Env. Impact 11% Alternative efficiency • Traffic Cost Safety Env. impact Material avail. Traffic efficiency Final score 1 1st 3rd 1st 1st 3rd 2nd Safety 2 2nd 2nd 2nd 1st 1st33% 3rd 3 3rd 1st 3rd 1st 2nd 1st
  • 12.
    Numerical modeling ofwave hydrodynamics • Spectral Wave module – MIKE21 • Simulates growth, decay and transformation of waves • For analysis of wave climates in offshore and coastal areas • Provides details of wave-harbour interaction • Fast simulation times allow for iterative design and optimization • Breakwater was modelled as land; a limitation of MIKE 21
  • 13.
    Computational domain • Mesh generation and interpolation of available bathymetric data
  • 14.
    Statistical analysis • Offshore wave and wind conditions Wind climate Wave climate
  • 15.
    Model results ofsignificant height conditions
  • 16.
    Model results -wave data For the 200 years storm event approaching from 60 degrees direction (nautical) with following offshore wave characteristics: • Significant wave height: 5 m • Significant wave period : 12 s Model results, breakwater location: • Significant wave height, Hs : 3.41 m • Wave period, T01 : 8.92s • Maximum wave height, Hmax : 6.25 m • Peak wave period, Tpeak : 12.21s
  • 17.
    Modified and optimizedport layout Design modifications: • Breakwater rotated counter-clockwise by 15º and straightened • Southern wharf elongated to provide additional berth
  • 18.
    Field data –Geotechnical • Deep silty sand layer underlain by 3m of dense sand • Bed rock (limestone) located at approximately 17m below seafloor Soil layer Angle Cohesion (c') Unit Weight (γ‘) of friction (º) (kPa) (kN/m³) Silty Sand 32 2 19.62 Dense Sand 40 0 22.60
  • 19.
    Types of breakwater-wharfsystems Pile system type • Rubble mound breakwaters with piles Composite type • Horizontal composite breakwater Source: Takahashi (1996)
  • 20.
    Breakwater armouring –Options Quarry stones Accropodes Source: US Army Corps (2005) Source: Behance.net (2009)
  • 21.
    Design calculations forbreakwater with option 1 – Quarry stone
  • 22.
    Typical rubble-mound breakwater crosssection Source: CEM (2011)
  • 23.
    Selection of allowable overtoppingdischarge Source: Caitlin Pilkington (2007) Source: CEM (2011)
  • 24.
    Freeboard Source: CEM (2011) Rc = 4.75 m van der Meer and Janssen (1995)
  • 25.
    Armour unit weight Source: CEM (2011) M50 = 7710 kg Hudson’s equation, (1984)
  • 26.
    Toe berm design Source: CEM (2011)
  • 27.
    Final design drawing– Quarry stone
  • 29.
    Design calculations forbreakwater with option 2 – Accropodes
  • 30.
    Source: Arthur deGraauw (2007) M = 2400 kg Source: Concrete Layer Innovations (2012)
  • 31.
    Final design drawing– Accropodes
  • 33.
    Final design drawing– Breakwater head (Accropodes)
  • 35.
    Final design drawing– Parapet wall
  • 37.
    Potential failure modes– Rubble section • CEM recommends using the following “performance function” : G = Factored resistance – Factored loadings Where “G” must be greater than 0 for stability • Armour stability • G = 0.08 • Toe berm stability • G = 0.26 • Run-up • G = 0.02 • Scour for steady stream • G = 0.06 Sources: Caitlin Pilkington (2007), Baird (2010)
  • 38.
    Potential failure modes– Caisson section • Sliding • F.S.=4.91 • Overturning • F.S.=5.62 Source: Van De Meer (2007) • Bearing • F.S=3.02
  • 39.
    Slip surface analysis– GeoStudio F.S (left slope) : 1.64 F.S (right slope) : 1.49
  • 40.
    Economic analysis • 2010 • Port Moìn container traffic: 850 000 TEU • Total Port Moìn profits: 29 550 000 US$ • 2016 • Projected Port Moìn container traffic: 2 500 000 TEU • Projected Port Moìn profits: 87 000 000 US$ (an increase of almost 200% over a period of six years) TEU = Twenty foot equivalent container unit Sources: The Guardian UK (2010), Latin Infrastructure Quarterly (2011)
  • 41.
    Cost analysis Armouring Cost/ linear Cost of Cost of Cost of add. port Project cost Return meter of Breakwater dredging and harbour period Breakwater facilities (i=5%) (US$) (M US$) (M US$) (M US$) (M US$) (years) Quarry stone 250 300 216 81 739 1036 18.7 Accropode 208 300 180 81 739 1000 17.5
  • 42.
    Conclusions • SAFETY: The redesigned port will meet or exceed all safety criteria, providing safe harbour for years to come • EFFICIENCY: The harbour has been optimized for the protection of traffic and the minimization of downtime • PROFIT: The additional revenue will provide an acceptable return period, justifying the investment,.
  • 43.
  • 44.
    Acknowledgements • Dr. Ioan Nistor • Baird & Associates • DHI Water & Environment • Faculty of Engineering, University of Ottawa • Video music track: “Ave Maria”, composed by Franz Schubert (1825), performed by Daniel Perret (1995). All rights reserved.
  • 45.
  • 46.
    References • Administracion Portuaria. (2012). Panorama Portuario en Cifra 2011. Retrieved November 2012, from Autoridad Portuaria del Caribe: http://www.japdeva.go.cr/adm_portuaria/Estadisticas.html#223 • Allen, R. T. (1998). Concrete in Coastal Structures. London UK: Thomas Telford. • Allsop, N. W. (2005). International Conference on Coastlines, Structures and Breakwaters. Maritime Board of the Institutes of Civil Engineers. London UK. • Autoridad Portuaria del Caribe. (2011). Panorama Portuario en Cifras 2011. Retrieved October 2, 2012, from TERMINAL DE MOÍN: http://www.japdeva.go.cr/adm_portuaria/estadisticas.html • Bischof, B. (2008). Surface Currents in the Caribbean. Retrieved October 2012, from http://oceancurrents.rsmas.miami.edu/caribbean/caribbean_2.html • Bureau of Western Hemisphere Affairs. (2012, April). Background Note: Costa Rica. Retrieved November 2012, from U.S Department of State: http://www.state.gov/r/pa/ei/bgn/2019.htm • Canadian Society of Civil Engineers. (2006). whatiscivilengineering.csce.ca. Retrieved September 24, 2012, from http://whatiscivilengineering.csce.ca/coastal_breakwaters.htm • Christian, C. D., & Palmer, G. N. (1997). A Deforming Finite Element Mesh for use in Moving One-Dimenstional Boundary Wave Problems. International Journal for Numberical Methods in Fluids , 407-420. • CIRIA. (2007). The Rock Manual 2nd Edition. London UK: CIRIA. • Delta Marine Consultants. (2012). Retrieved September 37, 2012, from xbloc.com: www.xbloc.com • Fisheries and Oceans Canada. (2010). Guidelines for the safe design of commercial shipping channels . Retrieved 10 28, 2012, from http;//www.ccg-gcc.gc.ca/folios/00020/docs/gdreport01-eng.pdf
  • 47.
    References • Jordan, M. (1995). Tandem-40 Dockside Container Cranes and Thier impact on Terminals. Retrieved November 15, 2012, from http://www.liftech.net/Publications/Cranes/Procurement%20and%20New%20Developement/Dockside%20Container%20Cran e.pdf • Jorgen Fredsoe, R. D. (1992). Mechanics of coastal sediment transport. Singapore: World Scientific Publishing Co. Pte. Ltd. • Kamphuis, J. W. (2000). Introduction to coastal engineering and management. Singapore: World Scientific Publishing Co. Pte. Ltd. • Kweon, H., I.H, K., & J.L., L. (2010). Rip Current Control Behind Steel-Type Multiple Breakwaters. Journal of Coastal Research , 1779-1783. • Mangor, K. (2012, October 1). Detached Breakwaters. Retrieved from Coastal Wiki: http://www.coastalwiki.org/coastalwiki/Detached_breakwaters • Marle, G. v. (2012, March 23). Port Technology International. Retrieved November 2012, from http://www.porttechnology.org/blogs/moin_deal_means_a_new_era_for_costa_ricas_farmers/ • Muttray, M., Reedijk, B., & M, K. (2003). Development of an Innovative Breakwater Armour Unit. Coasts and Ports Australasian Conference. New Zealand. • Takahashi, S., (1996). Design of Vertical Breakwaters. Port and Airport Research Institute, Japan. • Torum, A., & Sigurdarson, S. Guidlines for the Design and Construction of Berm Breakwaters. Proceedings of the International Conference, ICE, (pp. 373-377). United Kingdom . • US Army Corps of Engineers. (2011). Coastal Engineering Manual. Washington DC. • US Army Corps of Engineers. (1994). Numerical Model Study of Breakwaters at Grand Isle, Louisiana. Vicksburg: US Army Corps of Engineers.