Download to read offline
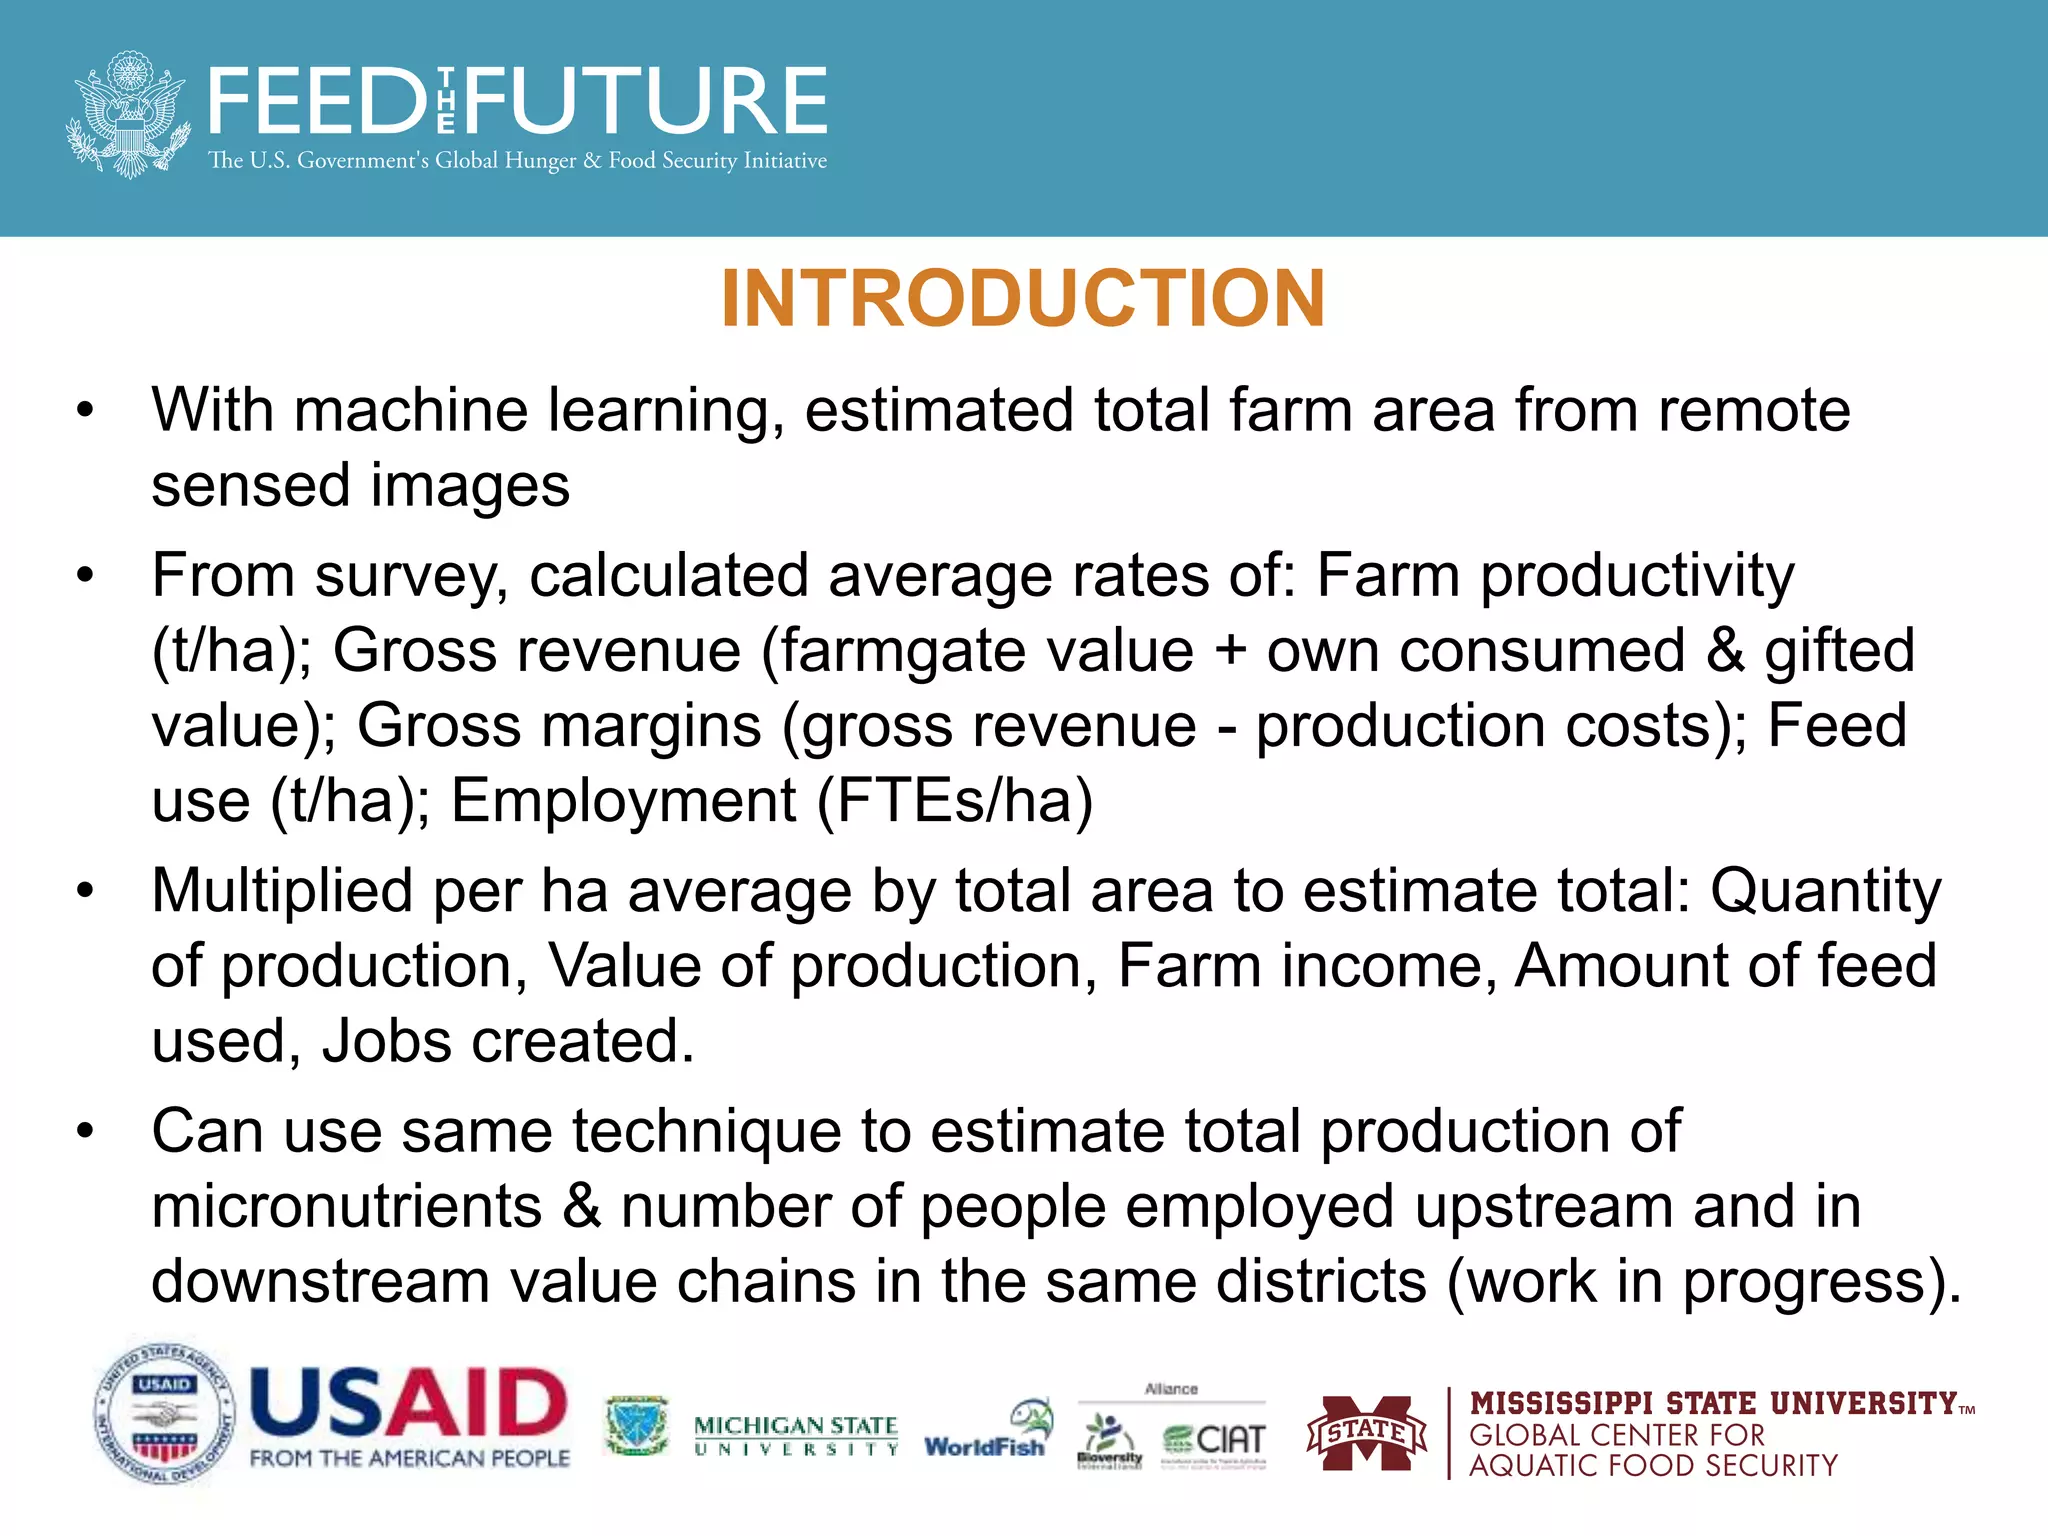
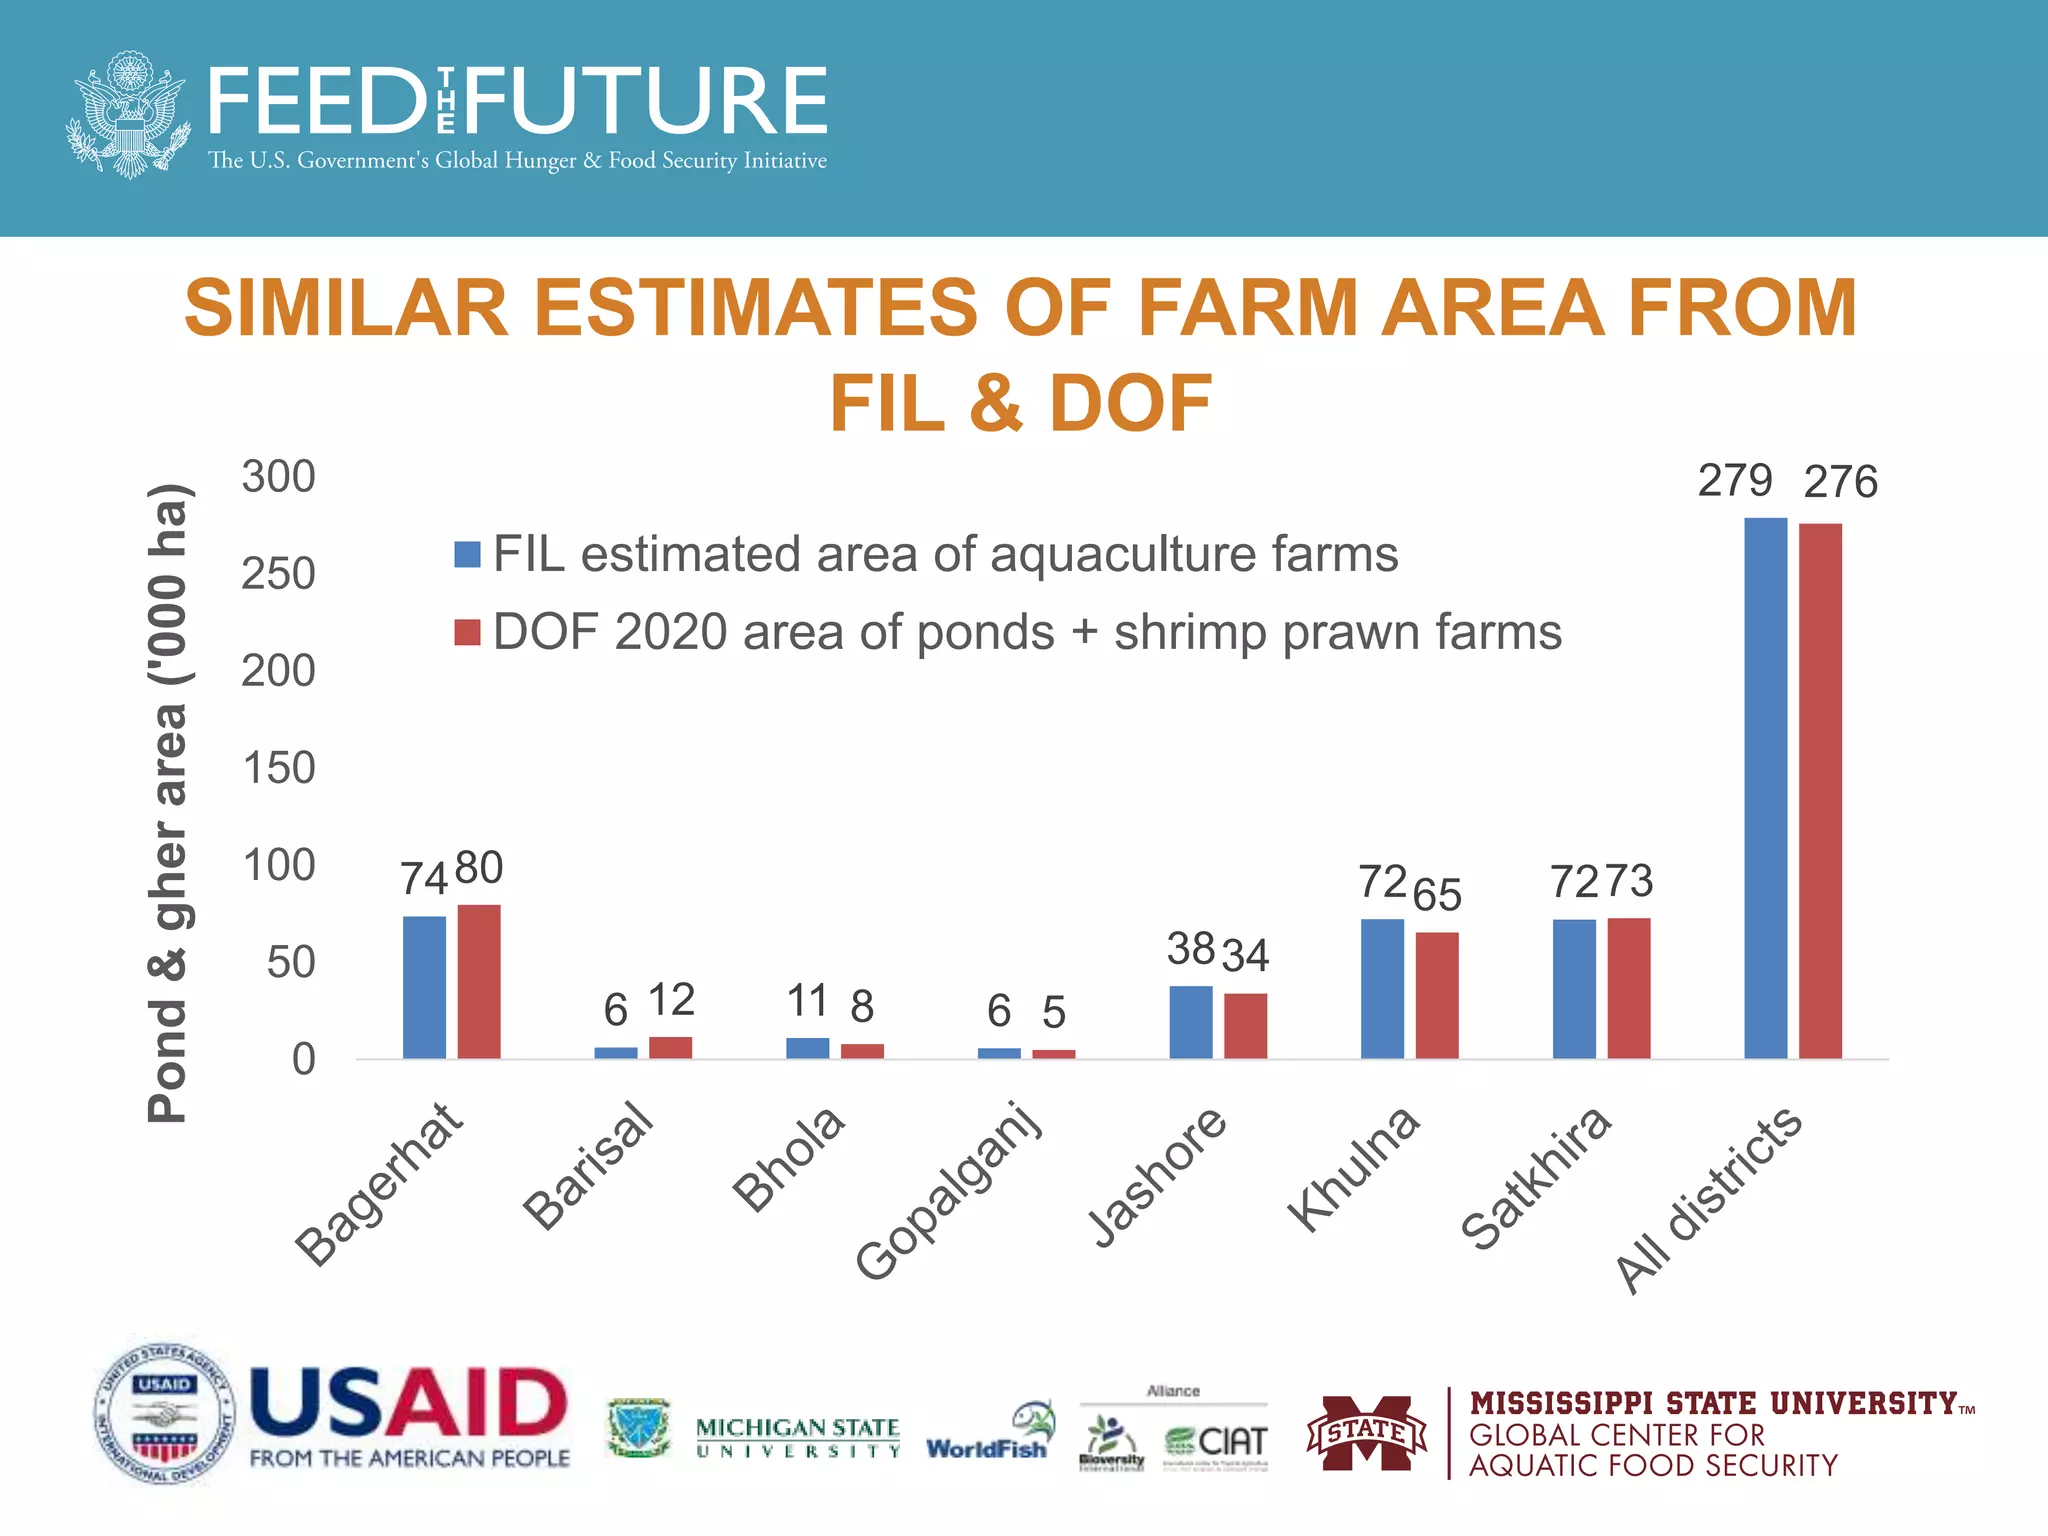
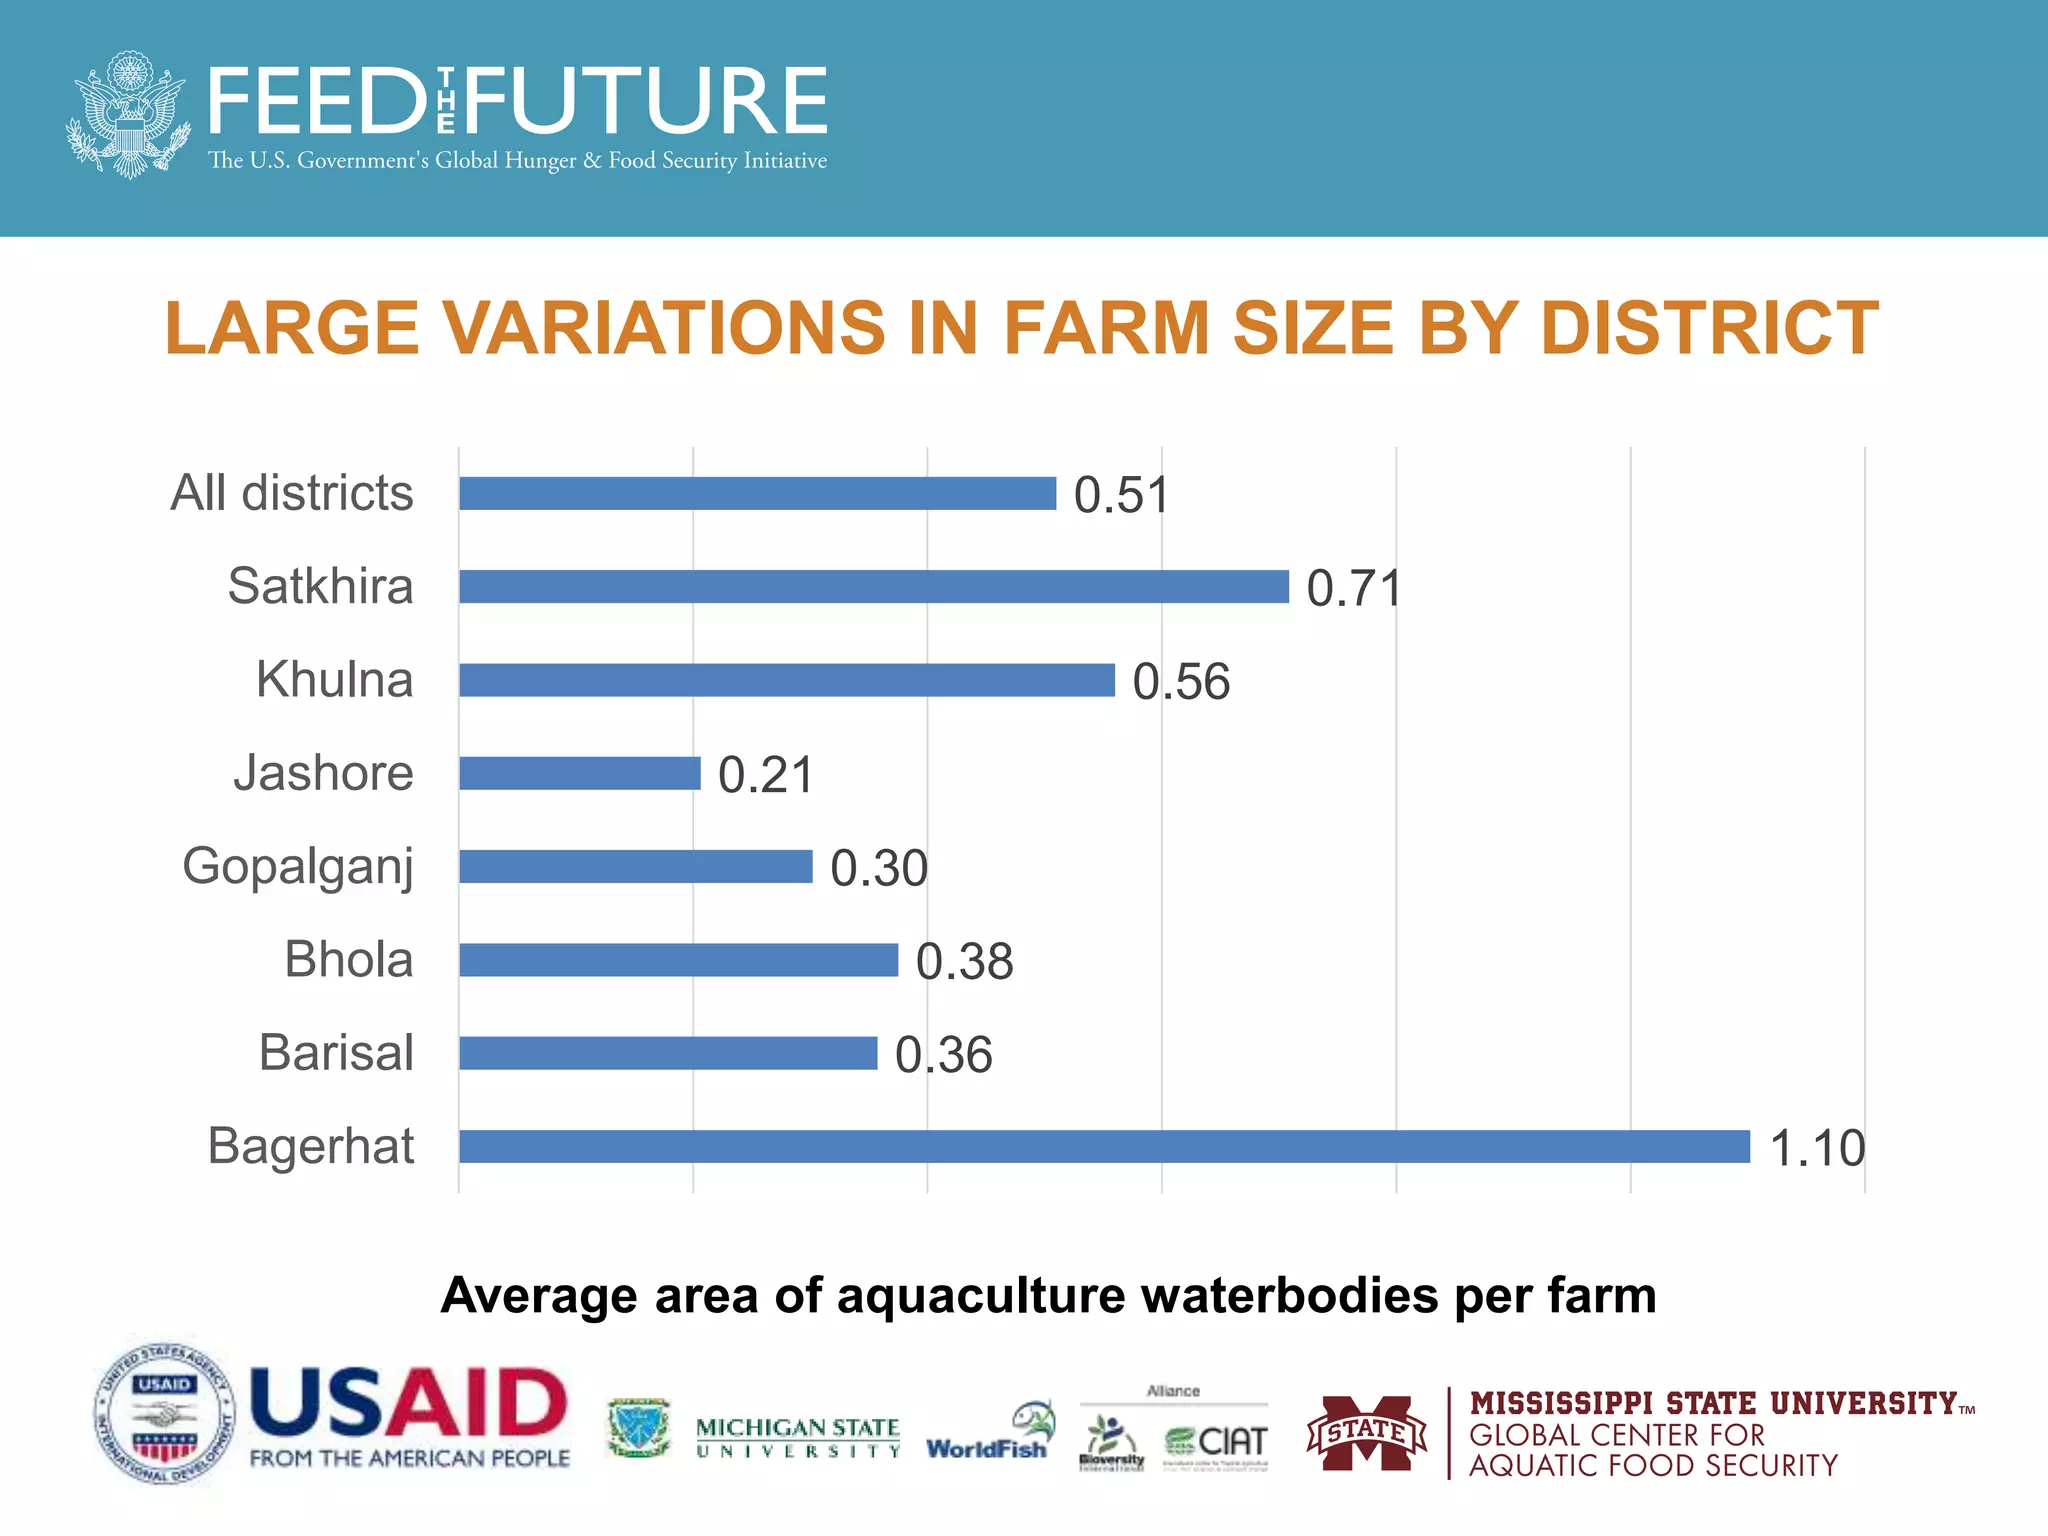
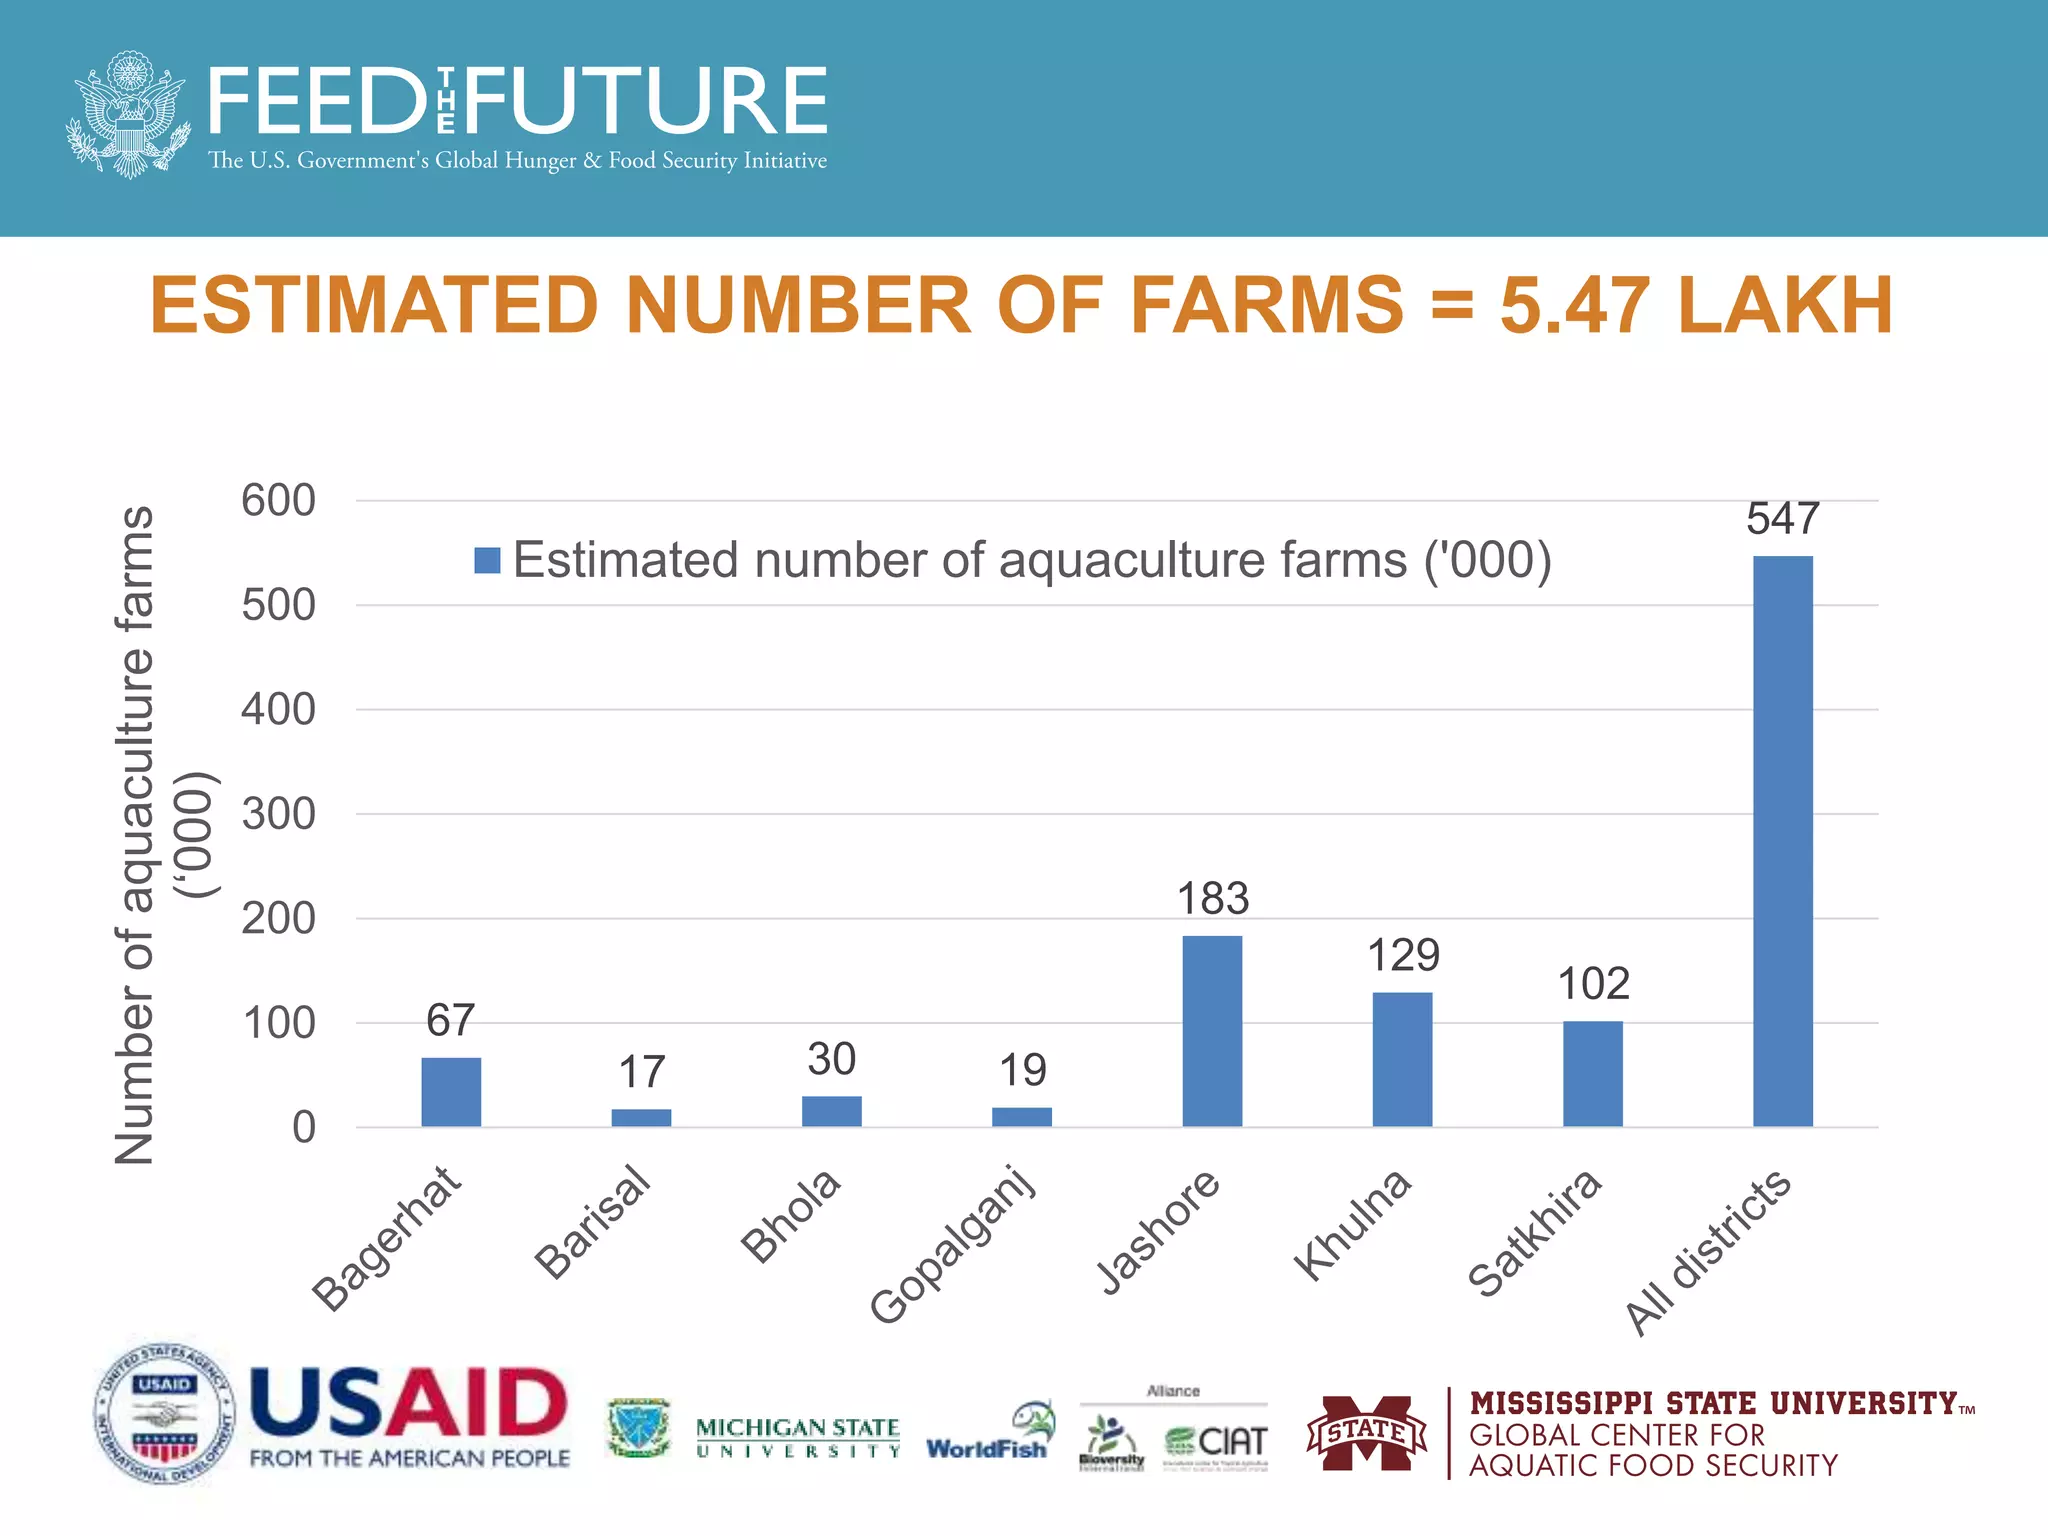
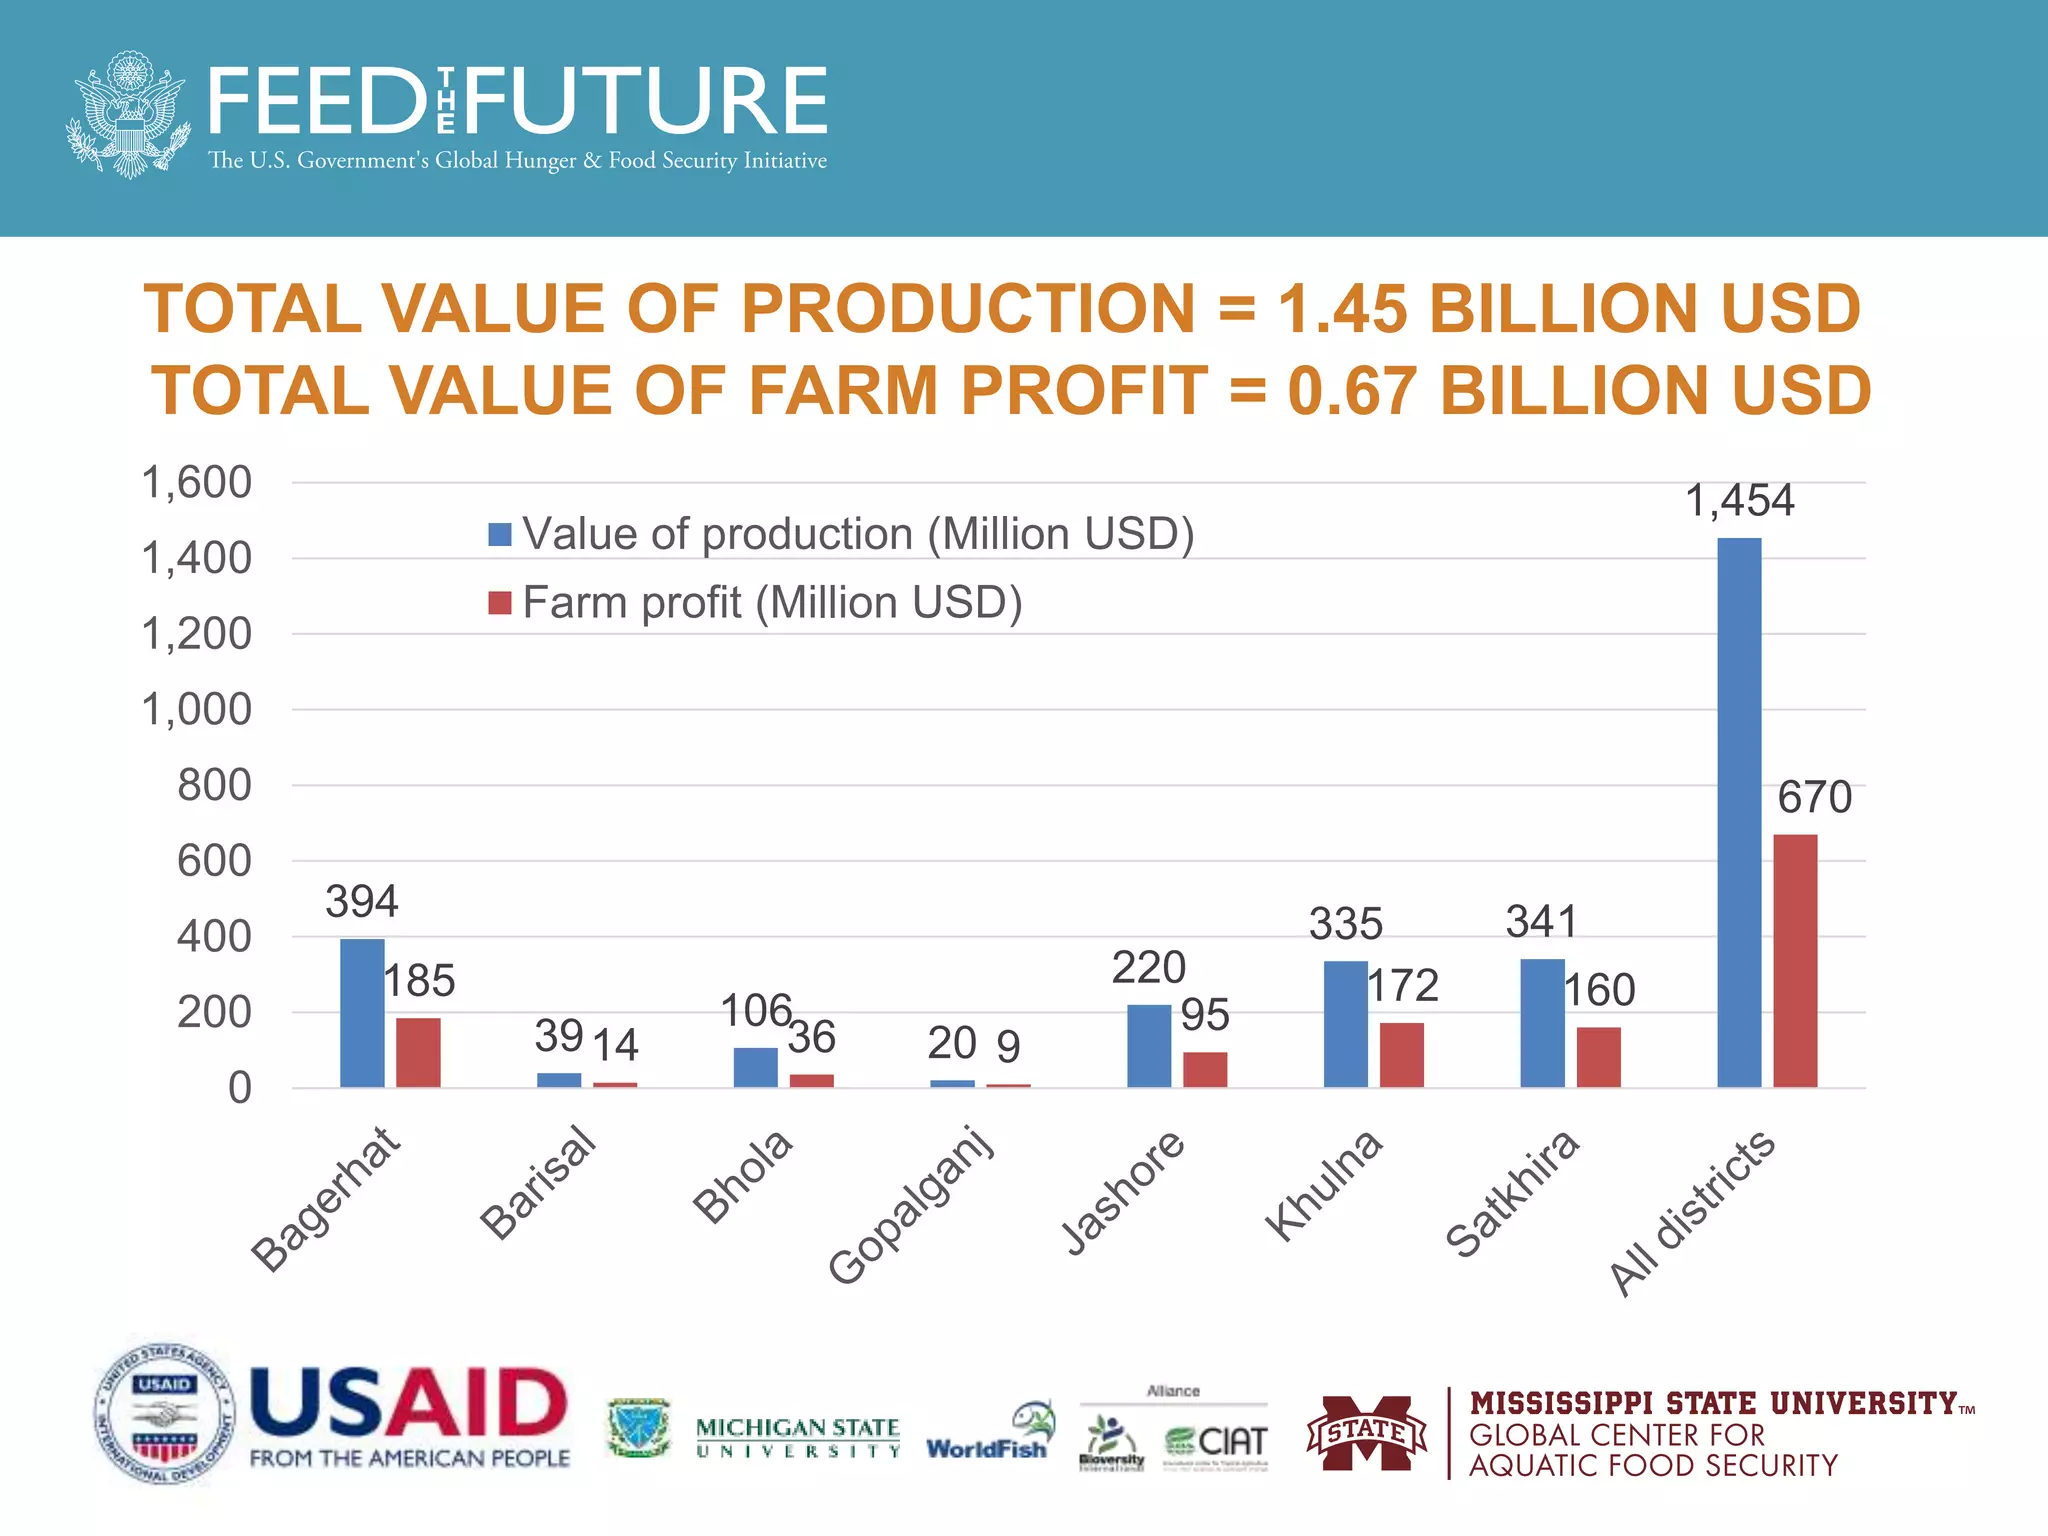
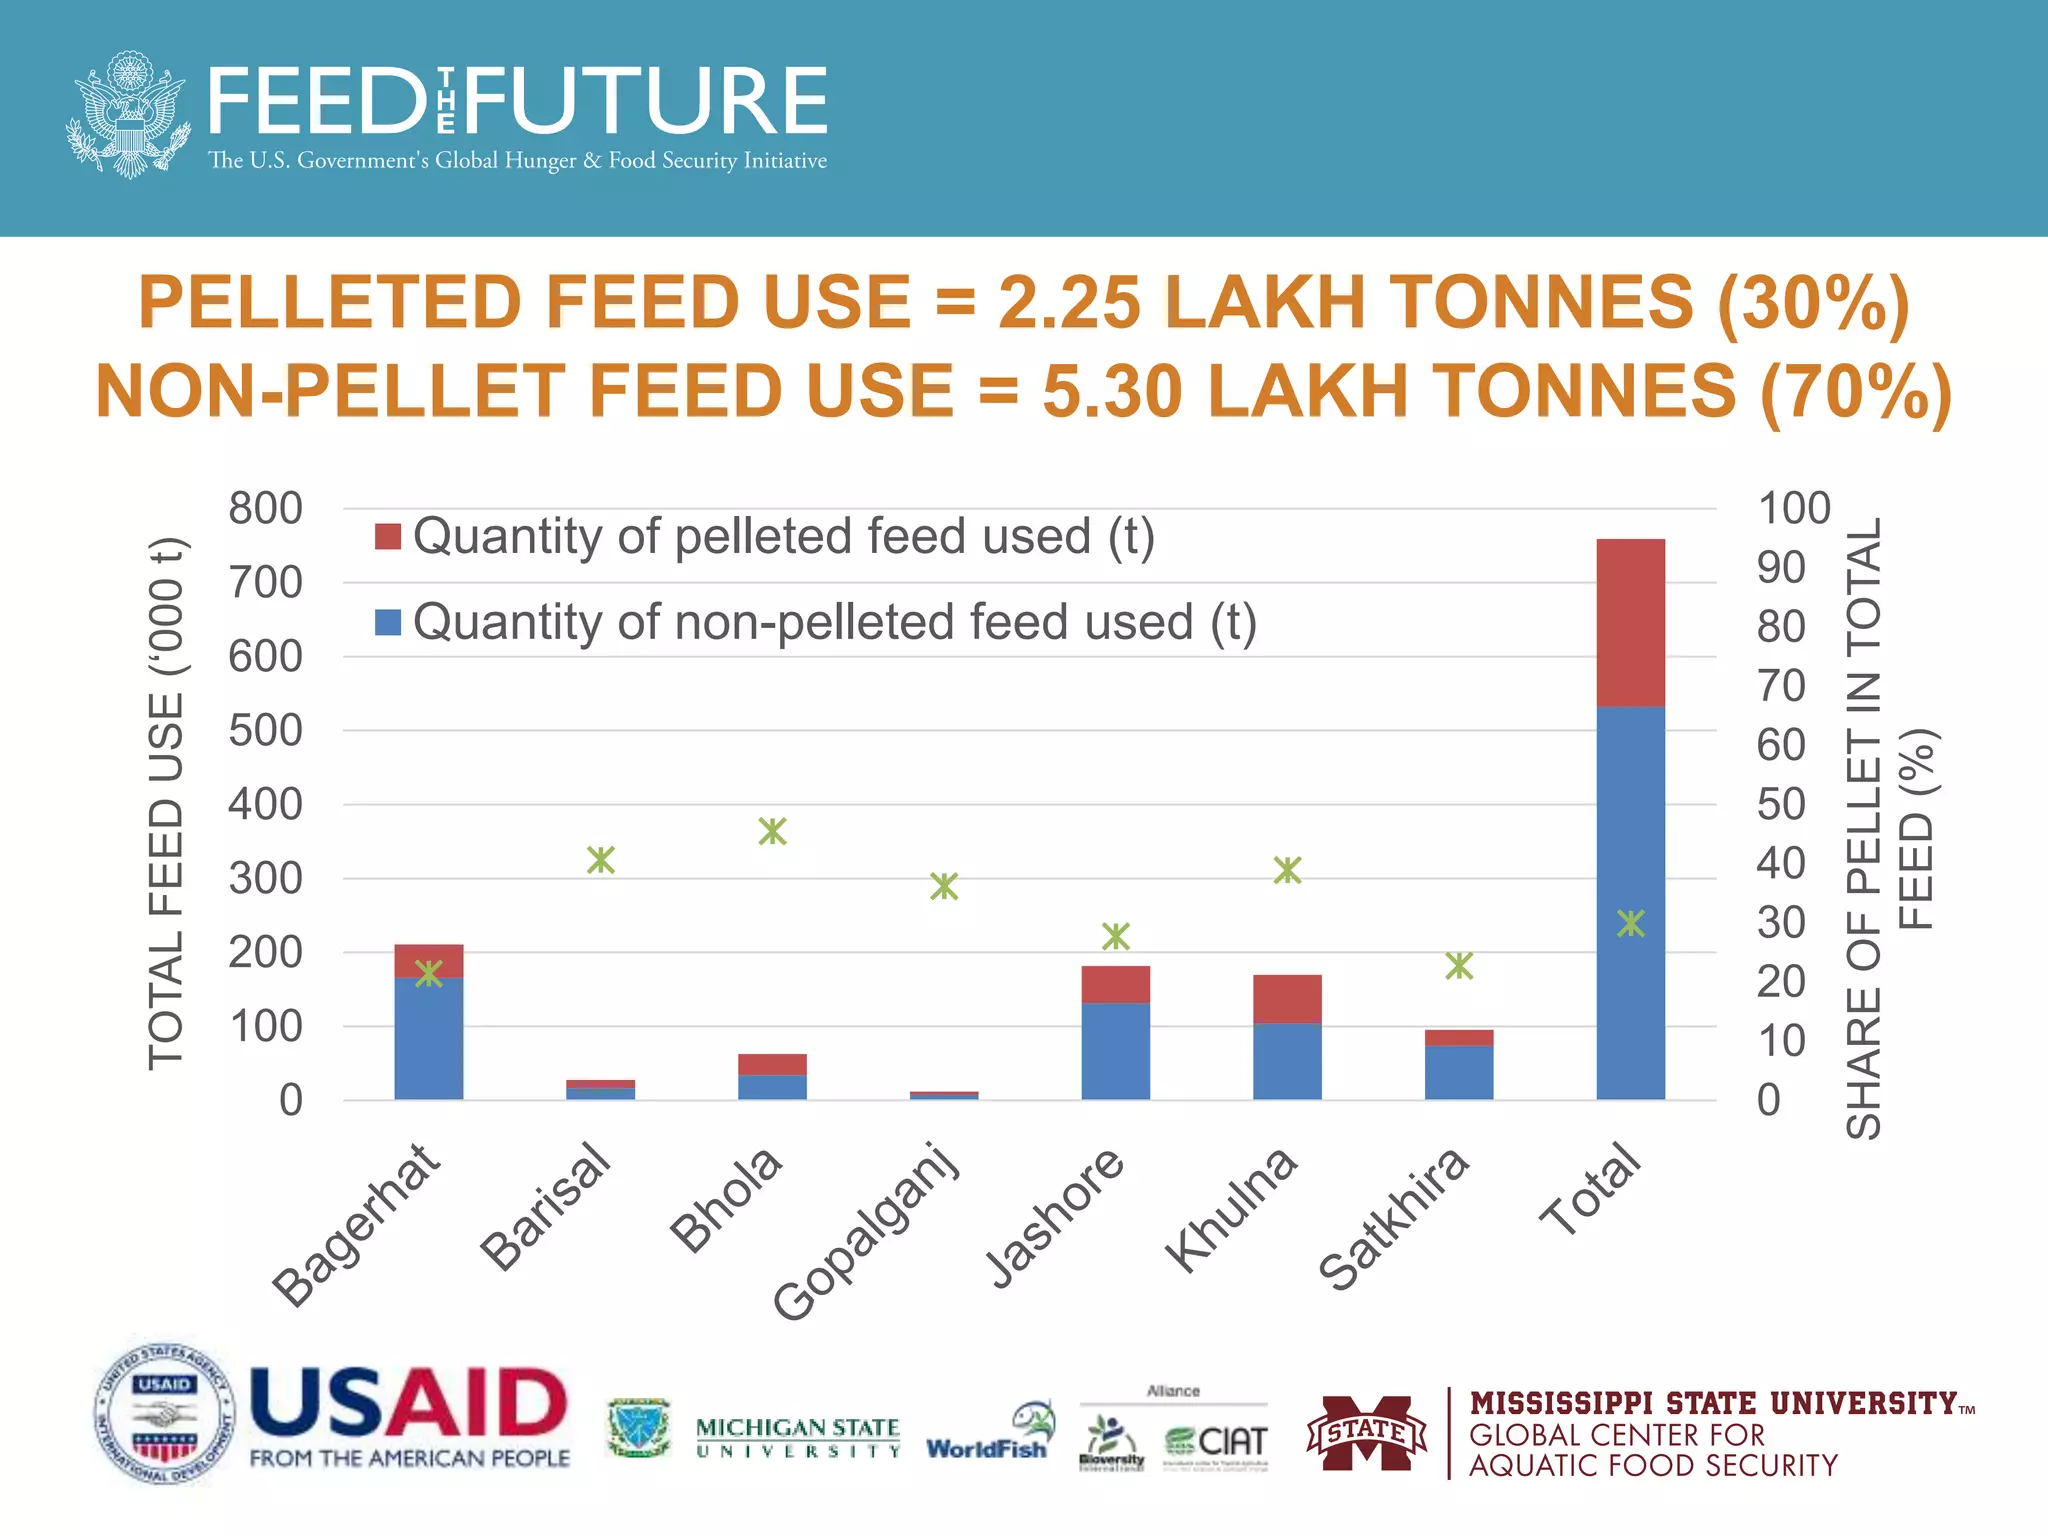
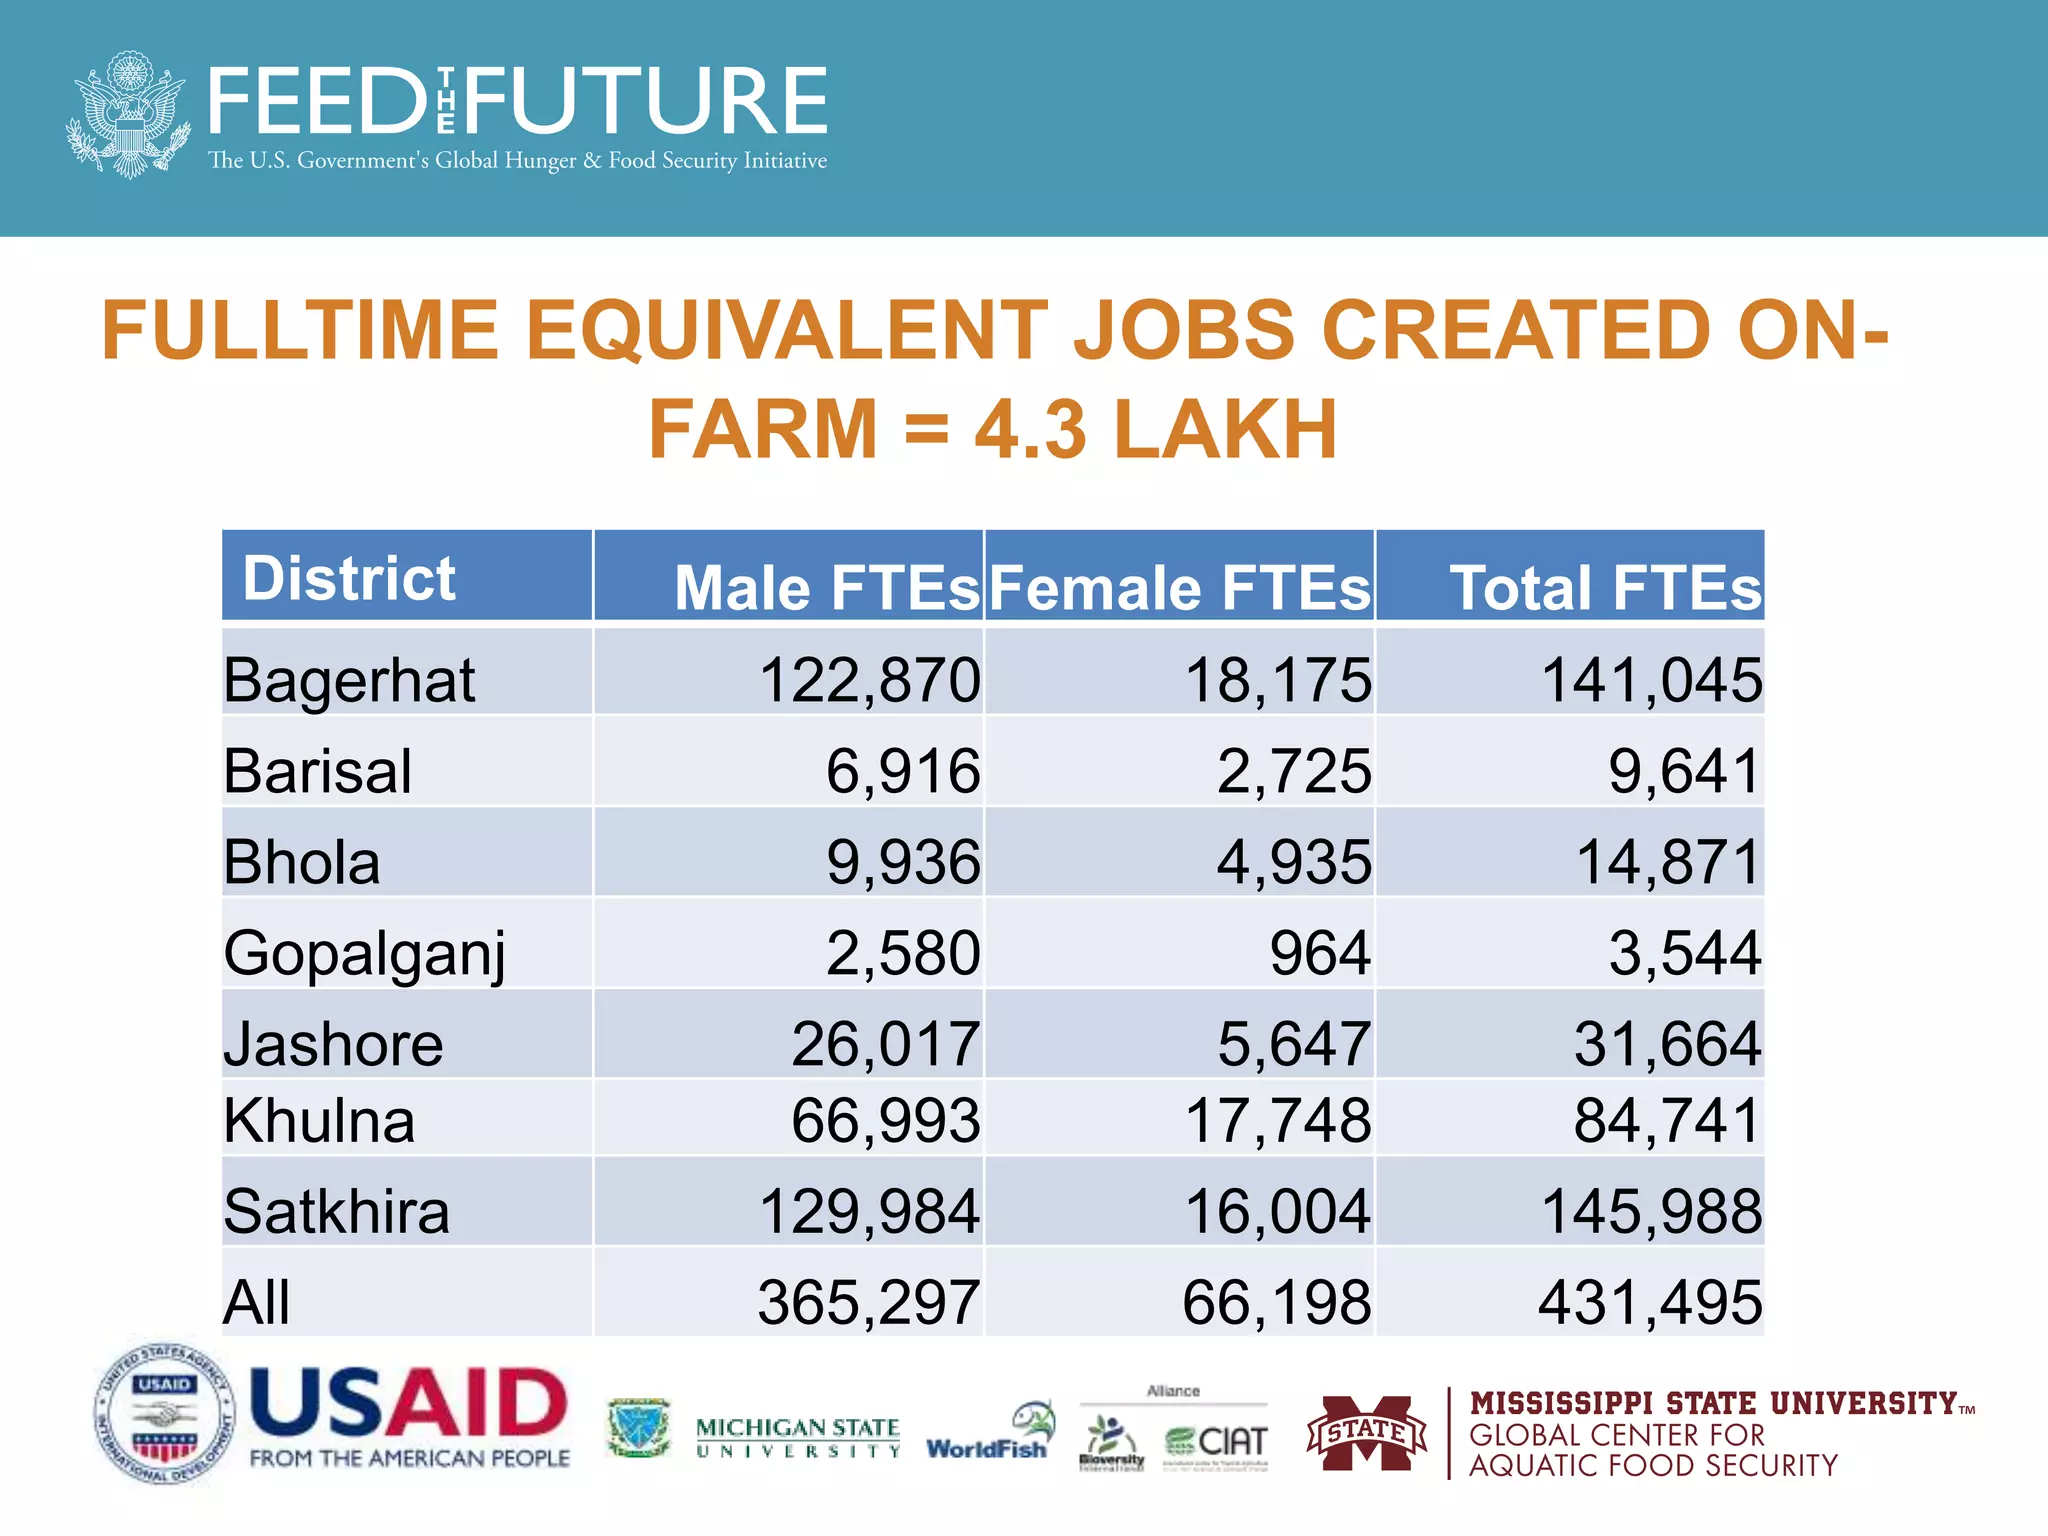
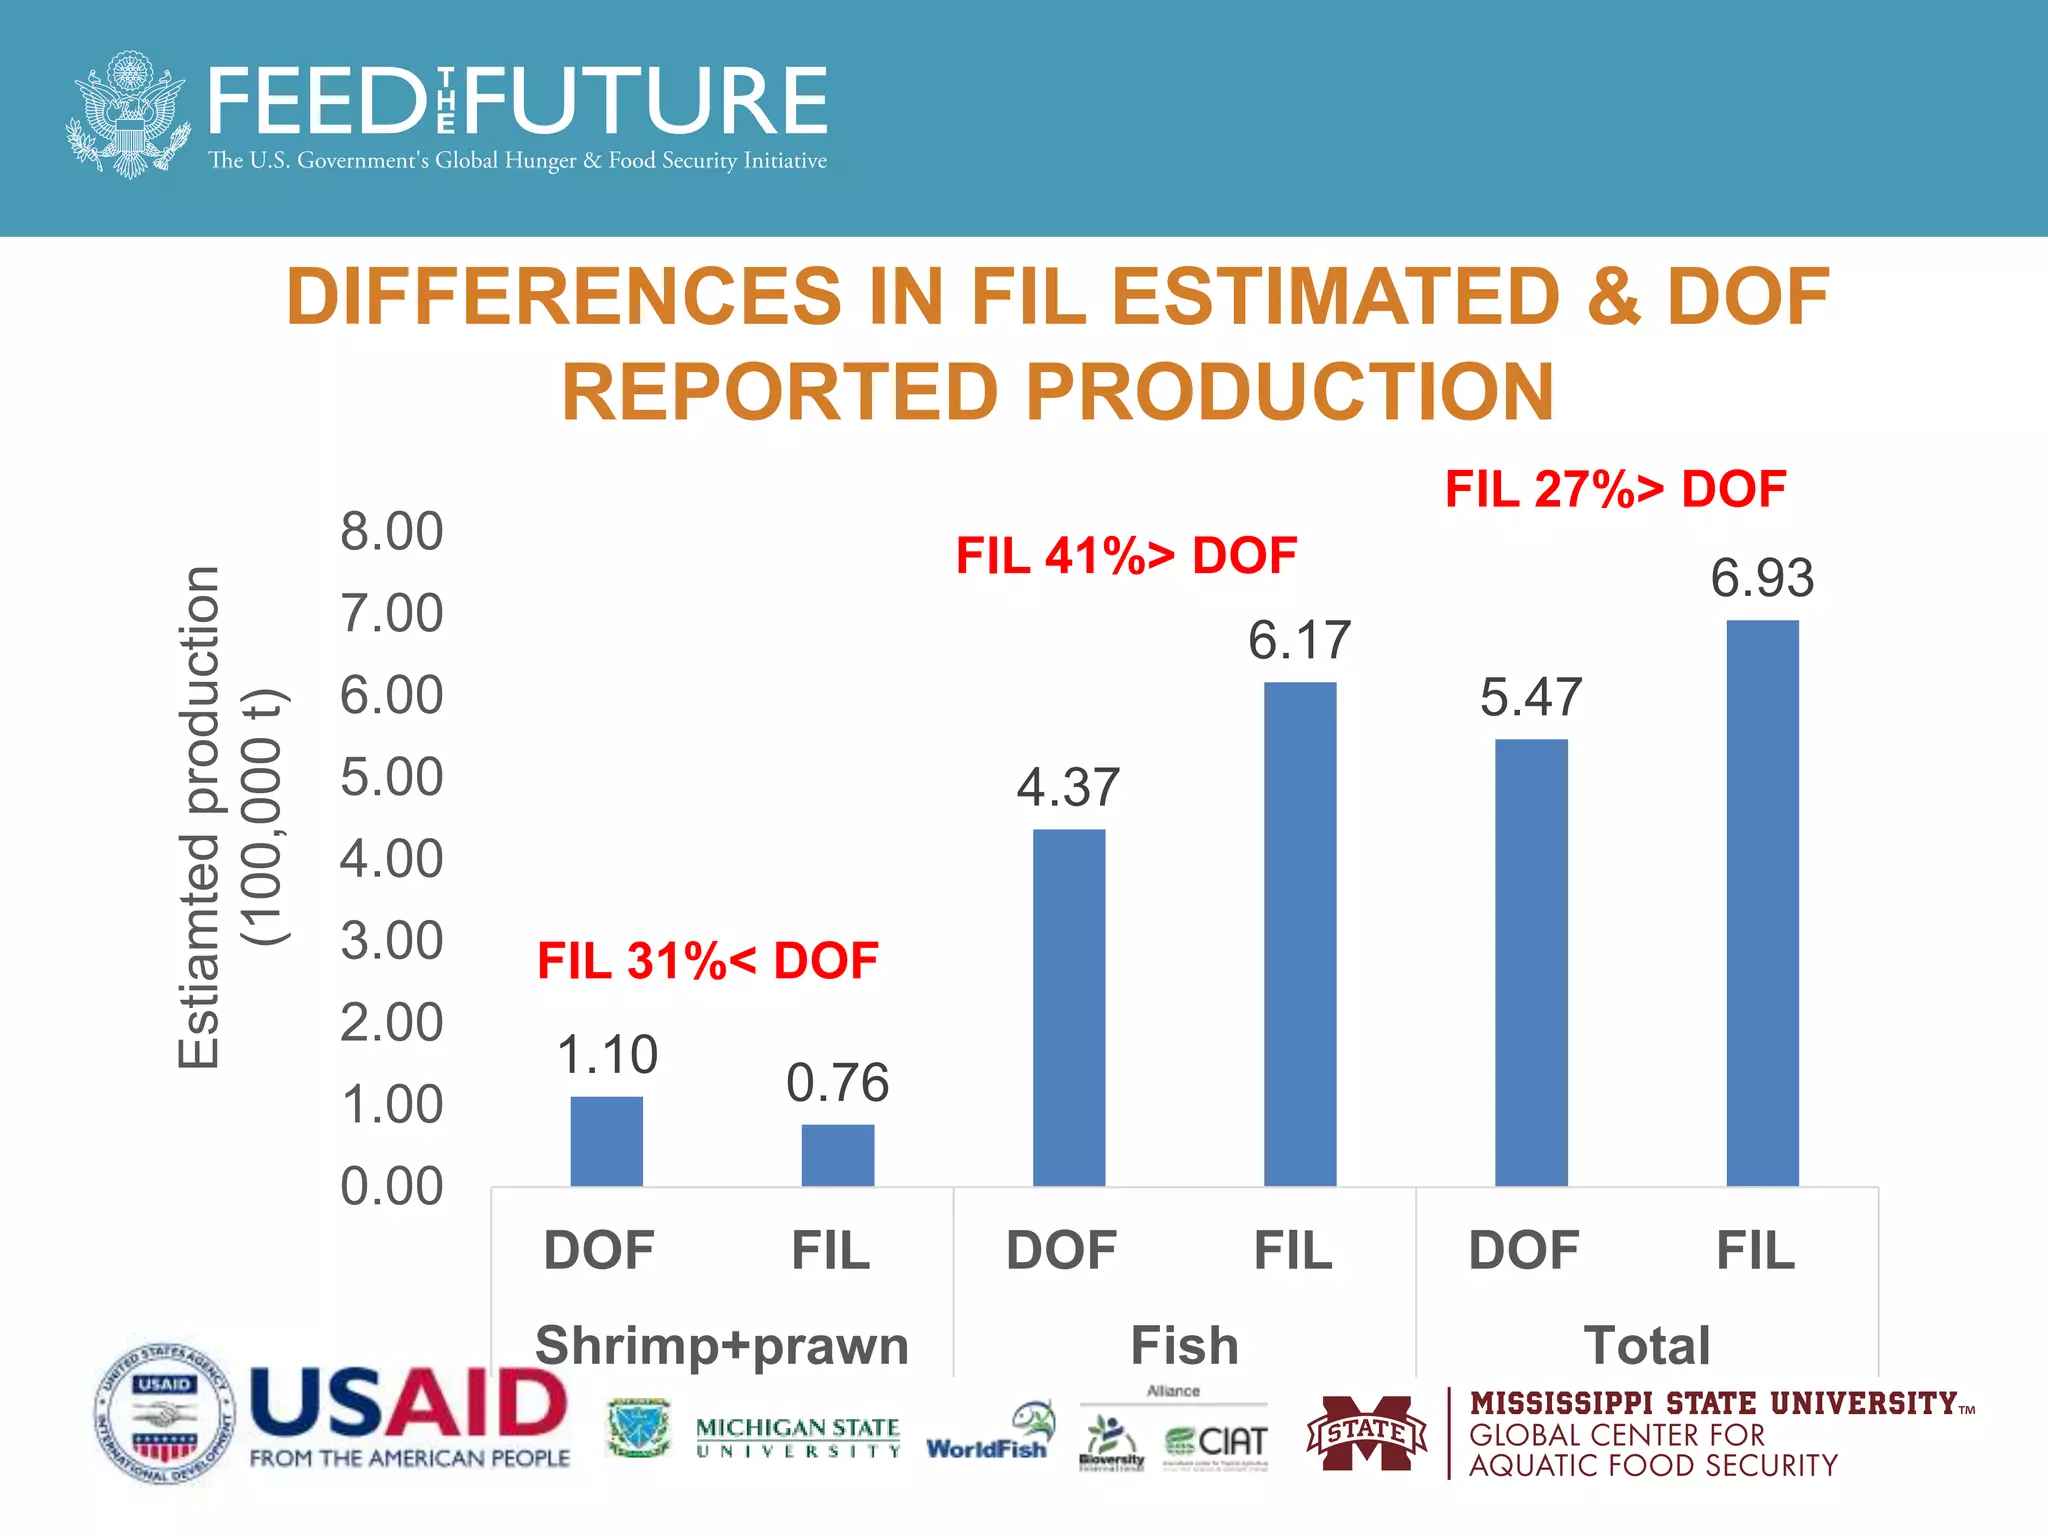


The document summarizes results from a combined survey and remote sensing study of aquaculture farms in seven districts in Bangladesh. It finds that: 1) Machine learning estimates of total farm area were similar to government statistics, and calculated average production values, incomes, feed use, and jobs per hectare to estimate totals for the districts. 2) The study estimated a total value of aquaculture production of $1.45 billion USD and farm profits of $670 million USD across the seven districts. 3) The results reveal the potential of combining remote sensing, machine learning, and representative surveys to estimate a wide range of sector statistics, though some estimates differed from government reports.


