SlideShare a Scribd company logo
Office: (832) 326-5787
Courtney@CourtneyFoster.com
www.ReferredRealtyMT.com
Courtney Foster
Referred Realty Group
Each data point is one month of activity. Data is from November 19, 2018.
All data from Big Sky Country MLS, a subsidiary of the Gallatin Association of REALTORS®. InfoSparks © 2018 ShowingTime.
October Homes for Sale
Bozeman & Belgrade & Three Forks & Big Sky: Residential
0
100
200
300
400
500
2016 2017 2018
402 409
347
+1.7% -15.2%
89 82
120
-7.9% +46.3%
29 32
45
+10.3% +40.6%
227
185
123
-18.5% -33.5%
Bozeman Belgrade Three Forks Big Sky
Office: (832) 326-5787
Courtney@CourtneyFoster.com
www.ReferredRealtyMT.com
Courtney Foster
Referred Realty Group
Each data point is one month of activity. Data is from November 19, 2018.
All data from Big Sky Country MLS, a subsidiary of the Gallatin Association of REALTORS®. InfoSparks © 2018 ShowingTime.
October New Listings
Bozeman & Belgrade & Three Forks & Big Sky: Residential
0
20
40
60
80
100
120
140
2016 2017 2018
98
111
122
+13.3% +9.9%
34
39
42
+14.7% +7.7%
1 3 5
+200.0% +66.7%
27 28
14
+3.7% -50.0%
Bozeman Belgrade Three Forks Big Sky
Office: (832) 326-5787
Courtney@CourtneyFoster.com
www.ReferredRealtyMT.com
Courtney Foster
Referred Realty Group
Each data point is one month of activity. Data is from November 19, 2018.
All data from Big Sky Country MLS, a subsidiary of the Gallatin Association of REALTORS®. InfoSparks © 2018 ShowingTime.
October Pending Sales
Bozeman & Belgrade & Three Forks & Big Sky: Residential
0
25
50
75
100
125
150
2016 2017 2018
103
132 133
+28.2% +0.8%
33
40
28
+21.2% -30.0%
1
7 8
+600.0% +14.3%
16 15 15
-6.3% 0.0%
Bozeman Belgrade Three Forks Big Sky
Office: (832) 326-5787
Courtney@CourtneyFoster.com
www.ReferredRealtyMT.com
Courtney Foster
Referred Realty Group
Each data point is one month of activity. Data is from November 19, 2018.
All data from Big Sky Country MLS, a subsidiary of the Gallatin Association of REALTORS®. InfoSparks © 2018 ShowingTime.
October Closed Sales
Bozeman & Belgrade & Three Forks & Big Sky: Residential
0
25
50
75
100
125
150
175
2016 2017 2018
128
134
157
+4.7% +17.2%
39
44
36
+12.8% -18.2%
10 12
5
+20.0% -58.3%
30
34
27
+13.3% -20.6%
Bozeman Belgrade Three Forks Big Sky
Office: (832) 326-5787
Courtney@CourtneyFoster.com
www.ReferredRealtyMT.com
Courtney Foster
Referred Realty Group
Each data point is activity year to date. Data is from November 19, 2018.
All data from Big Sky Country MLS, a subsidiary of the Gallatin Association of REALTORS®. InfoSparks © 2018 ShowingTime.
October Closed Sales
Bozeman & Belgrade & Three Forks & Big Sky: Residential
0
250
500
750
1,000
1,250
1,500
2016 2017 2018
1,356
1,264
1,327
-6.8% +5.0%
366
407 400
+11.2% -1.7%
66 56 72
-15.2% +28.6%
205
231 241
+12.7% +4.3%
Bozeman Belgrade Three Forks Big Sky
Office: (832) 326-5787
Courtney@CourtneyFoster.com
www.ReferredRealtyMT.com
Courtney Foster
Referred Realty Group
Each data point is one month of activity. Data is from November 19, 2018.
All data from Big Sky Country MLS, a subsidiary of the Gallatin Association of REALTORS®. InfoSparks © 2018 ShowingTime.
October Average Sales Price
Bozeman & Belgrade & Three Forks & Big Sky: Residential
$0
$0.2M
$0.4M
$0.6M
$0.8M
$1.0M
$1.2M
$1.4M
2016 2017 2018
$434,029
$414,114
$512,644
-4.6% +23.8%
$277,112 $283,305
$402,847
+2.2% +42.2%
$220,640
$262,950 $266,680
+19.2% +1.4%
$411,643
$617,635
$1,151,542
+50.0% +86.4%
Bozeman Belgrade Three Forks Big Sky
Office: (832) 326-5787
Courtney@CourtneyFoster.com
www.ReferredRealtyMT.com
Courtney Foster
Referred Realty Group
Each data point is one month of activity. Data is from November 19, 2018.
All data from Big Sky Country MLS, a subsidiary of the Gallatin Association of REALTORS®. InfoSparks © 2018 ShowingTime.
October Months Supply of Homes for Sale
Bozeman & Belgrade & Three Forks & Big Sky: Residential
0.0
2.0
4.0
6.0
8.0
10.0
12.0
2016 2017 2018
3.0
3.2
2.7
+6.7% -15.6%
2.5
2.0
3.2
-20.0% +60.0%
4.4
5.5 5.6
+25.0% +1.8%
10.8
8.3
5.3
-23.1% -36.1%
Bozeman Belgrade Three Forks Big Sky
Office: (832) 326-5787
Courtney@CourtneyFoster.com
www.ReferredRealtyMT.com
Courtney Foster
Referred Realty Group
Each data point is one month of activity. Data is from November 19, 2018.
All data from Big Sky Country MLS, a subsidiary of the Gallatin Association of REALTORS®. InfoSparks © 2018 ShowingTime.
October Median Days on Market
Bozeman & Belgrade & Three Forks & Big Sky: Residential
0
20
40
60
80
100
120
2016 2017 2018
40
23
36
-42.5% +56.5%
12 12
34
0.0% +183.3%
14
35
84
+150.0% +140.0%
97
81
96
-16.5% +18.5%
Bozeman Belgrade Three Forks Big Sky
Office: (832) 326-5787
Courtney@CourtneyFoster.com
www.ReferredRealtyMT.com
Courtney Foster
Referred Realty Group
Each data point is one month of activity. Data is from November 19, 2018.
All data from Big Sky Country MLS, a subsidiary of the Gallatin Association of REALTORS®. InfoSparks © 2018 ShowingTime.
October Average Price Per Square Foot
Bozeman & Belgrade & Three Forks & Big Sky: Residential
$0
$100
$200
$300
$400
$500
2016 2017 2018
$200 $198
$221
-1.0% +11.6%
$139
$159
$184
+14.4% +15.7%
$123
$149
$173
+21.1% +16.1%
$241
$326
$445
+35.3% +36.5%
Bozeman Belgrade Three Forks Big Sky
Local Market Update – October 2018
This is a research tool provided by the Big Sky Country MLS
Bozeman City Limits
1NE, 1NW, 1SM, 1SK
Single Family October Year to Date
Key Metrics 2017 2018 % Change Thru 10-2017 Thru 10-2018 % Change
New Listings 36 47 + 30.6% 603 632 + 4.8%
Pending Sales 46 60 + 30.4% 509 538 + 5.7%
Closed Sales 55 68 + 23.6% 482 530 + 10.0%
Days on Market Until Sale 48 52 + 8.3% 57 47 - 17.5%
Median Sales Price* $388,000 $444,450 + 14.5% $380,000 $427,500 + 12.5%
Average Sales Price* $460,574 $479,082 + 4.0% $423,288 $476,753 + 12.6%
Percent of List Price Received* 98.2% 98.1% - 0.1% 99.2% 99.0% - 0.2%
Inventory of Homes for Sale 135 114 - 15.6% –– –– ––
Months Supply of Inventory 2.8 2.3 - 17.9% –– –– ––
Condo/Townhouse October Year to Date
Key Metrics 2017 2018 % Change Thru 10-2017 Thru 10-2018 % Change
New Listings 29 38 + 31.0% 494 439 - 11.1%
Pending Sales 32 39 + 21.9% 396 396 0.0%
Closed Sales 32 34 + 6.3% 350 376 + 7.4%
Days on Market Until Sale 28 45 + 60.7% 63 55 - 12.7%
Median Sales Price* $242,450 $285,078 + 17.6% $270,000 $300,000 + 11.1%
Average Sales Price* $270,981 $338,018 + 24.7% $307,887 $342,550 + 11.3%
Percent of List Price Received* 99.2% 99.4% + 0.2% 99.7% 99.3% - 0.4%
Inventory of Homes for Sale 102 91 - 10.8% –– –– ––
Months Supply of Inventory 2.8 2.5 - 10.7% –– –– ––
* Does not account for sale concessions and/or downpayment assistance. | Percent changes are calculated using rounded figures and can sometimes look extreme due to small sample size.
A rolling 12-month calculation represents the current month and the 11 months prior in a single data point. If no activity occurred during a month, the line extends to the next available data point.
Median Sales Price - Single Family
Rolling 12-Month Calculation Gallatin County
Bozeman City Limits
1-2003 1-2005 1-2007 1-2009 1-2011 1-2013 1-2015 1-2017
$150,000
$200,000
$250,000
$300,000
$350,000
$400,000
$450,000
Median Sales Price - Condo
Rolling 12-Month Calculation Gallatin County
Bozeman City Limits
1-2003 1-2005 1-2007 1-2009 1-2011 1-2013 1-2015 1-2017
$100,000
$150,000
$200,000
$250,000
$300,000
Current as of November 10, 2018. All data from Big Sky Country Multiple Listing Service®. Report © 2018 ShowingTime.
Local Market Update – October 2018
This is a research tool provided by the Big Sky Country MLS
Belgrade
3B, 3N, 3S
Single Family October Year to Date
Key Metrics 2017 2018 % Change Thru 10-2017 Thru 10-2018 % Change
New Listings 36 37 + 2.8% 377 370 - 1.9%
Pending Sales 34 23 - 32.4% 324 281 - 13.3%
Closed Sales 32 29 - 9.4% 304 281 - 7.6%
Days on Market Until Sale 26 45 + 73.1% 38 37 - 2.6%
Median Sales Price* $289,200 $312,000 + 7.9% $286,700 $317,400 + 10.7%
Average Sales Price* $302,658 $380,316 + 25.7% $322,002 $350,860 + 9.0%
Percent of List Price Received* 99.3% 98.0% - 1.3% 99.1% 98.9% - 0.2%
Inventory of Homes for Sale 64 88 + 37.5% –– –– ––
Months Supply of Inventory 2.1 3.3 + 57.1% –– –– ––
Condo/Townhouse October Year to Date
Key Metrics 2017 2018 % Change Thru 10-2017 Thru 10-2018 % Change
New Listings 1 1 0.0% 81 116 + 43.2%
Pending Sales 4 4 0.0% 79 93 + 17.7%
Closed Sales 10 4 - 60.0% 71 84 + 18.3%
Days on Market Until Sale 9 37 + 311.1% 28 29 + 3.6%
Median Sales Price* $189,500 $204,500 + 7.9% $185,000 $210,500 + 13.8%
Average Sales Price* $182,540 $207,925 + 13.9% $184,285 $221,476 + 20.2%
Percent of List Price Received* 98.9% 99.7% + 0.8% 99.4% 99.6% + 0.2%
Inventory of Homes for Sale 5 20 + 300.0% –– –– ––
Months Supply of Inventory 0.7 2.4 + 242.9% –– –– ––
* Does not account for sale concessions and/or downpayment assistance. | Percent changes are calculated using rounded figures and can sometimes look extreme due to small sample size.
A rolling 12-month calculation represents the current month and the 11 months prior in a single data point. If no activity occurred during a month, the line extends to the next available data point.
Median Sales Price - Single Family
Rolling 12-Month Calculation Gallatin County
Belgrade
1-2003 1-2005 1-2007 1-2009 1-2011 1-2013 1-2015 1-2017
$100,000
$150,000
$200,000
$250,000
$300,000
$350,000
$400,000
$450,000
Median Sales Price - Condo
Rolling 12-Month Calculation Gallatin County
Belgrade
1-2003 1-2005 1-2007 1-2009 1-2011 1-2013 1-2015 1-2017
$50,000
$100,000
$150,000
$200,000
$250,000
$300,000
Current as of November 10, 2018. All data from Big Sky Country Multiple Listing Service®. Report © 2018 ShowingTime.
Local Market Update – October 2018
This is a research tool provided by the Big Sky Country MLS
Greater Big Sky
5CN, 5CS, 5BMT, 5BMV
Single Family October Year to Date
Key Metrics 2017 2018 % Change Thru 10-2017 Thru 10-2018 % Change
New Listings 7 4 - 42.9% 102 102 0.0%
Pending Sales 6 5 - 16.7% 72 90 + 25.0%
Closed Sales 10 13 + 30.0% 65 78 + 20.0%
Days on Market Until Sale 117 150 + 28.2% 211 147 - 30.3%
Median Sales Price* $627,500 $1,095,000 + 74.5% $1,152,500 $1,395,000 + 21.0%
Average Sales Price* $935,250 $1,478,846 + 58.1% $1,334,020 $1,640,767 + 23.0%
Percent of List Price Received* 94.2% 94.8% + 0.6% 94.9% 96.1% + 1.3%
Inventory of Homes for Sale 72 56 - 22.2% –– –– ––
Months Supply of Inventory 10.0 7.0 - 30.0% –– –– ––
Condo/Townhouse October Year to Date
Key Metrics 2017 2018 % Change Thru 10-2017 Thru 10-2018 % Change
New Listings 21 12 - 42.9% 175 133 - 24.0%
Pending Sales 9 11 + 22.2% 154 157 + 1.9%
Closed Sales 22 12 - 45.5% 148 153 + 3.4%
Days on Market Until Sale 119 193 + 62.2% 135 118 - 12.6%
Median Sales Price* $362,950 $417,500 + 15.0% $362,500 $409,000 + 12.8%
Average Sales Price* $429,836 $705,053 + 64.0% $447,531 $544,144 + 21.6%
Percent of List Price Received* 96.4% 96.0% - 0.4% 96.4% 96.5% + 0.1%
Inventory of Homes for Sale 107 63 - 41.1% –– –– ––
Months Supply of Inventory 7.6 4.3 - 43.4% –– –– ––
* Does not account for sale concessions and/or downpayment assistance. | Percent changes are calculated using rounded figures and can sometimes look extreme due to small sample size.
A rolling 12-month calculation represents the current month and the 11 months prior in a single data point. If no activity occurred during a month, the line extends to the next available data point.
Median Sales Price - Single Family
Rolling 12-Month Calculation Gallatin County
Greater Big Sky
1-2003 1-2005 1-2007 1-2009 1-2011 1-2013 1-2015 1-2017
$0
$500,000
$1,000,000
$1,500,000
$2,000,000
Median Sales Price - Condo
Rolling 12-Month Calculation Gallatin County
Greater Big Sky
1-2003 1-2005 1-2007 1-2009 1-2011 1-2013 1-2015 1-2017
$0
$100,000
$200,000
$300,000
$400,000
$500,000
$600,000
Current as of November 10, 2018. All data from Big Sky Country Multiple Listing Service®. Report © 2018 ShowingTime.
Local Market Update – October 2018
This is a research tool provided by the Big Sky Country MLS
Livingston City Limits
6C
Single Family October Year to Date
Key Metrics 2017 2018 % Change Thru 10-2017 Thru 10-2018 % Change
New Listings 15 16 + 6.7% 153 148 - 3.3%
Pending Sales 12 16 + 33.3% 147 125 - 15.0%
Closed Sales 14 9 - 35.7% 133 117 - 12.0%
Days on Market Until Sale 34 46 + 35.3% 54 51 - 5.6%
Median Sales Price* $250,000 $340,000 + 36.0% $229,000 $280,000 + 22.3%
Average Sales Price* $244,617 $372,639 + 52.3% $230,086 $285,124 + 23.9%
Percent of List Price Received* 96.8% 97.8% + 1.0% 97.3% 97.7% + 0.4%
Inventory of Homes for Sale 27 31 + 14.8% –– –– ––
Months Supply of Inventory 2.1 2.7 + 28.6% –– –– ––
Condo/Townhouse October Year to Date
Key Metrics 2017 2018 % Change Thru 10-2017 Thru 10-2018 % Change
New Listings 1 6 + 500.0% 28 40 + 42.9%
Pending Sales 6 4 - 33.3% 25 31 + 24.0%
Closed Sales 4 5 + 25.0% 16 30 + 87.5%
Days on Market Until Sale 26 23 - 11.5% 24 42 + 75.0%
Median Sales Price* $214,836 $210,000 - 2.3% $150,250 $218,000 + 45.1%
Average Sales Price* $200,543 $199,280 - 0.6% $194,716 $211,710 + 8.7%
Percent of List Price Received* 98.8% 99.8% + 1.0% 96.8% 98.4% + 1.7%
Inventory of Homes for Sale 4 12 + 200.0% –– –– ––
Months Supply of Inventory 1.3 3.1 + 138.5% –– –– ––
* Does not account for sale concessions and/or downpayment assistance. | Percent changes are calculated using rounded figures and can sometimes look extreme due to small sample size.
A rolling 12-month calculation represents the current month and the 11 months prior in a single data point. If no activity occurred during a month, the line extends to the next available data point.
Median Sales Price - Single Family
Rolling 12-Month Calculation Gallatin County
Livingston City Limits
1-2003 1-2005 1-2007 1-2009 1-2011 1-2013 1-2015 1-2017
$0
$100,000
$200,000
$300,000
$400,000
$500,000
Median Sales Price - Condo
Rolling 12-Month Calculation Gallatin County
Livingston City Limits
1-2003 1-2005 1-2007 1-2009 1-2011 1-2013 1-2015 1-2017
$50,000
$100,000
$150,000
$200,000
$250,000
$300,000
Current as of November 10, 2018. All data from Big Sky Country Multiple Listing Service®. Report © 2018 ShowingTime.
Local Market Update – October 2018
This is a research tool provided by the Big Sky Country MLS
Greater Three Forks
4TC, 4TL, 4TN, 4TR, 4TSW
Single Family October Year to Date
Key Metrics 2017 2018 % Change Thru 10-2017 Thru 10-2018 % Change
New Listings 3 3 0.0% 56 76 + 35.7%
Pending Sales 3 5 + 66.7% 36 49 + 36.1%
Closed Sales 6 2 - 66.7% 33 46 + 39.4%
Days on Market Until Sale 37 19 - 48.6% 61 45 - 26.2%
Median Sales Price* $288,500 $192,000 - 33.4% $255,500 $242,000 - 5.3%
Average Sales Price* $267,167 $192,000 - 28.1% $252,656 $242,954 - 3.8%
Percent of List Price Received* 96.7% 87.4% - 9.6% 96.9% 97.9% + 1.0%
Inventory of Homes for Sale 15 25 + 66.7% –– –– ––
Months Supply of Inventory 4.3 5.7 + 32.6% –– –– ––
Condo/Townhouse October Year to Date
Key Metrics 2017 2018 % Change Thru 10-2017 Thru 10-2018 % Change
New Listings 0 0 –– 0 2 ––
Pending Sales 0 0 –– 1 4 + 300.0%
Closed Sales 0 0 –– 2 5 + 150.0%
Days on Market Until Sale –– –– –– 154 302 + 96.1%
Median Sales Price* –– –– –– $238,368 $215,000 - 9.8%
Average Sales Price* –– –– –– $238,368 $215,000 - 9.8%
Percent of List Price Received* –– –– –– 101.4% 100.0% - 1.4%
Inventory of Homes for Sale 5 0 - 100.0% –– –– ––
Months Supply of Inventory 5.0 –– –– –– –– ––
* Does not account for sale concessions and/or downpayment assistance. | Percent changes are calculated using rounded figures and can sometimes look extreme due to small sample size.
A rolling 12-month calculation represents the current month and the 11 months prior in a single data point. If no activity occurred during a month, the line extends to the next available data point.
Median Sales Price - Single Family
Rolling 12-Month Calculation Gallatin County
Greater Three Forks
1-2003 1-2005 1-2007 1-2009 1-2011 1-2013 1-2015 1-2017
$0
$100,000
$200,000
$300,000
$400,000
$500,000
Median Sales Price - Condo
Rolling 12-Month Calculation Gallatin County
Greater Three Forks
1-2003 1-2005 1-2007 1-2009 1-2011 1-2013 1-2015 1-2017
$100,000
$150,000
$200,000
$250,000
$300,000
Current as of November 10, 2018. All data from Big Sky Country Multiple Listing Service®. Report © 2018 ShowingTime.
Local Market Update – October 2018
This is a research tool provided by the Big Sky Country MLS
Greater Manhattan
4MA, 4MC, 4MN, 4MS
Single Family October Year to Date
Key Metrics 2017 2018 % Change Thru 10-2017 Thru 10-2018 % Change
New Listings 9 7 - 22.2% 79 83 + 5.1%
Pending Sales 4 5 + 25.0% 55 58 + 5.5%
Closed Sales 4 10 + 150.0% 51 56 + 9.8%
Days on Market Until Sale 13 35 + 169.2% 68 69 + 1.5%
Median Sales Price* $322,450 $424,475 + 31.6% $307,000 $390,250 + 27.1%
Average Sales Price* $324,725 $486,895 + 49.9% $368,443 $437,465 + 18.7%
Percent of List Price Received* 99.7% 94.3% - 5.4% 98.3% 97.4% - 0.9%
Inventory of Homes for Sale 29 31 + 6.9% –– –– ––
Months Supply of Inventory 5.8 5.9 + 1.7% –– –– ––
Condo/Townhouse October Year to Date
Key Metrics 2017 2018 % Change Thru 10-2017 Thru 10-2018 % Change
New Listings 1 0 - 100.0% 10 7 - 30.0%
Pending Sales 1 0 - 100.0% 9 7 - 22.2%
Closed Sales 0 0 –– 8 7 - 12.5%
Days on Market Until Sale –– –– –– 9 8 - 11.1%
Median Sales Price* –– –– –– $134,000 $205,000 + 53.0%
Average Sales Price* –– –– –– $144,438 $200,643 + 38.9%
Percent of List Price Received* –– –– –– 99.0% 99.0% 0.0%
Inventory of Homes for Sale 1 0 - 100.0% –– –– ––
Months Supply of Inventory 0.8 –– –– –– –– ––
* Does not account for sale concessions and/or downpayment assistance. | Percent changes are calculated using rounded figures and can sometimes look extreme due to small sample size.
A rolling 12-month calculation represents the current month and the 11 months prior in a single data point. If no activity occurred during a month, the line extends to the next available data point.
Median Sales Price - Single Family
Rolling 12-Month Calculation Gallatin County
Greater Manhattan
1-2003 1-2005 1-2007 1-2009 1-2011 1-2013 1-2015 1-2017
$100,000
$150,000
$200,000
$250,000
$300,000
$350,000
$400,000
$450,000
Median Sales Price - Condo
Rolling 12-Month Calculation Gallatin County
Greater Manhattan
1-2003 1-2005 1-2007 1-2009 1-2011 1-2013 1-2015 1-2017
$0
$50,000
$100,000
$150,000
$200,000
$250,000
$300,000
Current as of November 10, 2018. All data from Big Sky Country Multiple Listing Service®. Report © 2018 ShowingTime.

More Related Content

What's hot

June 2018 Gallatin Valley Market Reports
June 2018 Gallatin Valley Market ReportsJune 2018 Gallatin Valley Market Reports
June 2018 Gallatin Valley Market Reports
Referred Realty Group
 
August 2019 Market Reports for Bozeman
August 2019 Market Reports for BozemanAugust 2019 Market Reports for Bozeman
August 2019 Market Reports for Bozeman
Referred Realty Group
 
Oct 2019 Market Reports
Oct 2019 Market ReportsOct 2019 Market Reports
Oct 2019 Market Reports
Referred Realty Group
 
Feb 2019 Market Reports for the Bozeman Area
Feb 2019 Market Reports for the Bozeman AreaFeb 2019 Market Reports for the Bozeman Area
Feb 2019 Market Reports for the Bozeman Area
Referred Realty Group
 
Georgia Housing Market Snapshot For October 2018
Georgia Housing Market Snapshot For October 2018Georgia Housing Market Snapshot For October 2018
Georgia Housing Market Snapshot For October 2018
Arthur Prescott
 
March 2019 Market Report
March 2019 Market ReportMarch 2019 Market Report
March 2019 Market Report
Referred Realty Group
 
Bozeman and Surrounding Communities June 2019 Market Report
Bozeman and Surrounding Communities June 2019 Market ReportBozeman and Surrounding Communities June 2019 Market Report
Bozeman and Surrounding Communities June 2019 Market Report
Referred Realty Group
 
Jan 2019 Gallatin Valley Market Reports
Jan 2019 Gallatin Valley Market ReportsJan 2019 Gallatin Valley Market Reports
Jan 2019 Gallatin Valley Market Reports
Referred Realty Group
 
May 2019 Gallatin Valley Market Reports
May 2019 Gallatin Valley Market ReportsMay 2019 Gallatin Valley Market Reports
May 2019 Gallatin Valley Market Reports
Referred Realty Group
 
Georgia Housing Market Snapshot For September 2018
Georgia Housing Market Snapshot For September 2018Georgia Housing Market Snapshot For September 2018
Georgia Housing Market Snapshot For September 2018
Arthur Prescott
 
#HomeSalesShow Nov 2017 Market Reports
#HomeSalesShow Nov 2017 Market Reports#HomeSalesShow Nov 2017 Market Reports
#HomeSalesShow Nov 2017 Market Reports
Referred Realty Group
 
Georgia Housing Market Snapshot For November 2018
Georgia Housing Market Snapshot For November 2018Georgia Housing Market Snapshot For November 2018
Georgia Housing Market Snapshot For November 2018
Arthur Prescott
 
September 2019 Market Reports
September 2019 Market ReportsSeptember 2019 Market Reports
September 2019 Market Reports
Referred Realty Group
 
April 2019 Market Reports for the Gallatin Valley
April 2019 Market Reports for the Gallatin ValleyApril 2019 Market Reports for the Gallatin Valley
April 2019 Market Reports for the Gallatin Valley
Referred Realty Group
 
July 2019 Gallatin Valley Market Reports
July 2019 Gallatin Valley Market ReportsJuly 2019 Gallatin Valley Market Reports
July 2019 Gallatin Valley Market Reports
Referred Realty Group
 
#HomeSalesShow Oct 2017 market reports
#HomeSalesShow Oct 2017 market reports#HomeSalesShow Oct 2017 market reports
#HomeSalesShow Oct 2017 market reports
Referred Realty Group
 
San Francisco Market Focus April 2018
San Francisco Market Focus April 2018San Francisco Market Focus April 2018
San Francisco Market Focus April 2018
Ronny Budiutama
 
San Francisco Market Focus Report November 2018
San Francisco Market Focus Report November 2018San Francisco Market Focus Report November 2018
San Francisco Market Focus Report November 2018
Ronny Budiutama
 
San Francisco Market Focus Report October 2018
San Francisco Market Focus Report October 2018San Francisco Market Focus Report October 2018
San Francisco Market Focus Report October 2018
Ronny Budiutama
 
Georgia Housing Market Snapshot For July. Gar mmi 2018-07
Georgia Housing Market Snapshot For July. Gar mmi 2018-07Georgia Housing Market Snapshot For July. Gar mmi 2018-07
Georgia Housing Market Snapshot For July. Gar mmi 2018-07
Arthur Prescott
 

What's hot (20)

June 2018 Gallatin Valley Market Reports
June 2018 Gallatin Valley Market ReportsJune 2018 Gallatin Valley Market Reports
June 2018 Gallatin Valley Market Reports
 
August 2019 Market Reports for Bozeman
August 2019 Market Reports for BozemanAugust 2019 Market Reports for Bozeman
August 2019 Market Reports for Bozeman
 
Oct 2019 Market Reports
Oct 2019 Market ReportsOct 2019 Market Reports
Oct 2019 Market Reports
 
Feb 2019 Market Reports for the Bozeman Area
Feb 2019 Market Reports for the Bozeman AreaFeb 2019 Market Reports for the Bozeman Area
Feb 2019 Market Reports for the Bozeman Area
 
Georgia Housing Market Snapshot For October 2018
Georgia Housing Market Snapshot For October 2018Georgia Housing Market Snapshot For October 2018
Georgia Housing Market Snapshot For October 2018
 
March 2019 Market Report
March 2019 Market ReportMarch 2019 Market Report
March 2019 Market Report
 
Bozeman and Surrounding Communities June 2019 Market Report
Bozeman and Surrounding Communities June 2019 Market ReportBozeman and Surrounding Communities June 2019 Market Report
Bozeman and Surrounding Communities June 2019 Market Report
 
Jan 2019 Gallatin Valley Market Reports
Jan 2019 Gallatin Valley Market ReportsJan 2019 Gallatin Valley Market Reports
Jan 2019 Gallatin Valley Market Reports
 
May 2019 Gallatin Valley Market Reports
May 2019 Gallatin Valley Market ReportsMay 2019 Gallatin Valley Market Reports
May 2019 Gallatin Valley Market Reports
 
Georgia Housing Market Snapshot For September 2018
Georgia Housing Market Snapshot For September 2018Georgia Housing Market Snapshot For September 2018
Georgia Housing Market Snapshot For September 2018
 
#HomeSalesShow Nov 2017 Market Reports
#HomeSalesShow Nov 2017 Market Reports#HomeSalesShow Nov 2017 Market Reports
#HomeSalesShow Nov 2017 Market Reports
 
Georgia Housing Market Snapshot For November 2018
Georgia Housing Market Snapshot For November 2018Georgia Housing Market Snapshot For November 2018
Georgia Housing Market Snapshot For November 2018
 
September 2019 Market Reports
September 2019 Market ReportsSeptember 2019 Market Reports
September 2019 Market Reports
 
April 2019 Market Reports for the Gallatin Valley
April 2019 Market Reports for the Gallatin ValleyApril 2019 Market Reports for the Gallatin Valley
April 2019 Market Reports for the Gallatin Valley
 
July 2019 Gallatin Valley Market Reports
July 2019 Gallatin Valley Market ReportsJuly 2019 Gallatin Valley Market Reports
July 2019 Gallatin Valley Market Reports
 
#HomeSalesShow Oct 2017 market reports
#HomeSalesShow Oct 2017 market reports#HomeSalesShow Oct 2017 market reports
#HomeSalesShow Oct 2017 market reports
 
San Francisco Market Focus April 2018
San Francisco Market Focus April 2018San Francisco Market Focus April 2018
San Francisco Market Focus April 2018
 
San Francisco Market Focus Report November 2018
San Francisco Market Focus Report November 2018San Francisco Market Focus Report November 2018
San Francisco Market Focus Report November 2018
 
San Francisco Market Focus Report October 2018
San Francisco Market Focus Report October 2018San Francisco Market Focus Report October 2018
San Francisco Market Focus Report October 2018
 
Georgia Housing Market Snapshot For July. Gar mmi 2018-07
Georgia Housing Market Snapshot For July. Gar mmi 2018-07Georgia Housing Market Snapshot For July. Gar mmi 2018-07
Georgia Housing Market Snapshot For July. Gar mmi 2018-07
 

Similar to October 2018 Market Reports

March 2020 Market Data
March 2020 Market DataMarch 2020 Market Data
March 2020 Market Data
Referred Realty Group
 
Massachusetts statewide closed sales for condos and single family homes
Massachusetts statewide closed sales for condos and single family homesMassachusetts statewide closed sales for condos and single family homes
Massachusetts statewide closed sales for condos and single family homes
Michael Mahoney
 
January 2022 Bozeman real estate stats
January 2022 Bozeman real estate statsJanuary 2022 Bozeman real estate stats
January 2022 Bozeman real estate stats
Referred Realty Group
 
San Francisco Market Report October 2022.pdf
San Francisco Market Report October 2022.pdfSan Francisco Market Report October 2022.pdf
San Francisco Market Report October 2022.pdf
Ronny Budiutama
 
San Francisco Market Focus Report Aug 2018
San Francisco Market Focus Report Aug 2018San Francisco Market Focus Report Aug 2018
San Francisco Market Focus Report Aug 2018
Ronny Budiutama
 
San Francisco Market Focus Report September 2018
San Francisco Market Focus Report September 2018San Francisco Market Focus Report September 2018
San Francisco Market Focus Report September 2018
Ronny Budiutama
 
December and Year End 2018 Sales Data
December and Year End 2018 Sales DataDecember and Year End 2018 Sales Data
December and Year End 2018 Sales Data
Referred Realty Group
 
San Francisco Market Focus Report May
San Francisco Market Focus Report MaySan Francisco Market Focus Report May
San Francisco Market Focus Report May
Ronny Budiutama
 
San Francisco November 2023 Market Report
San Francisco November 2023 Market ReportSan Francisco November 2023 Market Report
San Francisco November 2023 Market Report
Ronny Budiutama
 
San Francisco Market Report December 2022.pdf
San Francisco Market Report December 2022.pdfSan Francisco Market Report December 2022.pdf
San Francisco Market Report December 2022.pdf
Ronny Budiutama
 
San Francisco Market Report March 2022
San Francisco Market Report March 2022San Francisco Market Report March 2022
San Francisco Market Report March 2022
Ronny Budiutama
 
San Francisco Market Report January 2023.pdf
San Francisco Market Report January 2023.pdfSan Francisco Market Report January 2023.pdf
San Francisco Market Report January 2023.pdf
Ronny Budiutama
 

Similar to October 2018 Market Reports (12)

March 2020 Market Data
March 2020 Market DataMarch 2020 Market Data
March 2020 Market Data
 
Massachusetts statewide closed sales for condos and single family homes
Massachusetts statewide closed sales for condos and single family homesMassachusetts statewide closed sales for condos and single family homes
Massachusetts statewide closed sales for condos and single family homes
 
January 2022 Bozeman real estate stats
January 2022 Bozeman real estate statsJanuary 2022 Bozeman real estate stats
January 2022 Bozeman real estate stats
 
San Francisco Market Report October 2022.pdf
San Francisco Market Report October 2022.pdfSan Francisco Market Report October 2022.pdf
San Francisco Market Report October 2022.pdf
 
San Francisco Market Focus Report Aug 2018
San Francisco Market Focus Report Aug 2018San Francisco Market Focus Report Aug 2018
San Francisco Market Focus Report Aug 2018
 
San Francisco Market Focus Report September 2018
San Francisco Market Focus Report September 2018San Francisco Market Focus Report September 2018
San Francisco Market Focus Report September 2018
 
December and Year End 2018 Sales Data
December and Year End 2018 Sales DataDecember and Year End 2018 Sales Data
December and Year End 2018 Sales Data
 
San Francisco Market Focus Report May
San Francisco Market Focus Report MaySan Francisco Market Focus Report May
San Francisco Market Focus Report May
 
San Francisco November 2023 Market Report
San Francisco November 2023 Market ReportSan Francisco November 2023 Market Report
San Francisco November 2023 Market Report
 
San Francisco Market Report December 2022.pdf
San Francisco Market Report December 2022.pdfSan Francisco Market Report December 2022.pdf
San Francisco Market Report December 2022.pdf
 
San Francisco Market Report March 2022
San Francisco Market Report March 2022San Francisco Market Report March 2022
San Francisco Market Report March 2022
 
San Francisco Market Report January 2023.pdf
San Francisco Market Report January 2023.pdfSan Francisco Market Report January 2023.pdf
San Francisco Market Report January 2023.pdf
 

More from Referred Realty Group

Bozeman Real Estate Market Reports April/May 2024
Bozeman Real Estate Market Reports April/May 2024Bozeman Real Estate Market Reports April/May 2024
Bozeman Real Estate Market Reports April/May 2024
Referred Realty Group
 
Apr 22 Market Reports
Apr 22 Market ReportsApr 22 Market Reports
Apr 22 Market Reports
Referred Realty Group
 
Bozeman March 2022 Real Estate Market Report
Bozeman March 2022 Real Estate Market ReportBozeman March 2022 Real Estate Market Report
Bozeman March 2022 Real Estate Market Report
Referred Realty Group
 
Feb 2022 Market Report for Bozeman, MT
Feb 2022 Market Report for Bozeman, MTFeb 2022 Market Report for Bozeman, MT
Feb 2022 Market Report for Bozeman, MT
Referred Realty Group
 
November 2018 Real Estate Update, The Woodlands, TX
November 2018 Real Estate Update, The Woodlands, TXNovember 2018 Real Estate Update, The Woodlands, TX
November 2018 Real Estate Update, The Woodlands, TX
Referred Realty Group
 
October 2018 Real Estate Update for The Woodlands, Texas
October 2018 Real Estate Update for The Woodlands, TexasOctober 2018 Real Estate Update for The Woodlands, Texas
October 2018 Real Estate Update for The Woodlands, Texas
Referred Realty Group
 
September 2018 Real Estate Update, The Woodlands, Texas
September 2018 Real Estate Update, The Woodlands, TexasSeptember 2018 Real Estate Update, The Woodlands, Texas
September 2018 Real Estate Update, The Woodlands, Texas
Referred Realty Group
 
August 2018 Real Estate Update for The Woodlands, Texas
August 2018 Real Estate Update for The Woodlands, TexasAugust 2018 Real Estate Update for The Woodlands, Texas
August 2018 Real Estate Update for The Woodlands, Texas
Referred Realty Group
 
July 2018 Real Estate Update for The Woodlands, Texas
July 2018 Real Estate Update for The Woodlands, TexasJuly 2018 Real Estate Update for The Woodlands, Texas
July 2018 Real Estate Update for The Woodlands, Texas
Referred Realty Group
 
May 2018 Real Estate Update for The Woodlands, Texas
May 2018 Real Estate Update for The Woodlands, TexasMay 2018 Real Estate Update for The Woodlands, Texas
May 2018 Real Estate Update for The Woodlands, Texas
Referred Realty Group
 
April 2018 Real Estate Update
April 2018 Real Estate UpdateApril 2018 Real Estate Update
April 2018 Real Estate Update
Referred Realty Group
 

More from Referred Realty Group (11)

Bozeman Real Estate Market Reports April/May 2024
Bozeman Real Estate Market Reports April/May 2024Bozeman Real Estate Market Reports April/May 2024
Bozeman Real Estate Market Reports April/May 2024
 
Apr 22 Market Reports
Apr 22 Market ReportsApr 22 Market Reports
Apr 22 Market Reports
 
Bozeman March 2022 Real Estate Market Report
Bozeman March 2022 Real Estate Market ReportBozeman March 2022 Real Estate Market Report
Bozeman March 2022 Real Estate Market Report
 
Feb 2022 Market Report for Bozeman, MT
Feb 2022 Market Report for Bozeman, MTFeb 2022 Market Report for Bozeman, MT
Feb 2022 Market Report for Bozeman, MT
 
November 2018 Real Estate Update, The Woodlands, TX
November 2018 Real Estate Update, The Woodlands, TXNovember 2018 Real Estate Update, The Woodlands, TX
November 2018 Real Estate Update, The Woodlands, TX
 
October 2018 Real Estate Update for The Woodlands, Texas
October 2018 Real Estate Update for The Woodlands, TexasOctober 2018 Real Estate Update for The Woodlands, Texas
October 2018 Real Estate Update for The Woodlands, Texas
 
September 2018 Real Estate Update, The Woodlands, Texas
September 2018 Real Estate Update, The Woodlands, TexasSeptember 2018 Real Estate Update, The Woodlands, Texas
September 2018 Real Estate Update, The Woodlands, Texas
 
August 2018 Real Estate Update for The Woodlands, Texas
August 2018 Real Estate Update for The Woodlands, TexasAugust 2018 Real Estate Update for The Woodlands, Texas
August 2018 Real Estate Update for The Woodlands, Texas
 
July 2018 Real Estate Update for The Woodlands, Texas
July 2018 Real Estate Update for The Woodlands, TexasJuly 2018 Real Estate Update for The Woodlands, Texas
July 2018 Real Estate Update for The Woodlands, Texas
 
May 2018 Real Estate Update for The Woodlands, Texas
May 2018 Real Estate Update for The Woodlands, TexasMay 2018 Real Estate Update for The Woodlands, Texas
May 2018 Real Estate Update for The Woodlands, Texas
 
April 2018 Real Estate Update
April 2018 Real Estate UpdateApril 2018 Real Estate Update
April 2018 Real Estate Update
 

Recently uploaded

Investing In The US As A Canadian… And How To Do It RIGHT!! (feat. Erwin Szet...
Investing In The US As A Canadian… And How To Do It RIGHT!! (feat. Erwin Szet...Investing In The US As A Canadian… And How To Do It RIGHT!! (feat. Erwin Szet...
Investing In The US As A Canadian… And How To Do It RIGHT!! (feat. Erwin Szet...
Volition Properties
 
Omaxe Sports City Dwarka A Comprehensive Guide
Omaxe Sports City Dwarka A Comprehensive GuideOmaxe Sports City Dwarka A Comprehensive Guide
Omaxe Sports City Dwarka A Comprehensive Guide
omaxesportscitydwark
 
Hawthorn Module 1 Coverted to Slide Show - 04.06.2024.docx
Hawthorn Module 1 Coverted to Slide Show - 04.06.2024.docxHawthorn Module 1 Coverted to Slide Show - 04.06.2024.docx
Hawthorn Module 1 Coverted to Slide Show - 04.06.2024.docx
anothershaneroberts
 
Optimizing Your MCA Lead Capture Process for Better Results
Optimizing Your MCA Lead Capture Process for Better ResultsOptimizing Your MCA Lead Capture Process for Better Results
Optimizing Your MCA Lead Capture Process for Better Results
Lead Generation Media
 
Green Homes, Islamabad Presentation .pdf
Green Homes, Islamabad Presentation .pdfGreen Homes, Islamabad Presentation .pdf
Green Homes, Islamabad Presentation .pdf
ticktoktips
 
Urbanrise Paradise on Earth - Unveiling Unprecedented Luxury in Exquisite Vil...
Urbanrise Paradise on Earth - Unveiling Unprecedented Luxury in Exquisite Vil...Urbanrise Paradise on Earth - Unveiling Unprecedented Luxury in Exquisite Vil...
Urbanrise Paradise on Earth - Unveiling Unprecedented Luxury in Exquisite Vil...
JagadishKR1
 
How to Scan Tenants in NYC - You Should Know!
How to Scan Tenants in NYC - You Should Know!How to Scan Tenants in NYC - You Should Know!
How to Scan Tenants in NYC - You Should Know!
BelgiumManagement
 
2BHK-3BHK NEW FLAT FOR SALE IN TUPUDANA,RANCHI.
2BHK-3BHK NEW FLAT FOR SALE IN TUPUDANA,RANCHI.2BHK-3BHK NEW FLAT FOR SALE IN TUPUDANA,RANCHI.
2BHK-3BHK NEW FLAT FOR SALE IN TUPUDANA,RANCHI.
aashiyanastardevelop
 
Presentation to Windust Meadows HOA Board of Directors June 4, 2024: Focus o...
Presentation to Windust Meadows HOA Board of Directors June 4, 2024:  Focus o...Presentation to Windust Meadows HOA Board of Directors June 4, 2024:  Focus o...
Presentation to Windust Meadows HOA Board of Directors June 4, 2024: Focus o...
Joseph Lewis Aguirre
 
Elegant Evergreen Homes - Luxury Apartments Redefining Comfort in Yelahanka, ...
Elegant Evergreen Homes - Luxury Apartments Redefining Comfort in Yelahanka, ...Elegant Evergreen Homes - Luxury Apartments Redefining Comfort in Yelahanka, ...
Elegant Evergreen Homes - Luxury Apartments Redefining Comfort in Yelahanka, ...
JagadishKR1
 
Riverview City Loni Kalbhor Pune Brochure
Riverview City Loni Kalbhor Pune BrochureRiverview City Loni Kalbhor Pune Brochure
Riverview City Loni Kalbhor Pune Brochure
kishor21012022
 
Biography and career about Lixin Azarmehr
Biography and career about Lixin AzarmehrBiography and career about Lixin Azarmehr
Biography and career about Lixin Azarmehr
Lixin Azarmehr
 
Sense Levent Kagithane Catalog - Listing Turkey
Sense Levent Kagithane Catalog - Listing TurkeySense Levent Kagithane Catalog - Listing Turkey
Sense Levent Kagithane Catalog - Listing Turkey
Listing Turkey
 
The KA Housing - Catalogue - Listing Turkey
The KA Housing - Catalogue - Listing TurkeyThe KA Housing - Catalogue - Listing Turkey
The KA Housing - Catalogue - Listing Turkey
Listing Turkey
 
Simpolo Company Profile & Corporate Logo
Simpolo Company Profile & Corporate LogoSimpolo Company Profile & Corporate Logo
Simpolo Company Profile & Corporate Logo
simpolosparkteam
 
BricknBolt Understanding Load-Bearing Walls and Their Structural Support in H...
BricknBolt Understanding Load-Bearing Walls and Their Structural Support in H...BricknBolt Understanding Load-Bearing Walls and Their Structural Support in H...
BricknBolt Understanding Load-Bearing Walls and Their Structural Support in H...
BrickAndBolt
 
Torun Center Residences Istanbul - Listing Turkey
Torun Center Residences Istanbul - Listing TurkeyTorun Center Residences Istanbul - Listing Turkey
Torun Center Residences Istanbul - Listing Turkey
Listing Turkey
 
Rixos Tersane Istanbul Residences Brochure_May2024_ENG.pdf
Rixos Tersane Istanbul Residences Brochure_May2024_ENG.pdfRixos Tersane Istanbul Residences Brochure_May2024_ENG.pdf
Rixos Tersane Istanbul Residences Brochure_May2024_ENG.pdf
Listing Turkey
 
Deutsche EuroShop | Company Presentation | 06/24
Deutsche EuroShop | Company Presentation | 06/24Deutsche EuroShop | Company Presentation | 06/24
Deutsche EuroShop | Company Presentation | 06/24
Deutsche EuroShop AG
 
SVN Live 6.3.24 Weekly Property Broadcast
SVN Live 6.3.24 Weekly Property BroadcastSVN Live 6.3.24 Weekly Property Broadcast
SVN Live 6.3.24 Weekly Property Broadcast
SVN International Corp.
 

Recently uploaded (20)

Investing In The US As A Canadian… And How To Do It RIGHT!! (feat. Erwin Szet...
Investing In The US As A Canadian… And How To Do It RIGHT!! (feat. Erwin Szet...Investing In The US As A Canadian… And How To Do It RIGHT!! (feat. Erwin Szet...
Investing In The US As A Canadian… And How To Do It RIGHT!! (feat. Erwin Szet...
 
Omaxe Sports City Dwarka A Comprehensive Guide
Omaxe Sports City Dwarka A Comprehensive GuideOmaxe Sports City Dwarka A Comprehensive Guide
Omaxe Sports City Dwarka A Comprehensive Guide
 
Hawthorn Module 1 Coverted to Slide Show - 04.06.2024.docx
Hawthorn Module 1 Coverted to Slide Show - 04.06.2024.docxHawthorn Module 1 Coverted to Slide Show - 04.06.2024.docx
Hawthorn Module 1 Coverted to Slide Show - 04.06.2024.docx
 
Optimizing Your MCA Lead Capture Process for Better Results
Optimizing Your MCA Lead Capture Process for Better ResultsOptimizing Your MCA Lead Capture Process for Better Results
Optimizing Your MCA Lead Capture Process for Better Results
 
Green Homes, Islamabad Presentation .pdf
Green Homes, Islamabad Presentation .pdfGreen Homes, Islamabad Presentation .pdf
Green Homes, Islamabad Presentation .pdf
 
Urbanrise Paradise on Earth - Unveiling Unprecedented Luxury in Exquisite Vil...
Urbanrise Paradise on Earth - Unveiling Unprecedented Luxury in Exquisite Vil...Urbanrise Paradise on Earth - Unveiling Unprecedented Luxury in Exquisite Vil...
Urbanrise Paradise on Earth - Unveiling Unprecedented Luxury in Exquisite Vil...
 
How to Scan Tenants in NYC - You Should Know!
How to Scan Tenants in NYC - You Should Know!How to Scan Tenants in NYC - You Should Know!
How to Scan Tenants in NYC - You Should Know!
 
2BHK-3BHK NEW FLAT FOR SALE IN TUPUDANA,RANCHI.
2BHK-3BHK NEW FLAT FOR SALE IN TUPUDANA,RANCHI.2BHK-3BHK NEW FLAT FOR SALE IN TUPUDANA,RANCHI.
2BHK-3BHK NEW FLAT FOR SALE IN TUPUDANA,RANCHI.
 
Presentation to Windust Meadows HOA Board of Directors June 4, 2024: Focus o...
Presentation to Windust Meadows HOA Board of Directors June 4, 2024:  Focus o...Presentation to Windust Meadows HOA Board of Directors June 4, 2024:  Focus o...
Presentation to Windust Meadows HOA Board of Directors June 4, 2024: Focus o...
 
Elegant Evergreen Homes - Luxury Apartments Redefining Comfort in Yelahanka, ...
Elegant Evergreen Homes - Luxury Apartments Redefining Comfort in Yelahanka, ...Elegant Evergreen Homes - Luxury Apartments Redefining Comfort in Yelahanka, ...
Elegant Evergreen Homes - Luxury Apartments Redefining Comfort in Yelahanka, ...
 
Riverview City Loni Kalbhor Pune Brochure
Riverview City Loni Kalbhor Pune BrochureRiverview City Loni Kalbhor Pune Brochure
Riverview City Loni Kalbhor Pune Brochure
 
Biography and career about Lixin Azarmehr
Biography and career about Lixin AzarmehrBiography and career about Lixin Azarmehr
Biography and career about Lixin Azarmehr
 
Sense Levent Kagithane Catalog - Listing Turkey
Sense Levent Kagithane Catalog - Listing TurkeySense Levent Kagithane Catalog - Listing Turkey
Sense Levent Kagithane Catalog - Listing Turkey
 
The KA Housing - Catalogue - Listing Turkey
The KA Housing - Catalogue - Listing TurkeyThe KA Housing - Catalogue - Listing Turkey
The KA Housing - Catalogue - Listing Turkey
 
Simpolo Company Profile & Corporate Logo
Simpolo Company Profile & Corporate LogoSimpolo Company Profile & Corporate Logo
Simpolo Company Profile & Corporate Logo
 
BricknBolt Understanding Load-Bearing Walls and Their Structural Support in H...
BricknBolt Understanding Load-Bearing Walls and Their Structural Support in H...BricknBolt Understanding Load-Bearing Walls and Their Structural Support in H...
BricknBolt Understanding Load-Bearing Walls and Their Structural Support in H...
 
Torun Center Residences Istanbul - Listing Turkey
Torun Center Residences Istanbul - Listing TurkeyTorun Center Residences Istanbul - Listing Turkey
Torun Center Residences Istanbul - Listing Turkey
 
Rixos Tersane Istanbul Residences Brochure_May2024_ENG.pdf
Rixos Tersane Istanbul Residences Brochure_May2024_ENG.pdfRixos Tersane Istanbul Residences Brochure_May2024_ENG.pdf
Rixos Tersane Istanbul Residences Brochure_May2024_ENG.pdf
 
Deutsche EuroShop | Company Presentation | 06/24
Deutsche EuroShop | Company Presentation | 06/24Deutsche EuroShop | Company Presentation | 06/24
Deutsche EuroShop | Company Presentation | 06/24
 
SVN Live 6.3.24 Weekly Property Broadcast
SVN Live 6.3.24 Weekly Property BroadcastSVN Live 6.3.24 Weekly Property Broadcast
SVN Live 6.3.24 Weekly Property Broadcast
 

October 2018 Market Reports

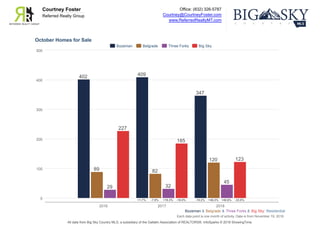
  • 1. Office: (832) 326-5787 Courtney@CourtneyFoster.com www.ReferredRealtyMT.com Courtney Foster Referred Realty Group Each data point is one month of activity. Data is from November 19, 2018. All data from Big Sky Country MLS, a subsidiary of the Gallatin Association of REALTORS®. InfoSparks © 2018 ShowingTime. October Homes for Sale Bozeman & Belgrade & Three Forks & Big Sky: Residential 0 100 200 300 400 500 2016 2017 2018 402 409 347 +1.7% -15.2% 89 82 120 -7.9% +46.3% 29 32 45 +10.3% +40.6% 227 185 123 -18.5% -33.5% Bozeman Belgrade Three Forks Big Sky
  • 2. Office: (832) 326-5787 Courtney@CourtneyFoster.com www.ReferredRealtyMT.com Courtney Foster Referred Realty Group Each data point is one month of activity. Data is from November 19, 2018. All data from Big Sky Country MLS, a subsidiary of the Gallatin Association of REALTORS®. InfoSparks © 2018 ShowingTime. October New Listings Bozeman & Belgrade & Three Forks & Big Sky: Residential 0 20 40 60 80 100 120 140 2016 2017 2018 98 111 122 +13.3% +9.9% 34 39 42 +14.7% +7.7% 1 3 5 +200.0% +66.7% 27 28 14 +3.7% -50.0% Bozeman Belgrade Three Forks Big Sky
  • 3. Office: (832) 326-5787 Courtney@CourtneyFoster.com www.ReferredRealtyMT.com Courtney Foster Referred Realty Group Each data point is one month of activity. Data is from November 19, 2018. All data from Big Sky Country MLS, a subsidiary of the Gallatin Association of REALTORS®. InfoSparks © 2018 ShowingTime. October Pending Sales Bozeman & Belgrade & Three Forks & Big Sky: Residential 0 25 50 75 100 125 150 2016 2017 2018 103 132 133 +28.2% +0.8% 33 40 28 +21.2% -30.0% 1 7 8 +600.0% +14.3% 16 15 15 -6.3% 0.0% Bozeman Belgrade Three Forks Big Sky
  • 4. Office: (832) 326-5787 Courtney@CourtneyFoster.com www.ReferredRealtyMT.com Courtney Foster Referred Realty Group Each data point is one month of activity. Data is from November 19, 2018. All data from Big Sky Country MLS, a subsidiary of the Gallatin Association of REALTORS®. InfoSparks © 2018 ShowingTime. October Closed Sales Bozeman & Belgrade & Three Forks & Big Sky: Residential 0 25 50 75 100 125 150 175 2016 2017 2018 128 134 157 +4.7% +17.2% 39 44 36 +12.8% -18.2% 10 12 5 +20.0% -58.3% 30 34 27 +13.3% -20.6% Bozeman Belgrade Three Forks Big Sky
  • 5. Office: (832) 326-5787 Courtney@CourtneyFoster.com www.ReferredRealtyMT.com Courtney Foster Referred Realty Group Each data point is activity year to date. Data is from November 19, 2018. All data from Big Sky Country MLS, a subsidiary of the Gallatin Association of REALTORS®. InfoSparks © 2018 ShowingTime. October Closed Sales Bozeman & Belgrade & Three Forks & Big Sky: Residential 0 250 500 750 1,000 1,250 1,500 2016 2017 2018 1,356 1,264 1,327 -6.8% +5.0% 366 407 400 +11.2% -1.7% 66 56 72 -15.2% +28.6% 205 231 241 +12.7% +4.3% Bozeman Belgrade Three Forks Big Sky
  • 6. Office: (832) 326-5787 Courtney@CourtneyFoster.com www.ReferredRealtyMT.com Courtney Foster Referred Realty Group Each data point is one month of activity. Data is from November 19, 2018. All data from Big Sky Country MLS, a subsidiary of the Gallatin Association of REALTORS®. InfoSparks © 2018 ShowingTime. October Average Sales Price Bozeman & Belgrade & Three Forks & Big Sky: Residential $0 $0.2M $0.4M $0.6M $0.8M $1.0M $1.2M $1.4M 2016 2017 2018 $434,029 $414,114 $512,644 -4.6% +23.8% $277,112 $283,305 $402,847 +2.2% +42.2% $220,640 $262,950 $266,680 +19.2% +1.4% $411,643 $617,635 $1,151,542 +50.0% +86.4% Bozeman Belgrade Three Forks Big Sky
  • 7. Office: (832) 326-5787 Courtney@CourtneyFoster.com www.ReferredRealtyMT.com Courtney Foster Referred Realty Group Each data point is one month of activity. Data is from November 19, 2018. All data from Big Sky Country MLS, a subsidiary of the Gallatin Association of REALTORS®. InfoSparks © 2018 ShowingTime. October Months Supply of Homes for Sale Bozeman & Belgrade & Three Forks & Big Sky: Residential 0.0 2.0 4.0 6.0 8.0 10.0 12.0 2016 2017 2018 3.0 3.2 2.7 +6.7% -15.6% 2.5 2.0 3.2 -20.0% +60.0% 4.4 5.5 5.6 +25.0% +1.8% 10.8 8.3 5.3 -23.1% -36.1% Bozeman Belgrade Three Forks Big Sky
  • 8. Office: (832) 326-5787 Courtney@CourtneyFoster.com www.ReferredRealtyMT.com Courtney Foster Referred Realty Group Each data point is one month of activity. Data is from November 19, 2018. All data from Big Sky Country MLS, a subsidiary of the Gallatin Association of REALTORS®. InfoSparks © 2018 ShowingTime. October Median Days on Market Bozeman & Belgrade & Three Forks & Big Sky: Residential 0 20 40 60 80 100 120 2016 2017 2018 40 23 36 -42.5% +56.5% 12 12 34 0.0% +183.3% 14 35 84 +150.0% +140.0% 97 81 96 -16.5% +18.5% Bozeman Belgrade Three Forks Big Sky
  • 9. Office: (832) 326-5787 Courtney@CourtneyFoster.com www.ReferredRealtyMT.com Courtney Foster Referred Realty Group Each data point is one month of activity. Data is from November 19, 2018. All data from Big Sky Country MLS, a subsidiary of the Gallatin Association of REALTORS®. InfoSparks © 2018 ShowingTime. October Average Price Per Square Foot Bozeman & Belgrade & Three Forks & Big Sky: Residential $0 $100 $200 $300 $400 $500 2016 2017 2018 $200 $198 $221 -1.0% +11.6% $139 $159 $184 +14.4% +15.7% $123 $149 $173 +21.1% +16.1% $241 $326 $445 +35.3% +36.5% Bozeman Belgrade Three Forks Big Sky
  • 10. Local Market Update – October 2018 This is a research tool provided by the Big Sky Country MLS Bozeman City Limits 1NE, 1NW, 1SM, 1SK Single Family October Year to Date Key Metrics 2017 2018 % Change Thru 10-2017 Thru 10-2018 % Change New Listings 36 47 + 30.6% 603 632 + 4.8% Pending Sales 46 60 + 30.4% 509 538 + 5.7% Closed Sales 55 68 + 23.6% 482 530 + 10.0% Days on Market Until Sale 48 52 + 8.3% 57 47 - 17.5% Median Sales Price* $388,000 $444,450 + 14.5% $380,000 $427,500 + 12.5% Average Sales Price* $460,574 $479,082 + 4.0% $423,288 $476,753 + 12.6% Percent of List Price Received* 98.2% 98.1% - 0.1% 99.2% 99.0% - 0.2% Inventory of Homes for Sale 135 114 - 15.6% –– –– –– Months Supply of Inventory 2.8 2.3 - 17.9% –– –– –– Condo/Townhouse October Year to Date Key Metrics 2017 2018 % Change Thru 10-2017 Thru 10-2018 % Change New Listings 29 38 + 31.0% 494 439 - 11.1% Pending Sales 32 39 + 21.9% 396 396 0.0% Closed Sales 32 34 + 6.3% 350 376 + 7.4% Days on Market Until Sale 28 45 + 60.7% 63 55 - 12.7% Median Sales Price* $242,450 $285,078 + 17.6% $270,000 $300,000 + 11.1% Average Sales Price* $270,981 $338,018 + 24.7% $307,887 $342,550 + 11.3% Percent of List Price Received* 99.2% 99.4% + 0.2% 99.7% 99.3% - 0.4% Inventory of Homes for Sale 102 91 - 10.8% –– –– –– Months Supply of Inventory 2.8 2.5 - 10.7% –– –– –– * Does not account for sale concessions and/or downpayment assistance. | Percent changes are calculated using rounded figures and can sometimes look extreme due to small sample size. A rolling 12-month calculation represents the current month and the 11 months prior in a single data point. If no activity occurred during a month, the line extends to the next available data point. Median Sales Price - Single Family Rolling 12-Month Calculation Gallatin County Bozeman City Limits 1-2003 1-2005 1-2007 1-2009 1-2011 1-2013 1-2015 1-2017 $150,000 $200,000 $250,000 $300,000 $350,000 $400,000 $450,000 Median Sales Price - Condo Rolling 12-Month Calculation Gallatin County Bozeman City Limits 1-2003 1-2005 1-2007 1-2009 1-2011 1-2013 1-2015 1-2017 $100,000 $150,000 $200,000 $250,000 $300,000 Current as of November 10, 2018. All data from Big Sky Country Multiple Listing Service®. Report © 2018 ShowingTime.
  • 11. Local Market Update – October 2018 This is a research tool provided by the Big Sky Country MLS Belgrade 3B, 3N, 3S Single Family October Year to Date Key Metrics 2017 2018 % Change Thru 10-2017 Thru 10-2018 % Change New Listings 36 37 + 2.8% 377 370 - 1.9% Pending Sales 34 23 - 32.4% 324 281 - 13.3% Closed Sales 32 29 - 9.4% 304 281 - 7.6% Days on Market Until Sale 26 45 + 73.1% 38 37 - 2.6% Median Sales Price* $289,200 $312,000 + 7.9% $286,700 $317,400 + 10.7% Average Sales Price* $302,658 $380,316 + 25.7% $322,002 $350,860 + 9.0% Percent of List Price Received* 99.3% 98.0% - 1.3% 99.1% 98.9% - 0.2% Inventory of Homes for Sale 64 88 + 37.5% –– –– –– Months Supply of Inventory 2.1 3.3 + 57.1% –– –– –– Condo/Townhouse October Year to Date Key Metrics 2017 2018 % Change Thru 10-2017 Thru 10-2018 % Change New Listings 1 1 0.0% 81 116 + 43.2% Pending Sales 4 4 0.0% 79 93 + 17.7% Closed Sales 10 4 - 60.0% 71 84 + 18.3% Days on Market Until Sale 9 37 + 311.1% 28 29 + 3.6% Median Sales Price* $189,500 $204,500 + 7.9% $185,000 $210,500 + 13.8% Average Sales Price* $182,540 $207,925 + 13.9% $184,285 $221,476 + 20.2% Percent of List Price Received* 98.9% 99.7% + 0.8% 99.4% 99.6% + 0.2% Inventory of Homes for Sale 5 20 + 300.0% –– –– –– Months Supply of Inventory 0.7 2.4 + 242.9% –– –– –– * Does not account for sale concessions and/or downpayment assistance. | Percent changes are calculated using rounded figures and can sometimes look extreme due to small sample size. A rolling 12-month calculation represents the current month and the 11 months prior in a single data point. If no activity occurred during a month, the line extends to the next available data point. Median Sales Price - Single Family Rolling 12-Month Calculation Gallatin County Belgrade 1-2003 1-2005 1-2007 1-2009 1-2011 1-2013 1-2015 1-2017 $100,000 $150,000 $200,000 $250,000 $300,000 $350,000 $400,000 $450,000 Median Sales Price - Condo Rolling 12-Month Calculation Gallatin County Belgrade 1-2003 1-2005 1-2007 1-2009 1-2011 1-2013 1-2015 1-2017 $50,000 $100,000 $150,000 $200,000 $250,000 $300,000 Current as of November 10, 2018. All data from Big Sky Country Multiple Listing Service®. Report © 2018 ShowingTime.
  • 12. Local Market Update – October 2018 This is a research tool provided by the Big Sky Country MLS Greater Big Sky 5CN, 5CS, 5BMT, 5BMV Single Family October Year to Date Key Metrics 2017 2018 % Change Thru 10-2017 Thru 10-2018 % Change New Listings 7 4 - 42.9% 102 102 0.0% Pending Sales 6 5 - 16.7% 72 90 + 25.0% Closed Sales 10 13 + 30.0% 65 78 + 20.0% Days on Market Until Sale 117 150 + 28.2% 211 147 - 30.3% Median Sales Price* $627,500 $1,095,000 + 74.5% $1,152,500 $1,395,000 + 21.0% Average Sales Price* $935,250 $1,478,846 + 58.1% $1,334,020 $1,640,767 + 23.0% Percent of List Price Received* 94.2% 94.8% + 0.6% 94.9% 96.1% + 1.3% Inventory of Homes for Sale 72 56 - 22.2% –– –– –– Months Supply of Inventory 10.0 7.0 - 30.0% –– –– –– Condo/Townhouse October Year to Date Key Metrics 2017 2018 % Change Thru 10-2017 Thru 10-2018 % Change New Listings 21 12 - 42.9% 175 133 - 24.0% Pending Sales 9 11 + 22.2% 154 157 + 1.9% Closed Sales 22 12 - 45.5% 148 153 + 3.4% Days on Market Until Sale 119 193 + 62.2% 135 118 - 12.6% Median Sales Price* $362,950 $417,500 + 15.0% $362,500 $409,000 + 12.8% Average Sales Price* $429,836 $705,053 + 64.0% $447,531 $544,144 + 21.6% Percent of List Price Received* 96.4% 96.0% - 0.4% 96.4% 96.5% + 0.1% Inventory of Homes for Sale 107 63 - 41.1% –– –– –– Months Supply of Inventory 7.6 4.3 - 43.4% –– –– –– * Does not account for sale concessions and/or downpayment assistance. | Percent changes are calculated using rounded figures and can sometimes look extreme due to small sample size. A rolling 12-month calculation represents the current month and the 11 months prior in a single data point. If no activity occurred during a month, the line extends to the next available data point. Median Sales Price - Single Family Rolling 12-Month Calculation Gallatin County Greater Big Sky 1-2003 1-2005 1-2007 1-2009 1-2011 1-2013 1-2015 1-2017 $0 $500,000 $1,000,000 $1,500,000 $2,000,000 Median Sales Price - Condo Rolling 12-Month Calculation Gallatin County Greater Big Sky 1-2003 1-2005 1-2007 1-2009 1-2011 1-2013 1-2015 1-2017 $0 $100,000 $200,000 $300,000 $400,000 $500,000 $600,000 Current as of November 10, 2018. All data from Big Sky Country Multiple Listing Service®. Report © 2018 ShowingTime.
  • 13. Local Market Update – October 2018 This is a research tool provided by the Big Sky Country MLS Livingston City Limits 6C Single Family October Year to Date Key Metrics 2017 2018 % Change Thru 10-2017 Thru 10-2018 % Change New Listings 15 16 + 6.7% 153 148 - 3.3% Pending Sales 12 16 + 33.3% 147 125 - 15.0% Closed Sales 14 9 - 35.7% 133 117 - 12.0% Days on Market Until Sale 34 46 + 35.3% 54 51 - 5.6% Median Sales Price* $250,000 $340,000 + 36.0% $229,000 $280,000 + 22.3% Average Sales Price* $244,617 $372,639 + 52.3% $230,086 $285,124 + 23.9% Percent of List Price Received* 96.8% 97.8% + 1.0% 97.3% 97.7% + 0.4% Inventory of Homes for Sale 27 31 + 14.8% –– –– –– Months Supply of Inventory 2.1 2.7 + 28.6% –– –– –– Condo/Townhouse October Year to Date Key Metrics 2017 2018 % Change Thru 10-2017 Thru 10-2018 % Change New Listings 1 6 + 500.0% 28 40 + 42.9% Pending Sales 6 4 - 33.3% 25 31 + 24.0% Closed Sales 4 5 + 25.0% 16 30 + 87.5% Days on Market Until Sale 26 23 - 11.5% 24 42 + 75.0% Median Sales Price* $214,836 $210,000 - 2.3% $150,250 $218,000 + 45.1% Average Sales Price* $200,543 $199,280 - 0.6% $194,716 $211,710 + 8.7% Percent of List Price Received* 98.8% 99.8% + 1.0% 96.8% 98.4% + 1.7% Inventory of Homes for Sale 4 12 + 200.0% –– –– –– Months Supply of Inventory 1.3 3.1 + 138.5% –– –– –– * Does not account for sale concessions and/or downpayment assistance. | Percent changes are calculated using rounded figures and can sometimes look extreme due to small sample size. A rolling 12-month calculation represents the current month and the 11 months prior in a single data point. If no activity occurred during a month, the line extends to the next available data point. Median Sales Price - Single Family Rolling 12-Month Calculation Gallatin County Livingston City Limits 1-2003 1-2005 1-2007 1-2009 1-2011 1-2013 1-2015 1-2017 $0 $100,000 $200,000 $300,000 $400,000 $500,000 Median Sales Price - Condo Rolling 12-Month Calculation Gallatin County Livingston City Limits 1-2003 1-2005 1-2007 1-2009 1-2011 1-2013 1-2015 1-2017 $50,000 $100,000 $150,000 $200,000 $250,000 $300,000 Current as of November 10, 2018. All data from Big Sky Country Multiple Listing Service®. Report © 2018 ShowingTime.
  • 14. Local Market Update – October 2018 This is a research tool provided by the Big Sky Country MLS Greater Three Forks 4TC, 4TL, 4TN, 4TR, 4TSW Single Family October Year to Date Key Metrics 2017 2018 % Change Thru 10-2017 Thru 10-2018 % Change New Listings 3 3 0.0% 56 76 + 35.7% Pending Sales 3 5 + 66.7% 36 49 + 36.1% Closed Sales 6 2 - 66.7% 33 46 + 39.4% Days on Market Until Sale 37 19 - 48.6% 61 45 - 26.2% Median Sales Price* $288,500 $192,000 - 33.4% $255,500 $242,000 - 5.3% Average Sales Price* $267,167 $192,000 - 28.1% $252,656 $242,954 - 3.8% Percent of List Price Received* 96.7% 87.4% - 9.6% 96.9% 97.9% + 1.0% Inventory of Homes for Sale 15 25 + 66.7% –– –– –– Months Supply of Inventory 4.3 5.7 + 32.6% –– –– –– Condo/Townhouse October Year to Date Key Metrics 2017 2018 % Change Thru 10-2017 Thru 10-2018 % Change New Listings 0 0 –– 0 2 –– Pending Sales 0 0 –– 1 4 + 300.0% Closed Sales 0 0 –– 2 5 + 150.0% Days on Market Until Sale –– –– –– 154 302 + 96.1% Median Sales Price* –– –– –– $238,368 $215,000 - 9.8% Average Sales Price* –– –– –– $238,368 $215,000 - 9.8% Percent of List Price Received* –– –– –– 101.4% 100.0% - 1.4% Inventory of Homes for Sale 5 0 - 100.0% –– –– –– Months Supply of Inventory 5.0 –– –– –– –– –– * Does not account for sale concessions and/or downpayment assistance. | Percent changes are calculated using rounded figures and can sometimes look extreme due to small sample size. A rolling 12-month calculation represents the current month and the 11 months prior in a single data point. If no activity occurred during a month, the line extends to the next available data point. Median Sales Price - Single Family Rolling 12-Month Calculation Gallatin County Greater Three Forks 1-2003 1-2005 1-2007 1-2009 1-2011 1-2013 1-2015 1-2017 $0 $100,000 $200,000 $300,000 $400,000 $500,000 Median Sales Price - Condo Rolling 12-Month Calculation Gallatin County Greater Three Forks 1-2003 1-2005 1-2007 1-2009 1-2011 1-2013 1-2015 1-2017 $100,000 $150,000 $200,000 $250,000 $300,000 Current as of November 10, 2018. All data from Big Sky Country Multiple Listing Service®. Report © 2018 ShowingTime.
  • 15. Local Market Update – October 2018 This is a research tool provided by the Big Sky Country MLS Greater Manhattan 4MA, 4MC, 4MN, 4MS Single Family October Year to Date Key Metrics 2017 2018 % Change Thru 10-2017 Thru 10-2018 % Change New Listings 9 7 - 22.2% 79 83 + 5.1% Pending Sales 4 5 + 25.0% 55 58 + 5.5% Closed Sales 4 10 + 150.0% 51 56 + 9.8% Days on Market Until Sale 13 35 + 169.2% 68 69 + 1.5% Median Sales Price* $322,450 $424,475 + 31.6% $307,000 $390,250 + 27.1% Average Sales Price* $324,725 $486,895 + 49.9% $368,443 $437,465 + 18.7% Percent of List Price Received* 99.7% 94.3% - 5.4% 98.3% 97.4% - 0.9% Inventory of Homes for Sale 29 31 + 6.9% –– –– –– Months Supply of Inventory 5.8 5.9 + 1.7% –– –– –– Condo/Townhouse October Year to Date Key Metrics 2017 2018 % Change Thru 10-2017 Thru 10-2018 % Change New Listings 1 0 - 100.0% 10 7 - 30.0% Pending Sales 1 0 - 100.0% 9 7 - 22.2% Closed Sales 0 0 –– 8 7 - 12.5% Days on Market Until Sale –– –– –– 9 8 - 11.1% Median Sales Price* –– –– –– $134,000 $205,000 + 53.0% Average Sales Price* –– –– –– $144,438 $200,643 + 38.9% Percent of List Price Received* –– –– –– 99.0% 99.0% 0.0% Inventory of Homes for Sale 1 0 - 100.0% –– –– –– Months Supply of Inventory 0.8 –– –– –– –– –– * Does not account for sale concessions and/or downpayment assistance. | Percent changes are calculated using rounded figures and can sometimes look extreme due to small sample size. A rolling 12-month calculation represents the current month and the 11 months prior in a single data point. If no activity occurred during a month, the line extends to the next available data point. Median Sales Price - Single Family Rolling 12-Month Calculation Gallatin County Greater Manhattan 1-2003 1-2005 1-2007 1-2009 1-2011 1-2013 1-2015 1-2017 $100,000 $150,000 $200,000 $250,000 $300,000 $350,000 $400,000 $450,000 Median Sales Price - Condo Rolling 12-Month Calculation Gallatin County Greater Manhattan 1-2003 1-2005 1-2007 1-2009 1-2011 1-2013 1-2015 1-2017 $0 $50,000 $100,000 $150,000 $200,000 $250,000 $300,000 Current as of November 10, 2018. All data from Big Sky Country Multiple Listing Service®. Report © 2018 ShowingTime.