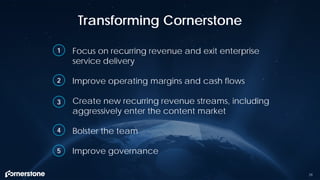
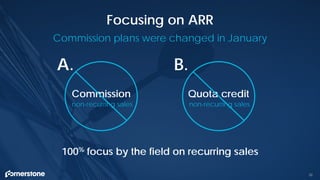
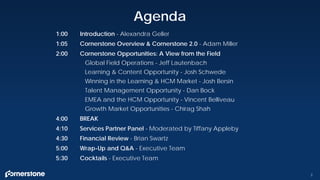
SlideShare a Scribd company logo
March 13, 2018
Financial Analyst & Investor Day
1:00 Introduction - Alexandra Geller
1:05 Cornerstone Overview & Cornerstone 2.0 - Adam Miller
2:00 Cornerstone Opportunities: A View from the Field
Global Field Operations - Jeff Lautenbach
Learning & Content Opportunity - Josh Schwede
Winning in the Learning & HCM Market - Josh Bersin
Talent Management Opportunity - Dan Bock
EMEA and the HCM Opportunity - Vincent Belliveau
Growth Market Opportunities - Chirag Shah
4:00 BREAK
4:10 Services Partner Panel - Moderated by Tiffany Appleby
4:30 Financial Review - Brian Swartz
5:00 Wrap-Up and Q&A - Executive Team
5:30 Cocktails - Executive Team
Agenda
2
This presentation includes forward-looking statements. These statements relate to, among other things, our future financial and operating performance, including our GAAP and non-GAAP guidance, the
growth of the learning and human capital management market, our business strategy, and our plans and objectives for future operations. In light of the risks and uncertainties outlined below, the future
events and circumstances discussed in this presentation may not occur, and actual results could differ materially from those anticipated or implied in the forward-looking statements. The Company has
based these forward-looking statements largely on its current expectations and projections about future events and financial trends affecting its business. Forward-looking statements should not be read as
guarantees of future performance or results, and will not necessarily be accurate indications of the times at, or by, which such performance or results will be achieved. Forward-looking statements are
based on information available at the date of this presentation and management’s good faith belief as of such date with respect to future events, and are subject to risks and uncertainties that could
cause actual performance or results to differ materially from those expressed in or suggested by the forward-looking statements. Important factors that could cause such differences include, but are not
limited to:
• Statements regarding the Company’s business strategies;
• The Company’s anticipated future operating results and operating expenses;
• The Company’s ability to attract new clients to enter into subscriptions for its solution;
• The Company’s ability to service those clients effectively and induce them to renew and upgrade their deployments of the Company’s solution;
• The Company’s ability to expand its sales organization to address effectively the new industries, geographies and types of organizations the company intends to target;
• The Company’s ability to accurately forecast revenue and appropriately plan its expenses; market acceptance of enhanced solutions, alternate ways of addressing learning and talent management
needs or new technologies generally by the Company and its competitors; continued acceptance of SaaS as an effective method for delivering learning and talent management solutions and other
business management applications; the attraction and retention of qualified employees and key personnel;
• The Company’s ability to protect and defend its intellectual property; costs associated with defending intellectual property infringement and other claims; events in the markets for the Company’s
solution and alternatives to the Company’s solution, as well as in the United States and global markets generally; future regulatory, judicial and legislative changes in the Company’s industry; changes
in the competitive environment in the Company’s industry and the markets in which the Company operates; and other factors discussed under “Risk Factors” and “Management’s Discussion and
Analysis of Financial Condition and Results of Operations” in the Company’s periodic reports filed with the Securities and Exchange Commission (the “SEC”).
Forward-looking statements speak only as of the date of this presentation. You should not put undue reliance on any forward-looking statement. The Company assumes no obligation to update any
forward-looking statements to reflect actual results, changes in assumptions or changes in other factors affecting future performance or results, except to the extent required by applicable laws. If the
Company updates one or more forward-looking statements, no inference should be drawn that it will make additional updates with respect to those or other forward-looking statements.
In addition to U.S. GAAP financials, this presentation includes certain non-GAAP financial measures. These non-GAAP financial measures are in addition to, not a substitute for or superior to, measures of
financial performance prepared in accordance with U.S. GAAP. Please see the discussion of these non-GAAP financial measures and their reconciliations to the most directly comparable U.S. GAAP
measures in the Company’s press release dated February 13, 2018.
Safe Harbor
3
Adam Miller
Founder & CEO
Cornerstone Overview
5
Our Market Opportunity
Work has Changed
6
WHAT
WHEREWHO
WHEN
HOW
Software is Eating the World
7
Mechanization
Water power
Steam power
1 2 3
Mass production
Assembly line
Electricity
Computer
Automation
Networks
4
Digital
Machine learning
Artificial intelligence
The Next Industrial Revolution has Arrived
8
9
Developing new skills is
essential to empowering
the next revolution
10
How we manage talent & develop skills
over the next 5 years will be
completely different from the last 20
11
A Shift in Focus is Required
Skills-based people management
Relationship-centric
Integrated people and work solutions
Real-time data empowered decision-making
Personalized leveraging machine learning
Automating HR data & processes
Financially motivated
Application and data silos
Historical, intuition-based decisions
One-size-fits-all approach
Transaction
focused
People
focused
to
Talent in the
Digital Age
 Consumer expectations
have entered the workforce
 Competition for skills and
experiences is intense
 Jobs are being redefined or
eliminated
 “Career Walls” are the new
career ladder
12
The Market Need is Real
13
Kara Goldin | 11. 10. 2017
From Gap to Gen Z: Why
Collaboration is More
Important Than Ever
Nuha Masri | 11. 7. 2017
4 Ways Technology Will
Shape the Future of Work
by 2020
Jeff Miller | 10. 17. 2017
Why a Culture of
Learning Should be Built
from the Top Down
Alexandra Gibbs | 10. 27. 2017
Why Taking Care of the
‘Human-Capital’ of Your
Employees is Vital
Jeffrey Selingo & Kevin Simon
10. 9. 2017
The Future of Your
Career Depends on
Lifelong Learning
14
Our goal is to meet the needs of the business with
ready leaders who can move into any business line
when they’re needed, ready to lead. Between the
T-Mobile team and our partnership with
Cornerstone, we are really making that happen.
“
”Melissa Lanier,
Director of Career and Leadership Development Programs
15
Cornerstone has allowed Hitachi to globalize HR
efforts in order to achieve growth. Our plans are
to increase the revenue of the non-Japanese
market by 45-50% or more.
“
”Levent Arabaci,
EVP & CHRO
16
Cornerstone has allowed us to grow from
being a product-focused company to one
that is seen as a leading solutions and
technology provider.
“
”Alban Jacquin,
Learners Experience Director
17
Using Cornerstone, we’ve since seen a 53%
increase in [employee] movement between
Hyatt brands. Employees feel like they have
even more options from a career standpoint.
“
”Randy Goldberg,
Vice President , Talent Management
18
With Cornerstone, it takes two minutes to verify
someone is administratively and logistically ready to
deploy. It makes a huge difference. We sent 60
volunteer responders to Nepal and only had to make
one phone call. We had zero misses.
“
”Pat Ross,
Deputy Director of Membership
19
Cornerstone helped us move from a
heterogenic, localized learning approach to
one that is aligned across all business units and
markets. We’re seeing employees take more
initiative with Cornerstone.
“
”Gerard Pieterse,
Learning & Development Director
What went wrong?
22
In the Past, We Focused Only on Total Sales
Total New Sales by Year
Note: charts are illustrative and not drawn to scale.
2012 2013 2014 2015 2016 2017
New ARR One-Time FX
23
…But Our Sales Mix Shifted Negatively
New Sales Composition
2011 2013 2015 2017
Recurring ServicesNew ARR One-Time
15pts lower
than in 2011
Note: charts are illustrative and not drawn to scale.
24
Q1 '15 Q2 '15 Q3 '15 Q4 '15 Q1 '16 Q2 '16 Q3 '16 Q4 '16 Q1 '17 Q2 '17 Q3 '17 Q4 '17
Also Missed a Product Cycle in Learning in 2015
25
New startups begin
entering corporate learning
LinkedIn announces
LinkedIn Learning
Cornerstone announces
Learning Experience
Platform & Content Anytime
Workday announces
Learning product at
Workday Rising
26
• Brexit
• Mid-market over-investment
• Spread too thin internationally
Other Challenges
Strategic Plan
2.0
Focus on recurring revenue and exit enterprise
service delivery
Improve operating margins and cash flows
Create new recurring revenue streams, including
aggressively enter the content market
Bolster the team
Improve governance
Transforming Cornerstone
29
1
2
3
4
5
30
31
1. Focus on Recurring Revenue
31
Commission
Focusing on ARR
32
100% focus by the field on recurring sales
Commission plans were changed in January
Quota credit
non-recurring salesnon-recurring sales
A. B.
Shifting Delivery to Partners
33
Enterprise Deals
• Partner “papers” all services work
• Cornerstone provides “delivery assurance”
• Cornerstone oversees delivery success
Partner Client
Enterprise and Strategic Clients
Mid-Market and SMB Clients
• Client contracts services directly with Cornerstone
• Cornerstone “papers” all services work
• Services charged as recurring fees
• Cornerstone owns delivery success
Client
Mid-Market and SMB Clients
34
Activating Our Ecosystem
35
New for Us, Not for Clients (or Partners)
Everybody does this
• Improves margins
• Simplifies the business
• Frees up sales rep time
• Incents partners to support us
The Benefits
36
37
2. Get fit
Improve
Operating Margins
and Cash Flows
Sales & Marketing Spend – Trailing Our Peers
2017 S&M Spend as % of Revenue
38
Sales & Marketing Spend Now
2018 S&M Spend as % of Revenue
39
Operational Excellence Drives Profitability
40
Enterprise Service Delivery Exit
Self Service Support
Enhanced Commission Plan
Sales Headcount Optimization
Annual Price Escalators
Intelligent Pricing
Salesforce Productivity
Order to Cash Automation
Strategic Sourcing
Projects
1
2
3
4
5
6
7
8
9
Sales &
Marketing
Cost of Sales
General &
Administrative
41
3. Grow
Create New Recurring
Revenue Streams
New Recurring Revenue Streams
42
Tech Services
Client Success
Packages
Content
Learning
43
Online classes only
The Content Opportunity is Enormous
2017 Registrations
392M
2017 Completions
235M
Cornerstone
Content Anytime
• Recurring subscription content model
• Usage-based partner revenue sharing
• Over 3,000 courses available
• Fully-integrated in Cornerstone Learning
• Available NOW
44
45
Customer Success Packages:
Now Recurring
Technical
Support
Education
& Training
Answer
Desk
Client
Community
System
Adoption
Optimization Customer
Success
Release
Readiness
46
Tech Projects: Now Recurring
Inbound
Data Feeds
Outbound
Data Feeds
SSO
Web
Services
Data
Warehouse
Encryption
• Cornerstone continues to do all
tech projects
• Recurring charge for tech
projects, such as “Connectors”
for inbound and outbound feeds
• Drive further efficiencies with
Cornerstone Edge
47
4. Bolster the Team
Half of the Executive Leadership Team is New in 2018
New Additions
• Hired Jeff Lautenbach as President of Global Field Operations
• Hired Adrianna Burrows as Chief Marketing Officer
• Hired Chris Wheaton as VP of Field Operations
• Hired Jennifer Gianola as VP of Investor Relations
Exits
• Kirsten Helvey, COO
• Dave Carter, Chief Sales Officer
• Frank Ricciardi, GM of Asia Pacific
• Matt Gahr, VP Sales
Bolstering the Team
48
49
5. Improve Governance
• Added three new directors in 2017
• Planning to add two new directors in 2018; one new director in
2019
• By the end of 2018, we expect that the majority of the board will
have joined in the last two years
• Plan to appoint a new chairman in 2018
• June shareholder vote to declassify the board, beginning in 2019
Improving Governance
50
51
• Diagnosed issues
• Got fit
• Grow and grow
To Summarize
Jeff Lautenbach
President, Global Field Operations
Global Field Operations
53
Background
Over 25 Years of Experience
• Go-to-market leadership roles
• Scaling and transforming
global businesses
• Building and executing growth
strategies
• Optimizing customer
segmentation
Leadership position in
Learning & Talent is
undeniable
Initial Observations
54
Individual reps are solid
sales people
TAM is large, highly
fragmented, and growing
2 31
54
Magic Quadrant for Talent
Management Suites
Source: Gartner (February 2017)
NICHE PLAYERS VISIONARIES
CHALLENGERS LEADERS
COMPLETENESS OF VISION
ABILITYTOEXECUTE
Technomedia
Haufe
SumTotal
Halogen
Software
Saba
Oracle
(Talent Management Cloud)
SAP
(SuccessFactors)
Talentsoft
Cornerstone is the Market Leader
in Talent Management
55
400M
ADDRESSABLE
SEATS
Source: Cornerstone estimates, adapted from IDC, US Census Bureau
35M
CSOD SEATS
BY MARKET SEGMENT
BY GEOGRAPHY
ADDRESSABLE MARKET
150M
ENTERPRISE
150M
MID MARKET 100M
SMB
155M
NORTH
AMERICA
32M
LATIN
AMERICA
139M
EUROPE,
MIDDLE EAST
& AFRICA
74M
ASIA
PACIFIC
The Market is HUGE
56
Highly Fragmented Markets = Opportunity
57
None
17%
Oracle Taleo
12%
SAP
SuccessFactors
10%
Skillsoft
5%
Kenexa
5%
Other
48%
Recruiting
None
18%
SAP
SuccessFactors
12%
Oracle Taleo
9%
SumTotal
5%ADP
4%
Other
46%
Talent
In each of our markets, we face a varied list of competitors. We intend
to use our scale to grow market share in each segment.
SAP
SuccessFactors
19%
None
16%
Unknown
7%
Saba
5%
Other
41%
Learning
Source: Company Data.
The Workday “Threat” Has Been Overblown
58
Cornerstone only competes
with Workday in a subset of
it’s total business
Workday primarily competes
in the United states
Workday is ONLY selling talent
to their ERP base
1. Sales focus had been on “easy wins” (i.e. services) at the
expense of recurring sales which drive growth (Recruiting,
Performance, Cornerstone HR)
2. Company missed a product cycle when LEPs came to market
3. Some damage was self-inflicted,especiallyin the Enterprisesegment
4. Marketing message has been weak; market does not
understand breadth of Cornerstone’s capabilities
5. Sales processes are sub-optimized and need major over-haul
So What is the Issue?
59
Improve productivity
Activate the base
Enter the learning content market
Sell recruiting suite
Leverage vertical momentum
60
The Solution: Drive ARR Growth
1
2
3
4
5
1. Improving Productivity
61
1. Instituted more disciplined go-to-market cadence
2. Created global field ops and global enablement teams
3. Improved pricing discipline; introducing deal desk
4. Established sales and marketing interlock to ensure better alignment
5. Created new global dashboards and enhanced reporting
2. Activating the Base
62
Have 3+
products
70%
Approximately
40%
Approximately
Note: Data represents purchase of an application with one of the Cornerstone product suites
Have 2+
products
• Introducing top account program
• Leveraging deal desk and
renewals team
• Analyzing sales & marketing data
to drive better decision-making
and resource allocation
• Driving U.S. to match international
Recruiting sales rates
63
3. Entering the Learning Content Market
Go Big or Go Home!
Content Anytime deal
sizes exceeding our
highest expectation
We will aggressively
attach Content to
Learning deals
4Q17 launched Content
Anytime & Learning
Experience Platform
64
Innovation in Driving Recruiting Success
4. Selling Recruiting – Accelerate Growth
Q1
2013
Q4
2017
Applicant
Tracking
Onboarding
Campus
Recruiting
Selection
Candidate
Experience
Recruiter
Experience
Candidate
Relationship
Management
Why recruiting growth now?
• Established market incumbents are not innovating
• Newer entrants look slick but still play in mid-market
• Differentiating on product front
5. Capitalize on Vertical Momentum
• Drive alignment, focus and urgency – SLED+FED+HC
• Identify Extended Enterprise opportunities in Public Sector
• Examples include Opioid Crisis, preventive care, certifications, constituent learning
• Expand Federal into DOD
PUBLIC SECTOR GREW NEW ARR IN 2017 BY
GREATER THAN 150% YOY
65
66
Bonus: Execute Partner 1ST Model
Drive productivity
and engagement
Ensure client
success
Ensure partner
readiness
Focusing marketing
on more strategic
initiatives
Alliances
Partner
Opportunities
Enablement
Partner
Marketing
67
Opportunities Abound When We Execute
Learning
Talent
Management
Human Capital
Management
Growth
Markets
Learning & Content Opportunity
Josh Schwede
Head of Learning Content
69
CEOs Must Upskill and Reskill
Their Workforce
CEOs expect digital
tech to disrupt their
company
CEOs think their
company is not
equipped with the
right skills to adapt
(Deloitte 2017)
70%90%
70
Rising Employees Demand
More Learning
Say a clear career path
would compel them to
stay with an
organization longer
(Mercer 2015)
78%
Say development is
important in a job
(Gallup 2017)
87%
(Deloitte 2017)
Are likely to leave
because they’re not
learning enough
42%
71
Skills have become the
New Digital Currency
How people
consume video
How people
consume audio
At the Same Time,
Consumer Habits Have Changed
72
73
3
Blended
learning
4
Social
learning
5
Modern workplace
learning
FORMAL INFORMAL
1
Classroom
training
2
E-Learning
Source: Hart, Jane, “5 Stages of Workplace Learning (Revisited 2017)”
Workplace Learning Continues to Evolve
74
Cornerstone Learning
Modern learning requires a holistic strategy
75
Learning
Experience
(LEP)
Learning
Management
(LMS)
Modern
Content
Cornerstone Learning
Learning Management
Cornerstone Learning
76
Learning Experience
Cornerstone Learning
77
Content Opportunity
Organizations are Playing a Constant
Game of Catch-up
Expensive,
outdated content
Top-down vs.
Bottom-up learning
Manual curation
and learning paths
Complex Vendor
Management
79
Old Content Doesn’t
Work on Mobile
80
1:1,000 Ratio
81
1 L&D professional for every
1,000 learners
Source: Bersin by Deloitte, 2017
82
Cornerstone Content Anytime
PRE-CURATED
Constantly Evolving
Library Topics
• Business Skills
• Creative
• Health & Wellness
• Leadership & Management
• Office Productivity
• Personal Development
• Sales & Service
• Technology
4PREMIER
PARTNERS
2,500+COURSE OFFERINGS
83
Content Anytime: European Edition
PRE-CURATED
Constantly Evolving
• Office Productivity
• Personal Development
• Sales & Service
• Technology
• Business Skills
• Creative
• Health & Wellness
• Leadership & Management
5PREMIER
PARTNERS
2,500+COURSE OFFERINGS
English
Spanish
German
French
Portuguese
Library Topics
84
Custom Curated Packages
• Leadership & Management
• Office Productivity
• Personal Development
• Sales & Service
• Technology
• Business Skills
• Compliance
• Continuing Education & Certifications
• Creative
• Health & Wellness
• Industry Specific
34K+MULTILANGUAGE COURSE OFFERINGS
30+PREMIER PARTNERS
Library Topics
84
85
We Know Content!
Cornerstone Learning Suite
Online classes only
2017 Registrations
392M
2017 Completions
235M
85
86
Content
Gross Revenue
50%
50% CSOD
Content
Providers
20%+
OPERATING MARGIN
Content Economics
Content Subscription Margins
87
Recent Content Anytime Deals
Client Industry Location
No. of
Users
Content vs. Learning
RPU Multiple
Manufacturer France 500 10x
Retailer United States 1,000 7x
Engineering United Kingdom 750 5x
Oil & Gas United Kingdom 20,000 4x
Insurance United States 3,000 3x
Based on Content Anytime Deals through 12/31/2017
88
3-10x
Content Anytime
RPU of Learning
100%
Size of Content
Opportunity Overall
Relative to Learning
~$225M
ARR Opportunity Today
What We’ve
Seen
Relative
Opportunity
Today’s ARR
Opportunity
Content at Scale
Sizing the Content Opportunity for Cornerstone
89
+
VIDEO
Winning in the Learning
& HCM Market
Josh Bersin
Founder, Deloitte by Bersin
Josh Bersin
Principal and Founder, Bersin™
Deloitte Consulting LLP
Copyright © 2018 Deloitte Development LLC. All rights reserved.
The Red Hot
Corporate
Talent and
Learning
Markets
A new era of growth
Robots and AI
77% of CEOs expect the role of AI, Robotics,
and Automation to “increase significantly”
over the next 2 years.
Source: Robots: The new low-cost worker, Dhara Ranasinghe, CNBC, April 10, 2015. https://www.cnbc.com/2015/04/10/robots-the-new-low-cost-worker.html
Source: China Can’t Buy Enough Industrial Robots, Jethro Mullen, CNNTech, June 23, 2016 http://money.cnn.com/2016/06/23/technology/china-industrial-
robots/index.html
How the Global Economy Has Changed
The value of “brand, IP, and services” is skyrocketing
http://www.oceantomo.com/intangible-asset-market-value-study/
http://brandfinance.com/images/upload/gift_report_2017_bf_version_high_res_version.pdf
Hiring is as hard as it has been since 2001 and “time to hire” is even greater
Unemployment Rate Nearing Record Lows
End of
Korean War
Vietnam
War
https://www.thebalance.com/unemployment-rate-by-year-3305506
Black
Monday
Dot Com
Dot Bomb
Financial
Crisis
1970- 1976
6.2% jumping to 12.3 % Inflation
2007
4.1% Inflation
Mean “time to hire” for new hires
is 31 days, higher than it was in
2001.
http://dhihiringindicators.com/wp-content/uploads/2018/01/2018-01-DHI-Hiring-Indicators-Report-FINAL-2.pdf
Expected to drop
to 3.9%
CEOs, CFOs, CHROs agree on #1 issue: risk of retaining and attracting top talent
Talent Is Now the #1 CEO Issue
TCB-1652 Conference Board C-Suite Challenge 2018, n=570
Reinvention of the Talent
Management market
A new war for labor and skills.
Productivity, AI, and Analytics Driving The Next Wave
1990s-2000s 2004-2012 2012-2017 2018+
Automated
talent management
Integrated talent
management
Engagement, fit,
Culture, analytics
Productivity,
performance, teams
Automate PerformIntegrate Engage
Shift from talent management to team and work management
Talent management:
integrated processes and
systems, talent as core to HR
and business agenda
Systems of automation
Practice-driven
solutions
People management:
focus on culture,
engagement, environment,
leadership, and fit
Systems of engagement
Empowerment
solutions
Team and work
management:
optimizing productivity,
alignment, connection of the
“network of teams”, tools to
make work better.
Systems of
productivity
Productivity-driven
solutions
• Core HR Technology spending is slowing
(41% say it’s flat)
• Clients not fully satisfied: only 21% of customers say
talent systems “always meet their needs.”
• Two biggest growth areas are Learning and
Analytics (37% yty)
• Career, succession, onboarding, analytics hottest
functional needs
• User satisfaction is 2/3 lower than
vendor satisfaction
How will you upgrade
your HR technology?
Sources: Sierra-Cedar 2016–2017 HR Systems Survey White Paper, 19th Annual Edition, and Sierra-Cedar 2017–2018 HR Systems Survey White Paper, 20th Annual Edition
used with permission and 2016 Bersin by Deloitte HR Systems Research
Multiple pathways to an HR tech transformation
todays state of replacing HR technology
HighriskLowrisk
ReactiveFocused
Current state
22%
Rip & replace
Move everything all at once
to the cloud
25%
Hybrids
Move ONLY TM or WFM
apps to cloud
22%
Parallel / Patchwork
Combination licensed and
cloud solutions
19%
Hosting / Outsource
Single tenant or BPO
Shift to cloud is important, not sufficient
Rip and replace pace slows
Feedback and
engagement
Reinventing
performance
Video-based
learning & career
Social
recognition
Well-being
Work – Team
management
2018 and beyond: From Talent Management to Management
Marketgrowth-adoption
2016
Pulse
survey
Text
analytics
Mobile
feedback
2020
Culture
assessment
Coaching
tools
Checkins
with feedback
Agile, open
goal management
Org network
analysis
Recognition
everywhere
Custom rewards
programs
Customer
recognition
Progression over time
Video learning
Content
curation
Intelligent
learning
Career
planning
Gamification
accreditation
Well-being
fitness tracking
Competitions
social sharing
Points
gamification
Fitness merges
w/ engagement
Virtual work
management
Document
management
Goal sharing
Goal tracking
Communications
messaging
Process
automation
Integration &
new talent apps
Analytics driven
“Systems of
engagement”
Apps that
“Make work life
better”
Total Addressable Market: $16.9B in US (2/3 in companies < 500)
The exponential importance of learning
A business, economic, and social imperative
“The learning curve is the earning curve.”
A New War for Skills
2/3 of companies believe they have a shortage of technical and complex problem solving skills
2.8
2.9
3
3.1
3.4
3.6
4.4
4.5
5.5
5.5
5.6
5.7
6.5
9.8
0 1 2 3 4 5 6 7 8 9 10
Head of Customer Experience
Reliability Engineer
Marketing Content Manager
Guest Experience Manager
Licensed Realtor
Head of Partnerships
Peronsal Loan Consultant
Brand Partner
Big Data Developer
Full Stack Engineer
Customer Success Manager
Sales Representative
Data Scientist
Machine Learning Engineer
Most In-Demand Jobs 2018
Soft Skills
Tech
https://economicgraph.linkedin.com/research/LinkedIns-2017-US-Emerging-Jobs-Report
Most In-Demand Skills
Most In-Demand Capabilities
Yet until now, L&D had not been keeping up
75%
of the workforce will be made up of
Millennials by 2025, yet 45% tell us they
get no leadership development at all.
45%
of North American survey respondents
think their current skills will be
inadequate in three years
Source: A New Model for Corporate Learning, by Karie Willyerd, Alwin Grünwald, Kerry Brown, Bernd Welz, and Polly Traylor, Deloitte Human Capital Trends 2017, Deloitte Millennial Survey
2017, Bersin High-Impact Learning Organization 2017, Deloitte Human Capital Trends 2017 and 2018
of survey respondents think their
companies are not giving them
opportunities to develop future careers
59%
The Net-Promoter
Score of L&D rated
by non HR
professionals is -15!
- Bersin HILO 2017
We are here
E-Learning
& Blended
1998-2002 2005 20182010
Self-Study
Online Learning
Course Catalog
Online University
2020
Learning
In Flow of
Work
LearningInTheFlow
ofWork
Instructional Design
Kirkpatrick
LMS as
E-Learning Platform
Talent
Management
Career Focused
Lots of Topics
Learning Path
Career Track
Blended Learning
Social Learning
LMS as Talent
Platform
Continuous
Learning
Everyone, All the
Time, Everywhere
Micro-Learning
Real-time Video
Courses Everywhere
Design Thinking
Learning Experience
LMS invisible
Data Driven, Mobile
Learning
Experience
Learning On Demand
Embedded Learning
Video, Self-Authored
Mobile, YouTube
70-20-10
Taxonomies
LMS as Experience
Platform
Formats
Philosophy
Users
Systems
Source: Bersin by Deloitte, Deloitte Consulting LLP
From e-learning to “learning in the flow of work”
We are entering a whole new era of L&D technologies and architecture
L&D Market Size: Content, Technology, Staff
Tuition Reimbursement,
$27.0
Managerial, $29.6
Compliance, $23.3
Process/Procedure,
$21.1
Sales, $19.0Onboarding/orientatio
n, $17.3
Professional (engr,
acct, legal), $16.9
IT and desktop, $16.7
Soft skills, interpersonal,
$16.5
Executive/leadership,
$14.6
Customer Service,
$12.7
Product Education,
$12.7
Basic skills, $6.1
Total Worldwide L&D Spending by Program
($ Billion)
US: $141 Billion
Global: $211 Billion
Sources: ATD Market Study, Bersin Corporate Learning Factbooks, Toward Maturity Benchmark Surveys, Sierra-Cedar HR Systems Survey, Bersin Proprietary Research
The L&D Marketplace Is Growing Rapidly
-11%
2%
10%
12%
10%
8%
7%
2008-2009 2010-2011 2011-2012 2012-2013 2013-2014 2014-2015 2016-2017
L&D Global Spending YTY Growth Rate
Sources: ATD Market Study, Bersin Corporate Learning Factbooks, Toward Maturity Benchmark Surveys, Sierra-
Cedar HR Systems Survey
Breakdown of Corporate Learning Spend
Training Tools and Technology Market
LMS Platforms $6 Billion
Development Tools $1.5 Billion
Other equipment, facilities, technologies $11.5 Billion
Spend Category Pct of budget WW Spend Billion
Internal Payroll and Facilities 41% 86.71$
External learning providers (content and programs) 26% 54.99$
Tools and technology 9% 19.03$
Tuition Reimbursement 13% 27.49$
Administration 11% 23.26$
100% 211.48$
Sources: ATD Market Study, Bersin Corporate Learning Factbooks, Toward Maturity Benchmark Surveys, Sierra-Cedar HR Systems Survey, Bersin Proprietary Research
L&D Market: Content and Programs
Managerial, $7.88 ,
14.3%
Compliance, $6.19 ,
11.3%
Process/Procedure,
$5.63 , 10.2%
Sales, $5.07 , 9.2%
Onboarding/orientation,
$4.61 , 8.4%
Professional (engr, acct,
legal), $4.50 , 8.2%
IT and desktop, $4.45 ,
8.1%
Soft skills, interpersonal,
$4.39 , 8.0%
Executive/leadership,
$3.88 , 7.1%
Customer Service, $3.38
, 6.1%
Product Education,
$3.38 , 6.1%
Basic skills, $1.63 , 3.0%
Total Worldwide Content And Program Spending by
Program ($ Billion)
US: $36.7 Billion
Global: $54.9 Billion
Leadership + Mgt: $11.8B
Sales + Cust Svc: $8.5B
General Softskills: $4.4B
IT/Tech/Prof: $8.95B
Sources: ATD Market Study, Bersin Corporate Learning Factbooks, Toward Maturity Benchmark Surveys, Sierra-Cedar HR Systems Survey, Bersin Proprietary Research
Source: Meet the Modern Learner: Engaging the Overwhelmed, Distracted,
and Impatient Employee, Bersin by Deloitte, Deloitte Consulting LLP
The Reality of Learning Today:
24 Minutes A Week
24 minutes a
week
And… We are living longer.. stretching the talent cycle
“Since 1840 there
has been an
increase in life
expectancy of three
months for every
year.”
Source: Gratton, Lynda; Scott, Andrew.
The 100-Year Life
Today’s
Millennials have
a 50% chance of
living to 100+
Increase in Life Expectancy Over Time
Source: http://www.mortality.org/
Will
Generational
Bias Be the Hot
Button of 2018?
Buidling a completely new career model in companies
Redesigned: 58% of companies are
redesigning or planning to
redesign their career model
Deloitte HC Trends 2017
Open Models: While 33% of companies
promote vertical career moves, 67%
now promote horizontal or project
based career progression, and 83%
expect to have “open career models”
in next 3-5 years.
Deloitte HC Trends 2017
More Dynamic:
31% of companies expect careers
to be 3-5 years long, and 60%
expect them to be 10 years or less
Deloitte HC Trends 2017
Learning and career management
software is the #1 fastest growing
segment in HR technology
(Sierra-Cedar 2016– 2017 Survey
HR White Paper)
Yet….54% of companies have no firm
plans to build new career systems for
their employees yet.
Deloitte HC Trends 2018
Many learning tools are needed
Source: Toward Maturity, 2017 and Learning Technology Survey, Don Taylor, 2017
Source: Sierra-Cedar HR Systems Study, 2017
Change Has
Come:
38% of LMS users
want to “improve
the user
experience”
28% of companies
are buying a new
core learning
platform
14% are planning
on replacing their
LMS
New Learning Tech Segments Are Here
Learning Experience
Platforms
Degreed, EdCast, PathGather
Jam, Fuse, Percipio, Cornerstone,
Valamis, Tribridge, …
Program Experience
(Delivery) Platforms
Intrepid (Vitalsource), NovoEd
EdX, Everwise, OpenEdX, Blackboard,
Instructure, ...
Micro Learning
Platforms
Axonify, Grovo, Qstream, Practice,
Rehearsal, Jubi, Wisetail, Mindtickle, etc.
LMS and Content Platforms
Traditional: Cornerstone, Saba, SuccessFactors, SumTotal
Modernized: Workday, Oracle, SAP, Bridge, D2L, Litmos, Intellum, Docebo, others
Assessment, VR, Development Tools
Video Authoring, Intelligent assessment, spaced learning,
gaming, virtual reality, collaboration, simulations, …
Content Libraries
Udacity, Coursera, EdX, Udemy, Pluralsight,
SkillSoft, CrossKnowledge, hundreds of others
Learning Record
Store
GrassBlade, Learning Locker,
Saltbox, Yet, Watershed
Source: Bersin by Deloitte, Deloitte Consulting LLP
1 2 3
4 5
6 7
Companies Are Not Yet Ready And Need Vendor Support
2018 Bersin Learning Organization Maturity Model
Source: 2017 Bersin by Deloitte High-Impact Learning Organization, n=1,200, >1,000 employees; Bersin by Deloitte, Deloitte Consulting LLP
Episodic / Programmatic
Level 1
Responsive / Contextualized
Level 2
Continuous / Empowering
Level 3
Anticipatory / Flow
Level 4
6%
20%
39%
35%
believe their
employees are fully
aligned with the
corporate purpose
23%
believe internal
processes for
collaboration
are working well
14%
are excellent
at building
a differentiated
employee experience
22%
are using design
thinking as part
of crafting the
employee
experience
10%
Say problem is
urgent
38%
Culture, engagement, and beyond
Focus on the employee experience
Source: Deloitte and Facebook, “Transitioning to the future of work and the workplace,” November 2016
Self Service Intelligent ServicesCase Mgt. AI/Voice App Interfaces
Engagement
Feedback
Recognition
Learning
Career
Coaching
Performance
Goals
Succession
HRMS
Payroll/Time
Communications
Analytics/AI
ONA
Workforce Mgt
Wellbeing
Rewards
Benefits
Sourcing
Recruitment
Assessment
White collar Hourly Senior leaders Line managers Candidates Contractors External network Alumni
Senior Geographic
Business Partners
Talent Specialists
(OD, sourcing, recruiting, learning,
organized in networks of excellence)
Wellbeing, safety, culture,
engagement, recognition
Analytics, Monitoring,
Predictive, WF Planning
HR Tech,
App development
Research, Market
Best Practices,
Comp, Ben, Rewards HR Prof DevelopmentHR Ops, AI and Bots,
Intelligence
Junior
Geo Bus Partners
Teams@Work
(productivity, services, team
management, wellness, feedback,
recognition, learning)
People@Work
(productivity, services,
team management,
wellness, feedback,
recognition, learning)
Candidates@Life
Candidates (products,
jobs, projects,
opportunities)
Leaders@Work Alumni@life
Learning and HR Technology Architecture Of The Future
Dan Bock
Senior Vice President of Sales
North America
Talent Management Opportunity
117
Talent is the Competitive Advantage That Will
Define the Winners & Losers of the 21st Century
Success in business is all about people,
people, people. Whatever industry a
company is in, its employees are its biggest
competitive advantage.
-Richard Branson
“
”
118
How we manage talent & develop
skills in the next 5 years will be
completely different from the last 20
+ +=
RecruitingPerformanceLearning
• RECRUITING MANAGEMENT
• CAMPUS & EVENT RECRUITING
• CANDIDATE RELATIONSHIP MANAGEMENT
• ONBOARDING
• PERFORMANCE MANAGEMENT
• ENGAGE
• SUCCESSION MANAGEMENT
• COMPENSATION MANAGEMENT
• LEARNING MANAGEMENT
• CERTIFICATIONS
• CONNECT & COLLABORATE
• INSIGHTS
• EXTENDED ENTERPRISE
119
The World’s #1 Solution for
Unified Talent Management
Cornerstone Learning
• Foster collaborative learning
with fresh content
• Enable online &
mobile training
• Manage competencies
& certifications
• Build communities &
activity streams
• Easily administer learning
Modern learning to inspire
continuous development
120
Cornerstone Performance
• Facilitate continuous
feedback & coaching
• Develop aligned goals
• Foster career mobility
• Manage compensation
with ease & precision
• Identify top performers
& future leaders
Continuous performance
management to drive
engagement and results
121
Cornerstone Recruiting
• Branded candidate experience
• Social sourcing
• Recruiting analytics
• Robust talent pipelines
• Improved process efficiency
• New hire onboarding tracking
Next-generation recruiting
to attract, select and
onboard top talent globally
122
123
Canon Visualizes their Talent
with Cornerstone
25%
Increase in
internal hires
84%
Performance review
completion across 22
countries
Launched
self-directed learning
initiative across the
globe
124
ResCare Transforms People’s
Lives with Cornerstone
32%
Reduced application
completion time
48%
Reduced
time-to-hire
5%
Increased application
flow
Cornerstone
7.6%
SAP
7.1%
Oracle
4.5%
IBM
3.5%
Workday
3.3%
ADP
3.2%
Saba Halogen
3.2%
iCIMS
2.4%
SumTotal;
People Fluent
2.2%
Ultimate
0.9%
Other
59.9%
Talent Management
Market Remains
Highly Fragmented
125
Talent Management Market
Share (2017)
Source: IDC Corporation, company estimates
7.1%
4.5%
3.2%
2.2%
3.2%
2013 2014 2015 2016 2017
Cornerstone Continues to Gain Market Share
126Source: Industry analysts, market research, Cornerstone estimates. Talent management includes learning, recruiting, performance management software
Talent Management Market Share 2013-2017
5.5%
7.6%
Cornerstone Recruiting
0
500
1,000
1,500
2,000
2,500
3,000
3,500
Learning Performance Recruiting Cornerstone HR
Existing Client Penetration Client Opportunity
NumberofClients
Calculated based on 3,250 clients with approximately 10,850 users on average
Clear Opportunity in Recruiting
128
50% penetration
in Recruiting is a
$100M+
incremental ARR
opportunity
• Candidate Communication
• Employer Branding
• External Sourcing
• SEO & Google Analytics
• Campus Recruiting /
Interview Events
• Candidate Search
• Assessments
• Talent Scoring
• Talent Pools
• Selection
• Interview Management
• Background Checks
• Agency Portal
• Partner Integrations
• Reporting
• New Hire Portals
• Onboarding Tracking
• Forms Management
• Automatic Workflows
• Dashboards
• Requisition Management
• Applicant Tracking
• Batch Actions/High Volume
OnboardHire
Measure
*Available with purchase of Selection
Cornerstone’s Recruiting Suite Supports
the Entire Talent Acquisition Process
129
Select
Mobile and Localized
Attract
50%
130
Increased Investment in Recruiting
More Engineering
Resources in 2018
131
Two Critical Areas of Focus
Recruiter
Experience
Candidate
Experience
132
Cornerstone Recruiting Becomes Best-in-Class in May
133
Cornerstone Recruiting Becomes Best-in-Class in May
134
VIDEO
Vincent Belliveau
Executive Vice President & General Manager, EMEA
HCM Opportunity & EMEA
EMEA Continues to Expand its Footprint
136
10M+
Users
650+
Clients
21
Countries
30
Languages
NOTE: USER AND CLIENT COUNT FIGURES EXCLUDE GROWTH EDITION AND CORNERSTONE FOR SALESFORCE.
AS OF DECEMBER 31, 2017
2016 Was a Lost Year
138
2
4 4
13
5
14 13
16
0
5
10
15
20
25
30
35
Qtr1 Qtr2 Qtr3 Qtr4
Existing New
• 32% of all new logos included
Cornerstone HR in scope
• 38% of all new ARR $s included
Cornerstone HR
• 18% of new ARR $s in existing
accounts included Cornerstone
HR
HCM-driven business
(EMEA stats)
…Followed by a Solid Comeback in 2017
Led by Accelerating Traction with Cornerstone HR in 2017
with Both New and Existing Clients
Our HCM Value Proposition
and Opportunity
Digital transformation
of HR processes
Driving employee
experience
Key Drivers in HCM
HR
140
Legacy Core HR Technology
is Simply Outdated
Do Nothing Rip & Replace
Organizations Used to Have
Two Choices
or
142
14% 12% 15% 13%
5%
14%
19%
13% 13%
18%
22%
19%
19%
16%
16%
13%
13%
10% 9%
7%
64% 69% 66% 71%
79% 73% 68%
77% 78% 75%
0%
10%
20%
30%
40%
50%
60%
70%
80%
90%
100%
TCPU Public Admin Financial
Services
Retail Higher Ed Other Services Healthcare Manufacturing High-Tech AMC
Replace Upgrade Do Nothing
Addressing the Core HR Opportunity
143Source: Sierra Cedar 2015–2016 HR Systems Survey 18th Annual Edition
Cornerstone HR is attempting to address the “do nothing” segment vs.
upgrade (primarily PeopleSoft) & replace (primarily Workday)
Cornerstone’s Approach is Different
Low time
and cost to
value
Focused on the
experience
Lower
risk
Accelerates
transformation
144
An Employee-centric Approach to HCM
HR TransactionsHR AdministrationTalent Management Analytics
SUCCESSION PLANNING ENGAGEMENT SURVEYS
COMPENSATION PLANNING BENCHMARKING
LEARNING & DEVELOPMENT INSIGHTS & PREDICTIONS EMPLOYEE SELF-SERVICE TIME & SCHEDULING
ONBOARDING REPORTING & ANALYTICS RECORDS ADMINISTRATION PAYROLL MANAGEMENT
PERFORMANCE & GOALS ORGANISATIONAL VISUALISATION BENEFITS MANAGEMENT
RECRUITING & STAFFING WORKFORCE PLANNING ORGANISATIONAL MANAGEMENT ABSENCE MANAGEMENT
Cornerstone Marketplace
Transformational HR
Transactional HR
+ +=
The World’s #1 Solution for
Unified Talent Management
RecruitingPerformanceLearning
• RECRUITING MANAGEMENT
• CAMPUS & EVENT RECRUITING
• CANDIDATE RELATIONSHIP MANAGEMENT
• ONBOARDING
• PERFORMANCE MANAGEMENT
• ENGAGE
• SUCCESSION MANAGEMENT
• COMPENSATION MANAGEMENT
• LEARNING MANAGEMENT
• CERTIFICATIONS
• CONNECT & COLLABORATE
• INSIGHTS
• EXTENDED ENTERPRISE
146
147
Analytics
Discover PredictReport Plan
State-of-the-art
Cornerstone
View
Cornerstone
Insights
Cornerstone
Reporting
Cornerstone
Planning
Import Integrate
Edge Import
Easily map and load data
into Cornerstone
Edge Integrate
Easily purchase and manage
integrations with 3rd-party apps
Develop
Edge Develop
Build external applications and
reports using Cornerstone APIs
Making Integrations Easy
Cornerstone Edge
148
Cornerstone HR Transforms HR Administration
• View & manage all employee
records in one place
• Empower employees to
manage personal data
• Build configurable
organizational hierarchies
• Control Personally Identifiable
Information (PII) access
• Create headcount forecasts
Modern HR administration –
without the rip-and-replace
price tag
149
Selected Cornerstone HR Clients
Cornerstone is Gaining Traction in HCM
Fosway 9-Grid for Cloud HCM
Source: Fosway (October 2017)
Advanced into the CORE
CHALLENGER
position in the October 2017
Fosway 9-Grid, progressing
from last year’s position as a
POTENTIAL CHALLENGER
PERFORMANCE
POTENTIAL
Potential Leader
Potential Challenger
Potential Performer
Strategic Challenger
Core Challenger
Solid Performer
Strategic Leader
Core Leader
Poor Performer
‘Oct. 2017
‘Oct. 2016
151
Cornerstone HR’s Impact on Deals
152*EMEA deals from 2016-2017
Average deal values converted from local currency to USD
Average Suites Purchased
Average RPU
1.7
3.5
Without Cornerstone HR With Cornerstone HR
~$20
~$60
Without Cornerstone HR With Cornerstone HR
• In the past two years, EMEA has
seen that clients purchasing
Cornerstone HR buy ~2x more
product suites on average
• Inclusion of Cornerstone HR also
significantly increased RPUs by
~3x on average
CHR Provides More “Shots on Goal”
• Huge opportunity
• Focused on EMEA
• Addressing decentralized HR landscape
Initially Targeting International Markets
154
155
VIDEO
Chirag Shah
SVP & GM, Emerging Markets
Growth Market Opportunity
Our SMB Opportunity
158
A Sizeable Market… 400M
SEATS
100M
SEATS
SMB MARKET*
GLOBAL
ADDRESSABLE MARKET
*Represents organizations with between 20 and 500 employees globally
159
…that Could Be Our Largest Segment In Dollars
SMB unit economics are 4-5x Enterprise, and 2-3x Mid-Market
Enterprise Mid-Market SMB
160
Established A Unified, Focused Team in 2017
We moved to a divisional structure to create a more unified,
focused approach to addressing the SMB market
GM SMB
OperationsSMB MarketingSMB SalesSMB Product &
Development
*HIGHLIGHTED boxes represent new roles/functions added in 2017
161
Took Time To Understand Our Market
We engaged an external research firm to help us better understand
the makeup of the SMB market
Talent Laggards Minimalists
31%
Savvy HR Pro
27%
Talent Champions
26%16%
Addressable MarketNo Interest
LOW MEDIUM HIGH
Savviness & Feature Requirements
750+
SMBs
Interviewed
162
Shifted to a Multi-Product Strategy
To enable us to effectively address the entirety of the SMB market,
we shifted our go-to-market to a multi-product strategy
Savvy HR Pro
27M Seats
Talent Champions
26M Seats
Simple Robust
Minimalists
31M Seats
163
Implemented a Segment-Specific
Marketing Approach
We have better aligned what we market and the way in which we
market it by taking a segment-specific approach
165
Simplified Conversations with Pricing Consistency
Pricing consistency between both PiiQ and Cornerstone solutions simplifies
conversation for prospects considering both products
EXAMPLE
Learning & Performance: 150 users
Annual Software Price $13,500 $17,500
Upfront Services Price — —
Total Annual Price $13,500 $17,500
Monthly User Price $7.50 $9.72
166
The Result: Dramatic Year-Over-Year Sales Growth
3%
234%
0%
50%
100%
150%
200%
250%
1H '17 2H '17
After implementing many of the changes described earlier, SMB
demonstrated strong second half growth (with fewer reps than in ‘16)
Key Changes Implemented
167
Year-Over-Year Rep Productivity Improvement
In the second half of 2017, the average SMB rep was generating 4.3x as
much in new sales as they were in the second half of 2016
1.8x
4.3x
0.0x
1.0x
2.0x
3.0x
4.0x
5.0x
1H '17 2H '17
Key Changes Implemented
168
Significant Increase in SMB Deal Volume
In Q4 of 2017, the volume of SMB deals was significantly higher than
any other quarter in Cornerstone’s history
0
20
40
60
80
100
120
140
160
180
200
Q1:14 Q2:14 Q3:14 Q4:14 Q1:15 Q2:15 Q3:15 Q4:15 Q1:16 Q2:16 Q3:16 Q4:16 Q1:17 Q2:17 Q3:17 Q4:17
Key Changes Implemented
Historical SMB Deal Volume
Our APJ Opportunity
170
A Strong Foundation
Current APJ Footprint
Clients
170+
Users
3M+
Employees
85 7
Countries
8
Offices
171
But Significant Untapped Potential Remains
After ten weeks assessing the APJ region, many of my observations
are analogous to what I initially saw with SMB
1
Need an increased level of
local expertise
Sales and marketing must be
more country-specific
Pricing strategy must better
optimize conversion
2
3
172
It’s Time to Focus
We are creating a focused, country-specific GTM approach across the
region, with deeper levels of investment in fewer major markets
Large-Investment,
Anchor Markets
Secondary Markets
Australia &
New Zealand
Japan Hong Kong South KoreaSingapore
(ASEAN)
173
APJ Expected To Be Key Growth Driver
After making some of the changes discussed on previous slides, we
expect APJ to be the catalyst to take Cornerstone’s international
mix to 40%+ in the years to come
35%
40%+
30%
33%
36%
39%
42%
2017A 2018E 2019E 2020E
International Revenue Mix
174
Cornerstone 2.0 - Services Partner Panel
Bill Forsyth
Chief Sales
& Solutions Officer
174
Colin Brennan
Executive Vice President
Cloud Deployment
Tiffany Appleby
Vice President Alliances,
North America
Jason Magill
Senior Manager
Human Capital
Brian Swartz
CFO
Financial Review
1. A look back: historical financial performance
2. Transformation: top line
3. Transformation: bottom line
4. ASC 606 and 2018 outlook
5. 2020 Framework
Topics to cover
176
A Look Back
168
280
481
806
1,237
1,631
2,153
2,595
2,918
3,250
2008 2009 2010 2011 2012 2013 2014 2015 2016 2017
2.1
3.3
4.9
7.5
10.6
14.1
18.1
23.8
29.9
35.3
2008 2009 2010 2011 2012 2013 2014 2015 2016 2017
Clients Users
(in millions)
178
A Decade of Strong Client & User Growth
$154
$232
$316
$400
$453
$526
2012 2013 2014 2015 2016 2017
$118
$185
$264
$340
$423
$482
2012 2013 2014 2015 2016 2017
179
Continued Top Line Growth
Billings
(in millions)
Revenue
(in millions)
57% 42% 29% 25% 14%Revenue Growth YOY:
180
Best Q3 in CSOD History
Q3 Total New Sales Year-over-Year
2010 2011 2012 2013 2014 2015 2016 2017
New Sales Linear (New Sales)
Note: charts are illustrative and not drawn to scale.
181
Second Best Q4 in CSOD History
Q4 Total New Sales Year-over-Year
2010 2011 2012 2013 2014 2015 2016 2017
New Sales Linear (New Sales)
Note: charts are illustrative and not drawn to scale.
182
In the Past, We Focused Only on Total Sales
Total New Sales by Year
Note: charts are illustrative and not drawn to scale.
2012 2013 2014 2015 2016 2017
New ARR One-Time FX
183
…But Our Sales Mix Shifted Negatively
New Sales Composition
2011 2013 2015 2017
Recurring ServicesNew ARR One-Time
15pts lower
than in 2011
Note: charts are illustrative and not drawn to scale.
How Selling Services Impacted Our ARR
184
2014 Ending ARR
Less: Churn
Plus: New ARR
2015 2016 2017 2018E
$439
$475-495*
(8-13%)
2015 Ending ARR
2016 Ending ARR
2017 Ending ARR
Less: Churn
Less: Churn
Less: Churn
Plus: New ARR
Plus: New ARR
Plus: New ARR
(in millions)
ARR
New
Sales
Excluded:
One-Time
Excluded:
One-Time
Excluded:
One-Time
*2018E ARR reflects the guidance range provided on earnings call on 2/13/18.
Note: charts are illustrative and not draw to scale.
RECURRING
RECURRING
RECURRING
ARR’s Impact on Total Revenue
185
2015 2016 2017
SERVICES
$340
+29%
SERVICES
$423
+25%
SERVICES
$482
+14%
(in millions)
Total Revenue
Private & Confidential
As ARR growth slowed, so did our recurring and total
revenue growth…..
RECURRING
RECURRING
RECURRING
SERVICES
SERVICES
ARR’s Impact on Total Revenue
186
2015 2016 2017
SERVICES
$430
+29%
$514
+20%
Source: Cornerstone estimates
Maintaining historical recurring rates would have resulted in
higher growth of 400bps in 2016 and 600bps in 2017
(in millions)
Total Revenue
+$7M
(29% vs. 25%)
+$32M
(20% vs. 14%)
Private & Confidential
Transformation: Top Line
How the Services Transformation Affects Billings
2015 2016 2017 2018
Recurring Billings Services Billings
188
Starting ARR Currency ARR Churn New ARR from
Existing Customers
New ARR from New
Customers
Ending ARR
How ARR Moves
Note: Bar sizes are representative only and should not be used to estimate actual values. 189
Illustrative Year-over-Year Bridge
190
How ARR Impacts Recurring Revenue
$1M Deal
ARR = $1M
Rev = $1M
ARR = $1M
Rev = $0.5M
ARR = $1M
Rev = $5K
Jan 1 July 1 Dec 30
EXAMPLE
Date Signed Date Signed Date Signed
Prior Year Exit
ARR
Revenue Lost
From Churn
Revenue from
New ARR
Currency Fair Value
Adjustment
606 Adjustment Recurring
Revenue
Illustrative Bridge from 2017 ARR to
2018 Recurring Revenue
Note: Bar sizes are representative only and should not be used to estimate actual values. 191
Transformation: Bottom Line
-13%
-5%
-4% -4%
2%
6%
10% - 12%
2012 2013 2014 2015 2016 2017 2018E
193
Improving Operating Leverage
Non-GAAP Operating Margin
$52M - $62M
Note: 2018 represents operating income and margin under ASC 606. Under ASC 605, operating income is $55-65M and margin is 11-13%.
Sales & Marketing Spend – Trailing Our Peers
2017 S&M Spend as % of Revenue
194
Sales & Marketing Spend Now
2018 S&M Spend as % of Revenue
195
A Clear Path to Operating Margin Expansion
Cost-cuts already made will drive operating margin expansion
2017 Adjustments 2018E
Revenue $482M $497 - $507M
2017 Expenses $455M
- Expense cuts announced 12/2017 -$25M
+ Incremental Expenses $15M
= 2018 Expenses $445M
Operating Profit $27M $52 - $62M
Operating Margin 6% 10 -12%
Note: 2018 represents operating income and margin under ASC 606. Under ASC 605, operating income is $55-65M and margin is 11-13%. 196
3%
2%
6% 5%
4%
9%
10% - 12%
2012 2013 2014 2015 2016 2017 2018E
197
Improving Operating Leverage
$50M - $60M
Unlevered Free Cash Flow
198
Normalized uFCF
2018 uFCF
Guidance
Midpoint
New Datacenters Restructuring Services Exit
Working Capital
Impact
"Normalized" 2018
uFCF
~15%
Margin
10-12%
Margin
~ 1%
~ 0.5%
~ 3%
Operating Cash Flow
-
Capitalized Software
-
Capex
+
Cash Interest
=
UNLEVERED FREE
CASH FLOW
606 and 2018 Outlook
200
1. Billings
2. Revenue
3. Operating Profit
4. Free Cash Flow
How Best to Measure Our Progress
During Our Transition…
Our historical key financial
measures have been:
Going forward we believe
the key metrics will be:
1. ARR
2. Subscription Revenue
3. Operating Profit
4. Unlevered Free Cash Flow
201
2017 – 2018 Revenue Transition
Expected revenue impact of sun-setting services
$397
$453 - $463
$85
$43
$0
$100
$200
$300
$400
$500
$600
2017 2018E
Subscription Revenue Services
Total Revenue
Note: 2018 assumes ASC 606.
(in millions)
202
Understanding ASC 606
• Modified Retrospective Adoption
• 2018 financial statements and guidance reported under 606 to reflect adoption of
new accounting standard
• Financial statements footnotes will include 2018 results reported under 605
• New disclosure in first quarter 10-Q will provide total backlog
• One-Time Financial Impacts from Adopting ASC 606 (On Jan. 1, 2018)
• Reduction of $7M in deferred revenue with an increase to shareholder equity
• Increase of $16M in deferred commissions with an increase to shareholder equity
*Update from previous guidance of $29M in deferred commissions
• 2018 Financial Impacts
• ~$3M total revenue headwind
• Slight increase to commission expense
• ~$3M operating profit headwind
• No impact to cash flow
• Expect Commission accounting to improve margins by 2pts over the next several years
2017 Actual
(605)
2018 Guidance
(605)
2018 Guidance
(606)
Annual Recurring
Revenue*
$439M $475 - $495M
(8-13% growth)
$475 - $495M
(8-13% growth)
Total Revenue $482M $500 - $510M
(4-6% growth)
$497 - $507M
(3-5% growth)
Subscription Revenue $397M $458 - $468M
(15-18% growth)
$453 - $463
(14-17% growth)
Professional Consulting
Services Revenue
$85M Down ~50% Down ~50%
Operating Profit* $27M
(6% margin)
$55 - $65M
(11-13% margin)
$52 - $62M
(10-12% margin)
Unlevered Free Cash
Flow*
$44M
(9% margin)
$50 - $60M
(10-12% margin)
$50 - $60M
(10-12% margin)
2018 Guidance (605 and 606)
*Denotes a non-GAAP metric.
** Net Interest Expense is Gross Interest Expense less Interest Income
Note: Reflects guidance issued as of February 13th, 2018. Please refer to the earnings press release for Q1 2018 guidance.
203
OTHER:
1. Total S&M dollars down YOY
2. Net Interest Expense**:
1. GAAP $25M
2. Non-GAAP $16M
3. Cash Interest Paid $14M
4. Shares outstanding to
increase from 58M to 63M
when EPS is positive.
5. Operating margin and uFCF
margin percentages could
vary depending on the
pace of services roll-off
6. Income tax expense slightly
above $2M
7. Capex 3-4% of revenue
Q1 2017 Actual
(605)
Q1 2018 Guidance
(605)
Q1 2018 Guidance
(606)
Total Revenue $112M $126 - $128M
(13-15%)
$126 - $128M
(13-15%)
Subscription Revenue $93M $112 - $114M
(21-23%)
$111 - $113M
(19-22%)
Professional Consulting
Services Revenue
$19M Down ~20% Down ~20%
Operating Margin* 4.4%
Slight
Improvement YOY
Slight
Improvement YOY
Unlevered
Free Cash Flow Margin*
($14M)
Slight
Improvement YOY
Slight
Improvement YOY
Q1 2018 Guidance (605 and 606)
204
OTHER:
1. Gross margin expected to
be down YOY in Q1, but to
significantly improve on a
sequential basis in Q2-Q4
2018
2. Net Interest Expense**:
1. GAAP $8M
2. Non-GAAP $5M
3. Cash Interest Paid $3M
*Denotes a non-GAAP metric.
** Net Interest Expense is Gross Interest Expense less Interest Income
Note: Reflects guidance issued as of February 13th, 2018. Please refer to the earnings press release for Q1 2018 guidance.
2020 Framework
206
FY17
Actual
FY18 Guidance Low Growth
Moderate
Growth
High Growth
SUBSCRIPTION REVENUE
GROWTH
16.8% 14-17% < 10% 10 - 20% 20 - 30%
NON-GAAP OPERATING
MARGIN
5.6% 10-12% 30%+ 18 - 28% 12 - 22%
UNLEVERED FREE CASH
FLOW MARGIN
9.1% 10-12% 30%+ 20 - 30% 15 - 25%
2020 Growth/Profitability Framework
2020 Framework
Note: 2018 assume ASC 606.
207Note: 2020 uFCF target assumes we have no cash taxes and assumes the convertible note is converted into equity.
2020 “Moderate Growth” Target
in uFCF
~$150M
per share
~$2.00
2020 Growth/Profitability Framework
Adam Miller
Founder & CEO
Summary
1. Exited the enterprise delivery business
2. Reduced Sales & Marketing spend
3. Accelerated margin improvement initiatives
209
Got fit
210
Growing
1. Attaching Content to Learning deals
2. Layering on recurring services
3. Penetrating the installed base
211
and Growing
212
Dominate the Learning Market
Definitive market leader in
Learning Management
Only holistic
“learning platform”
in the market
Embedded content &
machine learning
(Learning Management +
Learning Experience)
213
Re-establish Our Leadership
in Talent Management
Deepest functionality
in the market
Extreme focus on
the experience
Holistically integrated
across the talent suite
214
Emerge as a Global
Human Capital Management Player
Only real alternative
to “rip & replace”
Employee-driven
experience
Transformation without
the cost
Human Capital Management
215
Questions?
Thank You

More Related Content

What's hot

Introducing the Professional Service Maturity Model
Introducing the Professional Service Maturity ModelIntroducing the Professional Service Maturity Model
Introducing the Professional Service Maturity Model
Jeanne Urich
 
A Brief Introduction to The Strategic Offsites Group
A Brief Introduction to The Strategic Offsites GroupA Brief Introduction to The Strategic Offsites Group
A Brief Introduction to The Strategic Offsites Group
Bob Frisch
 
PEI October - Interview with Jim Corey
PEI October -  Interview with Jim CoreyPEI October -  Interview with Jim Corey
PEI October - Interview with Jim CoreyCorey Torrence
 
CEO_PE_Sponsored_Companies
CEO_PE_Sponsored_CompaniesCEO_PE_Sponsored_Companies
CEO_PE_Sponsored_CompaniesKeith Giarman
 
Insights pe family_offices-part1
Insights pe family_offices-part1Insights pe family_offices-part1
Insights pe family_offices-part1
John A. Bova
 
Why Tax Reform Changes Nothing -- and Everything
Why Tax Reform Changes Nothing -- and EverythingWhy Tax Reform Changes Nothing -- and Everything
Why Tax Reform Changes Nothing -- and Everything
Strategy&, a member of the PwC network
 
62 Carmen Nastase Business Plan
62 Carmen Nastase   Business Plan62 Carmen Nastase   Business Plan
62 Carmen Nastase Business Planmanpreet04
 
463PE_EU_EBOOK_ONLINE_v1_8_1
463PE_EU_EBOOK_ONLINE_v1_8_1463PE_EU_EBOOK_ONLINE_v1_8_1
463PE_EU_EBOOK_ONLINE_v1_8_1Sotiris Gassialis
 
ProCFO White Paper
ProCFO White PaperProCFO White Paper
ProCFO White PaperJim Jans
 
How to shape the Procurement Workforce of the Future
How to shape the Procurement Workforce of the FutureHow to shape the Procurement Workforce of the Future
How to shape the Procurement Workforce of the Future
Ferhat Uensal
 
Marketing Strategy Templates
Marketing Strategy TemplatesMarketing Strategy Templates
Marketing Strategy Templates
Recrue
 
how_british_american_tobacco_294357
how_british_american_tobacco_294357how_british_american_tobacco_294357
how_british_american_tobacco_294357Jorge Escobar
 
Top 100 most powerful brands 2015
Top 100 most powerful brands 2015Top 100 most powerful brands 2015
Top 100 most powerful brands 2015
Sumit Roy
 
Strategy Management
Strategy ManagementStrategy Management
Strategy Management
Andrew Pearson
 
Lori Simpson CV 2016.3
Lori Simpson CV 2016.3Lori Simpson CV 2016.3
Lori Simpson CV 2016.3Lori Simpson
 
Not Raising Capital Fast Enough?
Not Raising Capital Fast Enough?Not Raising Capital Fast Enough?
Not Raising Capital Fast Enough?
Tyra Jeffries
 
Guest Speaker at CFO of the Future, Institute of Chartered Accountants
Guest Speaker at CFO of the Future,  Institute of Chartered AccountantsGuest Speaker at CFO of the Future,  Institute of Chartered Accountants
Guest Speaker at CFO of the Future, Institute of Chartered AccountantsSusan O'Neill
 
Ir deck 4 q16 final
Ir deck 4 q16 finalIr deck 4 q16 final
Ir deck 4 q16 final
IR_HubSpot
 
Global trend reports core finance h1 2014
Global trend reports core finance  h1 2014Global trend reports core finance  h1 2014
Global trend reports core finance h1 2014Ying wei (Joe) Chou
 

What's hot (20)

Introducing the Professional Service Maturity Model
Introducing the Professional Service Maturity ModelIntroducing the Professional Service Maturity Model
Introducing the Professional Service Maturity Model
 
A Brief Introduction to The Strategic Offsites Group
A Brief Introduction to The Strategic Offsites GroupA Brief Introduction to The Strategic Offsites Group
A Brief Introduction to The Strategic Offsites Group
 
PEI October - Interview with Jim Corey
PEI October -  Interview with Jim CoreyPEI October -  Interview with Jim Corey
PEI October - Interview with Jim Corey
 
CEO_PE_Sponsored_Companies
CEO_PE_Sponsored_CompaniesCEO_PE_Sponsored_Companies
CEO_PE_Sponsored_Companies
 
Insights pe family_offices-part1
Insights pe family_offices-part1Insights pe family_offices-part1
Insights pe family_offices-part1
 
Why Tax Reform Changes Nothing -- and Everything
Why Tax Reform Changes Nothing -- and EverythingWhy Tax Reform Changes Nothing -- and Everything
Why Tax Reform Changes Nothing -- and Everything
 
62 Carmen Nastase Business Plan
62 Carmen Nastase   Business Plan62 Carmen Nastase   Business Plan
62 Carmen Nastase Business Plan
 
463PE_EU_EBOOK_ONLINE_v1_8_1
463PE_EU_EBOOK_ONLINE_v1_8_1463PE_EU_EBOOK_ONLINE_v1_8_1
463PE_EU_EBOOK_ONLINE_v1_8_1
 
ProCFO White Paper
ProCFO White PaperProCFO White Paper
ProCFO White Paper
 
How to shape the Procurement Workforce of the Future
How to shape the Procurement Workforce of the FutureHow to shape the Procurement Workforce of the Future
How to shape the Procurement Workforce of the Future
 
Marketing Strategy Templates
Marketing Strategy TemplatesMarketing Strategy Templates
Marketing Strategy Templates
 
how_british_american_tobacco_294357
how_british_american_tobacco_294357how_british_american_tobacco_294357
how_british_american_tobacco_294357
 
Top 100 most powerful brands 2015
Top 100 most powerful brands 2015Top 100 most powerful brands 2015
Top 100 most powerful brands 2015
 
Strategy Management
Strategy ManagementStrategy Management
Strategy Management
 
Lori Simpson CV 2016.3
Lori Simpson CV 2016.3Lori Simpson CV 2016.3
Lori Simpson CV 2016.3
 
CFO_of_the_Future
CFO_of_the_FutureCFO_of_the_Future
CFO_of_the_Future
 
Not Raising Capital Fast Enough?
Not Raising Capital Fast Enough?Not Raising Capital Fast Enough?
Not Raising Capital Fast Enough?
 
Guest Speaker at CFO of the Future, Institute of Chartered Accountants
Guest Speaker at CFO of the Future,  Institute of Chartered AccountantsGuest Speaker at CFO of the Future,  Institute of Chartered Accountants
Guest Speaker at CFO of the Future, Institute of Chartered Accountants
 
Ir deck 4 q16 final
Ir deck 4 q16 finalIr deck 4 q16 final
Ir deck 4 q16 final
 
Global trend reports core finance h1 2014
Global trend reports core finance  h1 2014Global trend reports core finance  h1 2014
Global trend reports core finance h1 2014
 

Similar to Analyst day-deck-final

Csod investor deck q4 2018 (final) flint
Csod investor deck   q4 2018 (final) flintCsod investor deck   q4 2018 (final) flint
Csod investor deck q4 2018 (final) flint
ircornerstone
 
Csod investor deck third quarter1052015
Csod investor deck third quarter1052015Csod investor deck third quarter1052015
Csod investor deck third quarter1052015
ircornerstone
 
Account planning.pptx
Account planning.pptxAccount planning.pptx
Account planning.pptx
Salesforce Partners
 
Final-Investor-Deck.pdf
Final-Investor-Deck.pdfFinal-Investor-Deck.pdf
Final-Investor-Deck.pdf
EMTEBR
 
Featured Presentation
Featured PresentationFeatured Presentation
Featured Presentation
ircornerstone
 
Featured Presentation
Featured PresentationFeatured Presentation
Featured Presentation
ircornerstone
 
Csod investor deck second quarter final
Csod investor deck second quarter finalCsod investor deck second quarter final
Csod investor deck second quarter final
ircornerstone
 
Beyond the pipeline report producing successful sellers
Beyond the pipeline report  producing successful sellersBeyond the pipeline report  producing successful sellers
Beyond the pipeline report producing successful sellers
Summa
 
Successful Digital Transformation starts with a well defined Strategy
Successful Digital Transformation starts with a well defined StrategySuccessful Digital Transformation starts with a well defined Strategy
Successful Digital Transformation starts with a well defined Strategy
Glen Alleman
 
Investor day 2018 final (web)
Investor day 2018   final (web)Investor day 2018   final (web)
Investor day 2018 final (web)
Instructure
 
Inst investor deck nov 2017
Inst investor deck   nov 2017Inst investor deck   nov 2017
Inst investor deck nov 2017
Instructure
 
Thoughtworks Q1 2022 Investor Presentation.pdf
Thoughtworks Q1 2022 Investor Presentation.pdfThoughtworks Q1 2022 Investor Presentation.pdf
Thoughtworks Q1 2022 Investor Presentation.pdf
Kuan-Tsae Huang
 
Ye 2016 preliminary update final posted to site_updated_2.8.17
Ye 2016 preliminary update final posted to site_updated_2.8.17Ye 2016 preliminary update final posted to site_updated_2.8.17
Ye 2016 preliminary update final posted to site_updated_2.8.17
Mcgrawir
 
Business plans
Business plansBusiness plans
Business plans
Himansu S Mahapatra
 
CSOD Investor Deck
CSOD Investor DeckCSOD Investor Deck
CSOD Investor Deck
ircornerstone
 
Instructure investor deck - nov 2017
Instructure investor deck - nov 2017Instructure investor deck - nov 2017
Instructure investor deck - nov 2017
Instructure
 
Atento Q4FY14 Bondholders Presentation
Atento Q4FY14 Bondholders PresentationAtento Q4FY14 Bondholders Presentation
Atento Q4FY14 Bondholders Presentation
investorsatento
 
Featured Presentation
Featured PresentationFeatured Presentation
Featured Presentation
ircornerstone
 
Csod investor deck first quarter 2015 final
Csod investor deck first quarter 2015   finalCsod investor deck first quarter 2015   final
Csod investor deck first quarter 2015 final
ircornerstone
 
Csod investor deck first quarter fina lv3
Csod investor deck first quarter fina lv3Csod investor deck first quarter fina lv3
Csod investor deck first quarter fina lv3
ircornerstone
 

Similar to Analyst day-deck-final (20)

Csod investor deck q4 2018 (final) flint
Csod investor deck   q4 2018 (final) flintCsod investor deck   q4 2018 (final) flint
Csod investor deck q4 2018 (final) flint
 
Csod investor deck third quarter1052015
Csod investor deck third quarter1052015Csod investor deck third quarter1052015
Csod investor deck third quarter1052015
 
Account planning.pptx
Account planning.pptxAccount planning.pptx
Account planning.pptx
 
Final-Investor-Deck.pdf
Final-Investor-Deck.pdfFinal-Investor-Deck.pdf
Final-Investor-Deck.pdf
 
Featured Presentation
Featured PresentationFeatured Presentation
Featured Presentation
 
Featured Presentation
Featured PresentationFeatured Presentation
Featured Presentation
 
Csod investor deck second quarter final
Csod investor deck second quarter finalCsod investor deck second quarter final
Csod investor deck second quarter final
 
Beyond the pipeline report producing successful sellers
Beyond the pipeline report  producing successful sellersBeyond the pipeline report  producing successful sellers
Beyond the pipeline report producing successful sellers
 
Successful Digital Transformation starts with a well defined Strategy
Successful Digital Transformation starts with a well defined StrategySuccessful Digital Transformation starts with a well defined Strategy
Successful Digital Transformation starts with a well defined Strategy
 
Investor day 2018 final (web)
Investor day 2018   final (web)Investor day 2018   final (web)
Investor day 2018 final (web)
 
Inst investor deck nov 2017
Inst investor deck   nov 2017Inst investor deck   nov 2017
Inst investor deck nov 2017
 
Thoughtworks Q1 2022 Investor Presentation.pdf
Thoughtworks Q1 2022 Investor Presentation.pdfThoughtworks Q1 2022 Investor Presentation.pdf
Thoughtworks Q1 2022 Investor Presentation.pdf
 
Ye 2016 preliminary update final posted to site_updated_2.8.17
Ye 2016 preliminary update final posted to site_updated_2.8.17Ye 2016 preliminary update final posted to site_updated_2.8.17
Ye 2016 preliminary update final posted to site_updated_2.8.17
 
Business plans
Business plansBusiness plans
Business plans
 
CSOD Investor Deck
CSOD Investor DeckCSOD Investor Deck
CSOD Investor Deck
 
Instructure investor deck - nov 2017
Instructure investor deck - nov 2017Instructure investor deck - nov 2017
Instructure investor deck - nov 2017
 
Atento Q4FY14 Bondholders Presentation
Atento Q4FY14 Bondholders PresentationAtento Q4FY14 Bondholders Presentation
Atento Q4FY14 Bondholders Presentation
 
Featured Presentation
Featured PresentationFeatured Presentation
Featured Presentation
 
Csod investor deck first quarter 2015 final
Csod investor deck first quarter 2015   finalCsod investor deck first quarter 2015   final
Csod investor deck first quarter 2015 final
 
Csod investor deck first quarter fina lv3
Csod investor deck first quarter fina lv3Csod investor deck first quarter fina lv3
Csod investor deck first quarter fina lv3
 

More from ircornerstone

Q3 2018 Investor Deck
Q3 2018 Investor DeckQ3 2018 Investor Deck
Q3 2018 Investor Deck
ircornerstone
 
Cornerstone q2 presentation
Cornerstone q2 presentationCornerstone q2 presentation
Cornerstone q2 presentation
ircornerstone
 
Csod investor deck q1 2018 final
Csod investor deck   q1 2018 finalCsod investor deck   q1 2018 final
Csod investor deck q1 2018 final
ircornerstone
 
Cornerstone pdf
Cornerstone pdfCornerstone pdf
Cornerstone pdf
ircornerstone
 
Cornerstoneq42017
Cornerstoneq42017Cornerstoneq42017
Cornerstoneq42017
ircornerstone
 
Csod investor deck fourth quarter
Csod investor deck fourth quarterCsod investor deck fourth quarter
Csod investor deck fourth quarter
ircornerstone
 
Csod investor deck second quarter
Csod investor deck second quarterCsod investor deck second quarter
Csod investor deck second quarter
ircornerstone
 
Csod investor-deck-second-quarter
Csod investor-deck-second-quarterCsod investor-deck-second-quarter
Csod investor-deck-second-quarter
ircornerstone
 
Csod investor-deck-first-quarter v8
Csod investor-deck-first-quarter v8Csod investor-deck-first-quarter v8
Csod investor-deck-first-quarter v8
ircornerstone
 
Csod investor deck first quarter v6
Csod investor deck first quarter   v6Csod investor deck first quarter   v6
Csod investor deck first quarter v6
ircornerstone
 
Csod investor deck first quarter v5
Csod investor deck first quarter   v5Csod investor deck first quarter   v5
Csod investor deck first quarter v5
ircornerstone
 
CSOD Investor Deck Q4 2016
CSOD Investor Deck Q4 2016CSOD Investor Deck Q4 2016
CSOD Investor Deck Q4 2016
ircornerstone
 
Csod investor deck third quarter fina lv5-fixed
Csod investor deck third quarter   fina lv5-fixedCsod investor deck third quarter   fina lv5-fixed
Csod investor deck third quarter fina lv5-fixed
ircornerstone
 
Csod investor deck third quarter fina lv2
Csod investor deck third quarter   fina lv2Csod investor deck third quarter   fina lv2
Csod investor deck third quarter fina lv2
ircornerstone
 
Csod investor deck third quarter
Csod investor deck third quarterCsod investor deck third quarter
Csod investor deck third quarter
ircornerstone
 
Csod investor deck second quarter final
Csod investor deck second quarter finalCsod investor deck second quarter final
Csod investor deck second quarter final
ircornerstone
 
Csod investor deck first quarter fina lv2
Csod investor deck first quarter fina lv2Csod investor deck first quarter fina lv2
Csod investor deck first quarter fina lv2
ircornerstone
 
Csod investor deck first quarter
Csod investor deck first quarterCsod investor deck first quarter
Csod investor deck first quarter
ircornerstone
 
Csod investor deck q1 2016
Csod investor deck q1 2016Csod investor deck q1 2016
Csod investor deck q1 2016
ircornerstone
 
Csod investor deck first quarterv19
Csod investor deck first quarterv19Csod investor deck first quarterv19
Csod investor deck first quarterv19
ircornerstone
 

More from ircornerstone (20)

Q3 2018 Investor Deck
Q3 2018 Investor DeckQ3 2018 Investor Deck
Q3 2018 Investor Deck
 
Cornerstone q2 presentation
Cornerstone q2 presentationCornerstone q2 presentation
Cornerstone q2 presentation
 
Csod investor deck q1 2018 final
Csod investor deck   q1 2018 finalCsod investor deck   q1 2018 final
Csod investor deck q1 2018 final
 
Cornerstone pdf
Cornerstone pdfCornerstone pdf
Cornerstone pdf
 
Cornerstoneq42017
Cornerstoneq42017Cornerstoneq42017
Cornerstoneq42017
 
Csod investor deck fourth quarter
Csod investor deck fourth quarterCsod investor deck fourth quarter
Csod investor deck fourth quarter
 
Csod investor deck second quarter
Csod investor deck second quarterCsod investor deck second quarter
Csod investor deck second quarter
 
Csod investor-deck-second-quarter
Csod investor-deck-second-quarterCsod investor-deck-second-quarter
Csod investor-deck-second-quarter
 
Csod investor-deck-first-quarter v8
Csod investor-deck-first-quarter v8Csod investor-deck-first-quarter v8
Csod investor-deck-first-quarter v8
 
Csod investor deck first quarter v6
Csod investor deck first quarter   v6Csod investor deck first quarter   v6
Csod investor deck first quarter v6
 
Csod investor deck first quarter v5
Csod investor deck first quarter   v5Csod investor deck first quarter   v5
Csod investor deck first quarter v5
 
CSOD Investor Deck Q4 2016
CSOD Investor Deck Q4 2016CSOD Investor Deck Q4 2016
CSOD Investor Deck Q4 2016
 
Csod investor deck third quarter fina lv5-fixed
Csod investor deck third quarter   fina lv5-fixedCsod investor deck third quarter   fina lv5-fixed
Csod investor deck third quarter fina lv5-fixed
 
Csod investor deck third quarter fina lv2
Csod investor deck third quarter   fina lv2Csod investor deck third quarter   fina lv2
Csod investor deck third quarter fina lv2
 
Csod investor deck third quarter
Csod investor deck third quarterCsod investor deck third quarter
Csod investor deck third quarter
 
Csod investor deck second quarter final
Csod investor deck second quarter finalCsod investor deck second quarter final
Csod investor deck second quarter final
 
Csod investor deck first quarter fina lv2
Csod investor deck first quarter fina lv2Csod investor deck first quarter fina lv2
Csod investor deck first quarter fina lv2
 
Csod investor deck first quarter
Csod investor deck first quarterCsod investor deck first quarter
Csod investor deck first quarter
 
Csod investor deck q1 2016
Csod investor deck q1 2016Csod investor deck q1 2016
Csod investor deck q1 2016
 
Csod investor deck first quarterv19
Csod investor deck first quarterv19Csod investor deck first quarterv19
Csod investor deck first quarterv19
 

Recently uploaded

Corporate Presentation Probe June 2024.pdf
Corporate Presentation Probe June 2024.pdfCorporate Presentation Probe June 2024.pdf
Corporate Presentation Probe June 2024.pdf
Probe Gold
 
Collective Mining | Corporate Presentation - May 2024
Collective Mining | Corporate Presentation - May 2024Collective Mining | Corporate Presentation - May 2024
Collective Mining | Corporate Presentation - May 2024
CollectiveMining1
 
New Tax Regime User Guide Flexi Plan Revised (1).pptx
New Tax Regime User Guide Flexi Plan Revised (1).pptxNew Tax Regime User Guide Flexi Plan Revised (1).pptx
New Tax Regime User Guide Flexi Plan Revised (1).pptx
RajkumarRajamanikam
 
Osisko Development - Investor Presentation - June 24
Osisko Development - Investor Presentation - June 24Osisko Development - Investor Presentation - June 24
Osisko Development - Investor Presentation - June 24
Philip Rabenok
 
Snam 2023-27 Industrial Plan - Financial Presentation
Snam 2023-27 Industrial Plan - Financial PresentationSnam 2023-27 Industrial Plan - Financial Presentation
Snam 2023-27 Industrial Plan - Financial Presentation
Valentina Ottini
 
Investor Day 2024 Presentation Sysco 2024
Investor Day 2024 Presentation Sysco 2024Investor Day 2024 Presentation Sysco 2024
Investor Day 2024 Presentation Sysco 2024
Sysco_Investors
 
cyberagent_For New Investors_EN_240424.pdf
cyberagent_For New Investors_EN_240424.pdfcyberagent_For New Investors_EN_240424.pdf
cyberagent_For New Investors_EN_240424.pdf
CyberAgent, Inc.
 
Collective Mining | Corporate Presentation - May 2024
Collective Mining | Corporate Presentation - May 2024Collective Mining | Corporate Presentation - May 2024
Collective Mining | Corporate Presentation - May 2024
CollectiveMining1
 

Recently uploaded (8)

Corporate Presentation Probe June 2024.pdf
Corporate Presentation Probe June 2024.pdfCorporate Presentation Probe June 2024.pdf
Corporate Presentation Probe June 2024.pdf
 
Collective Mining | Corporate Presentation - May 2024
Collective Mining | Corporate Presentation - May 2024Collective Mining | Corporate Presentation - May 2024
Collective Mining | Corporate Presentation - May 2024
 
New Tax Regime User Guide Flexi Plan Revised (1).pptx
New Tax Regime User Guide Flexi Plan Revised (1).pptxNew Tax Regime User Guide Flexi Plan Revised (1).pptx
New Tax Regime User Guide Flexi Plan Revised (1).pptx
 
Osisko Development - Investor Presentation - June 24
Osisko Development - Investor Presentation - June 24Osisko Development - Investor Presentation - June 24
Osisko Development - Investor Presentation - June 24
 
Snam 2023-27 Industrial Plan - Financial Presentation
Snam 2023-27 Industrial Plan - Financial PresentationSnam 2023-27 Industrial Plan - Financial Presentation
Snam 2023-27 Industrial Plan - Financial Presentation
 
Investor Day 2024 Presentation Sysco 2024
Investor Day 2024 Presentation Sysco 2024Investor Day 2024 Presentation Sysco 2024
Investor Day 2024 Presentation Sysco 2024
 
cyberagent_For New Investors_EN_240424.pdf
cyberagent_For New Investors_EN_240424.pdfcyberagent_For New Investors_EN_240424.pdf
cyberagent_For New Investors_EN_240424.pdf
 
Collective Mining | Corporate Presentation - May 2024
Collective Mining | Corporate Presentation - May 2024Collective Mining | Corporate Presentation - May 2024
Collective Mining | Corporate Presentation - May 2024
 

Analyst day-deck-final

  • 1. March 13, 2018 Financial Analyst & Investor Day
  • 2. 1:00 Introduction - Alexandra Geller 1:05 Cornerstone Overview & Cornerstone 2.0 - Adam Miller 2:00 Cornerstone Opportunities: A View from the Field Global Field Operations - Jeff Lautenbach Learning & Content Opportunity - Josh Schwede Winning in the Learning & HCM Market - Josh Bersin Talent Management Opportunity - Dan Bock EMEA and the HCM Opportunity - Vincent Belliveau Growth Market Opportunities - Chirag Shah 4:00 BREAK 4:10 Services Partner Panel - Moderated by Tiffany Appleby 4:30 Financial Review - Brian Swartz 5:00 Wrap-Up and Q&A - Executive Team 5:30 Cocktails - Executive Team Agenda 2
  • 3. This presentation includes forward-looking statements. These statements relate to, among other things, our future financial and operating performance, including our GAAP and non-GAAP guidance, the growth of the learning and human capital management market, our business strategy, and our plans and objectives for future operations. In light of the risks and uncertainties outlined below, the future events and circumstances discussed in this presentation may not occur, and actual results could differ materially from those anticipated or implied in the forward-looking statements. The Company has based these forward-looking statements largely on its current expectations and projections about future events and financial trends affecting its business. Forward-looking statements should not be read as guarantees of future performance or results, and will not necessarily be accurate indications of the times at, or by, which such performance or results will be achieved. Forward-looking statements are based on information available at the date of this presentation and management’s good faith belief as of such date with respect to future events, and are subject to risks and uncertainties that could cause actual performance or results to differ materially from those expressed in or suggested by the forward-looking statements. Important factors that could cause such differences include, but are not limited to: • Statements regarding the Company’s business strategies; • The Company’s anticipated future operating results and operating expenses; • The Company’s ability to attract new clients to enter into subscriptions for its solution; • The Company’s ability to service those clients effectively and induce them to renew and upgrade their deployments of the Company’s solution; • The Company’s ability to expand its sales organization to address effectively the new industries, geographies and types of organizations the company intends to target; • The Company’s ability to accurately forecast revenue and appropriately plan its expenses; market acceptance of enhanced solutions, alternate ways of addressing learning and talent management needs or new technologies generally by the Company and its competitors; continued acceptance of SaaS as an effective method for delivering learning and talent management solutions and other business management applications; the attraction and retention of qualified employees and key personnel; • The Company’s ability to protect and defend its intellectual property; costs associated with defending intellectual property infringement and other claims; events in the markets for the Company’s solution and alternatives to the Company’s solution, as well as in the United States and global markets generally; future regulatory, judicial and legislative changes in the Company’s industry; changes in the competitive environment in the Company’s industry and the markets in which the Company operates; and other factors discussed under “Risk Factors” and “Management’s Discussion and Analysis of Financial Condition and Results of Operations” in the Company’s periodic reports filed with the Securities and Exchange Commission (the “SEC”). Forward-looking statements speak only as of the date of this presentation. You should not put undue reliance on any forward-looking statement. The Company assumes no obligation to update any forward-looking statements to reflect actual results, changes in assumptions or changes in other factors affecting future performance or results, except to the extent required by applicable laws. If the Company updates one or more forward-looking statements, no inference should be drawn that it will make additional updates with respect to those or other forward-looking statements. In addition to U.S. GAAP financials, this presentation includes certain non-GAAP financial measures. These non-GAAP financial measures are in addition to, not a substitute for or superior to, measures of financial performance prepared in accordance with U.S. GAAP. Please see the discussion of these non-GAAP financial measures and their reconciliations to the most directly comparable U.S. GAAP measures in the Company’s press release dated February 13, 2018. Safe Harbor 3
  • 4. Adam Miller Founder & CEO Cornerstone Overview
  • 7. Software is Eating the World 7
  • 8. Mechanization Water power Steam power 1 2 3 Mass production Assembly line Electricity Computer Automation Networks 4 Digital Machine learning Artificial intelligence The Next Industrial Revolution has Arrived 8
  • 9. 9 Developing new skills is essential to empowering the next revolution
  • 10. 10 How we manage talent & develop skills over the next 5 years will be completely different from the last 20
  • 11. 11 A Shift in Focus is Required Skills-based people management Relationship-centric Integrated people and work solutions Real-time data empowered decision-making Personalized leveraging machine learning Automating HR data & processes Financially motivated Application and data silos Historical, intuition-based decisions One-size-fits-all approach Transaction focused People focused to
  • 12. Talent in the Digital Age  Consumer expectations have entered the workforce  Competition for skills and experiences is intense  Jobs are being redefined or eliminated  “Career Walls” are the new career ladder 12
  • 13. The Market Need is Real 13 Kara Goldin | 11. 10. 2017 From Gap to Gen Z: Why Collaboration is More Important Than Ever Nuha Masri | 11. 7. 2017 4 Ways Technology Will Shape the Future of Work by 2020 Jeff Miller | 10. 17. 2017 Why a Culture of Learning Should be Built from the Top Down Alexandra Gibbs | 10. 27. 2017 Why Taking Care of the ‘Human-Capital’ of Your Employees is Vital Jeffrey Selingo & Kevin Simon 10. 9. 2017 The Future of Your Career Depends on Lifelong Learning
  • 14. 14 Our goal is to meet the needs of the business with ready leaders who can move into any business line when they’re needed, ready to lead. Between the T-Mobile team and our partnership with Cornerstone, we are really making that happen. “ ”Melissa Lanier, Director of Career and Leadership Development Programs
  • 15. 15 Cornerstone has allowed Hitachi to globalize HR efforts in order to achieve growth. Our plans are to increase the revenue of the non-Japanese market by 45-50% or more. “ ”Levent Arabaci, EVP & CHRO
  • 16. 16 Cornerstone has allowed us to grow from being a product-focused company to one that is seen as a leading solutions and technology provider. “ ”Alban Jacquin, Learners Experience Director
  • 17. 17 Using Cornerstone, we’ve since seen a 53% increase in [employee] movement between Hyatt brands. Employees feel like they have even more options from a career standpoint. “ ”Randy Goldberg, Vice President , Talent Management
  • 18. 18 With Cornerstone, it takes two minutes to verify someone is administratively and logistically ready to deploy. It makes a huge difference. We sent 60 volunteer responders to Nepal and only had to make one phone call. We had zero misses. “ ”Pat Ross, Deputy Director of Membership
  • 19. 19 Cornerstone helped us move from a heterogenic, localized learning approach to one that is aligned across all business units and markets. We’re seeing employees take more initiative with Cornerstone. “ ”Gerard Pieterse, Learning & Development Director
  • 21.
  • 22. 22 In the Past, We Focused Only on Total Sales Total New Sales by Year Note: charts are illustrative and not drawn to scale. 2012 2013 2014 2015 2016 2017 New ARR One-Time FX
  • 23. 23 …But Our Sales Mix Shifted Negatively New Sales Composition 2011 2013 2015 2017 Recurring ServicesNew ARR One-Time 15pts lower than in 2011 Note: charts are illustrative and not drawn to scale.
  • 24. 24
  • 25. Q1 '15 Q2 '15 Q3 '15 Q4 '15 Q1 '16 Q2 '16 Q3 '16 Q4 '16 Q1 '17 Q2 '17 Q3 '17 Q4 '17 Also Missed a Product Cycle in Learning in 2015 25 New startups begin entering corporate learning LinkedIn announces LinkedIn Learning Cornerstone announces Learning Experience Platform & Content Anytime Workday announces Learning product at Workday Rising
  • 26. 26 • Brexit • Mid-market over-investment • Spread too thin internationally Other Challenges
  • 28. 2.0
  • 29. Focus on recurring revenue and exit enterprise service delivery Improve operating margins and cash flows Create new recurring revenue streams, including aggressively enter the content market Bolster the team Improve governance Transforming Cornerstone 29 1 2 3 4 5
  • 30. 30
  • 31. 31 1. Focus on Recurring Revenue 31
  • 32. Commission Focusing on ARR 32 100% focus by the field on recurring sales Commission plans were changed in January Quota credit non-recurring salesnon-recurring sales A. B.
  • 33. Shifting Delivery to Partners 33 Enterprise Deals • Partner “papers” all services work • Cornerstone provides “delivery assurance” • Cornerstone oversees delivery success Partner Client Enterprise and Strategic Clients Mid-Market and SMB Clients • Client contracts services directly with Cornerstone • Cornerstone “papers” all services work • Services charged as recurring fees • Cornerstone owns delivery success Client Mid-Market and SMB Clients
  • 35. 35 New for Us, Not for Clients (or Partners) Everybody does this
  • 36. • Improves margins • Simplifies the business • Frees up sales rep time • Incents partners to support us The Benefits 36
  • 37. 37 2. Get fit Improve Operating Margins and Cash Flows
  • 38. Sales & Marketing Spend – Trailing Our Peers 2017 S&M Spend as % of Revenue 38
  • 39. Sales & Marketing Spend Now 2018 S&M Spend as % of Revenue 39
  • 40. Operational Excellence Drives Profitability 40 Enterprise Service Delivery Exit Self Service Support Enhanced Commission Plan Sales Headcount Optimization Annual Price Escalators Intelligent Pricing Salesforce Productivity Order to Cash Automation Strategic Sourcing Projects 1 2 3 4 5 6 7 8 9 Sales & Marketing Cost of Sales General & Administrative
  • 41. 41 3. Grow Create New Recurring Revenue Streams
  • 42. New Recurring Revenue Streams 42 Tech Services Client Success Packages Content
  • 43. Learning 43 Online classes only The Content Opportunity is Enormous 2017 Registrations 392M 2017 Completions 235M
  • 44. Cornerstone Content Anytime • Recurring subscription content model • Usage-based partner revenue sharing • Over 3,000 courses available • Fully-integrated in Cornerstone Learning • Available NOW 44
  • 45. 45 Customer Success Packages: Now Recurring Technical Support Education & Training Answer Desk Client Community System Adoption Optimization Customer Success Release Readiness
  • 46. 46 Tech Projects: Now Recurring Inbound Data Feeds Outbound Data Feeds SSO Web Services Data Warehouse Encryption • Cornerstone continues to do all tech projects • Recurring charge for tech projects, such as “Connectors” for inbound and outbound feeds • Drive further efficiencies with Cornerstone Edge
  • 48. Half of the Executive Leadership Team is New in 2018 New Additions • Hired Jeff Lautenbach as President of Global Field Operations • Hired Adrianna Burrows as Chief Marketing Officer • Hired Chris Wheaton as VP of Field Operations • Hired Jennifer Gianola as VP of Investor Relations Exits • Kirsten Helvey, COO • Dave Carter, Chief Sales Officer • Frank Ricciardi, GM of Asia Pacific • Matt Gahr, VP Sales Bolstering the Team 48
  • 50. • Added three new directors in 2017 • Planning to add two new directors in 2018; one new director in 2019 • By the end of 2018, we expect that the majority of the board will have joined in the last two years • Plan to appoint a new chairman in 2018 • June shareholder vote to declassify the board, beginning in 2019 Improving Governance 50
  • 51. 51 • Diagnosed issues • Got fit • Grow and grow To Summarize
  • 52. Jeff Lautenbach President, Global Field Operations Global Field Operations
  • 53. 53 Background Over 25 Years of Experience • Go-to-market leadership roles • Scaling and transforming global businesses • Building and executing growth strategies • Optimizing customer segmentation
  • 54. Leadership position in Learning & Talent is undeniable Initial Observations 54 Individual reps are solid sales people TAM is large, highly fragmented, and growing 2 31 54
  • 55. Magic Quadrant for Talent Management Suites Source: Gartner (February 2017) NICHE PLAYERS VISIONARIES CHALLENGERS LEADERS COMPLETENESS OF VISION ABILITYTOEXECUTE Technomedia Haufe SumTotal Halogen Software Saba Oracle (Talent Management Cloud) SAP (SuccessFactors) Talentsoft Cornerstone is the Market Leader in Talent Management 55
  • 56. 400M ADDRESSABLE SEATS Source: Cornerstone estimates, adapted from IDC, US Census Bureau 35M CSOD SEATS BY MARKET SEGMENT BY GEOGRAPHY ADDRESSABLE MARKET 150M ENTERPRISE 150M MID MARKET 100M SMB 155M NORTH AMERICA 32M LATIN AMERICA 139M EUROPE, MIDDLE EAST & AFRICA 74M ASIA PACIFIC The Market is HUGE 56
  • 57. Highly Fragmented Markets = Opportunity 57 None 17% Oracle Taleo 12% SAP SuccessFactors 10% Skillsoft 5% Kenexa 5% Other 48% Recruiting None 18% SAP SuccessFactors 12% Oracle Taleo 9% SumTotal 5%ADP 4% Other 46% Talent In each of our markets, we face a varied list of competitors. We intend to use our scale to grow market share in each segment. SAP SuccessFactors 19% None 16% Unknown 7% Saba 5% Other 41% Learning Source: Company Data.
  • 58. The Workday “Threat” Has Been Overblown 58 Cornerstone only competes with Workday in a subset of it’s total business Workday primarily competes in the United states Workday is ONLY selling talent to their ERP base
  • 59. 1. Sales focus had been on “easy wins” (i.e. services) at the expense of recurring sales which drive growth (Recruiting, Performance, Cornerstone HR) 2. Company missed a product cycle when LEPs came to market 3. Some damage was self-inflicted,especiallyin the Enterprisesegment 4. Marketing message has been weak; market does not understand breadth of Cornerstone’s capabilities 5. Sales processes are sub-optimized and need major over-haul So What is the Issue? 59
  • 60. Improve productivity Activate the base Enter the learning content market Sell recruiting suite Leverage vertical momentum 60 The Solution: Drive ARR Growth 1 2 3 4 5
  • 61. 1. Improving Productivity 61 1. Instituted more disciplined go-to-market cadence 2. Created global field ops and global enablement teams 3. Improved pricing discipline; introducing deal desk 4. Established sales and marketing interlock to ensure better alignment 5. Created new global dashboards and enhanced reporting
  • 62. 2. Activating the Base 62 Have 3+ products 70% Approximately 40% Approximately Note: Data represents purchase of an application with one of the Cornerstone product suites Have 2+ products • Introducing top account program • Leveraging deal desk and renewals team • Analyzing sales & marketing data to drive better decision-making and resource allocation • Driving U.S. to match international Recruiting sales rates
  • 63. 63 3. Entering the Learning Content Market Go Big or Go Home! Content Anytime deal sizes exceeding our highest expectation We will aggressively attach Content to Learning deals 4Q17 launched Content Anytime & Learning Experience Platform
  • 64. 64 Innovation in Driving Recruiting Success 4. Selling Recruiting – Accelerate Growth Q1 2013 Q4 2017 Applicant Tracking Onboarding Campus Recruiting Selection Candidate Experience Recruiter Experience Candidate Relationship Management Why recruiting growth now? • Established market incumbents are not innovating • Newer entrants look slick but still play in mid-market • Differentiating on product front
  • 65. 5. Capitalize on Vertical Momentum • Drive alignment, focus and urgency – SLED+FED+HC • Identify Extended Enterprise opportunities in Public Sector • Examples include Opioid Crisis, preventive care, certifications, constituent learning • Expand Federal into DOD PUBLIC SECTOR GREW NEW ARR IN 2017 BY GREATER THAN 150% YOY 65
  • 66. 66 Bonus: Execute Partner 1ST Model Drive productivity and engagement Ensure client success Ensure partner readiness Focusing marketing on more strategic initiatives Alliances Partner Opportunities Enablement Partner Marketing
  • 67. 67 Opportunities Abound When We Execute Learning Talent Management Human Capital Management Growth Markets
  • 68. Learning & Content Opportunity Josh Schwede Head of Learning Content
  • 69. 69 CEOs Must Upskill and Reskill Their Workforce CEOs expect digital tech to disrupt their company CEOs think their company is not equipped with the right skills to adapt (Deloitte 2017) 70%90%
  • 70. 70 Rising Employees Demand More Learning Say a clear career path would compel them to stay with an organization longer (Mercer 2015) 78% Say development is important in a job (Gallup 2017) 87% (Deloitte 2017) Are likely to leave because they’re not learning enough 42%
  • 71. 71 Skills have become the New Digital Currency
  • 72. How people consume video How people consume audio At the Same Time, Consumer Habits Have Changed 72
  • 73. 73 3 Blended learning 4 Social learning 5 Modern workplace learning FORMAL INFORMAL 1 Classroom training 2 E-Learning Source: Hart, Jane, “5 Stages of Workplace Learning (Revisited 2017)” Workplace Learning Continues to Evolve
  • 75. Modern learning requires a holistic strategy 75 Learning Experience (LEP) Learning Management (LMS) Modern Content Cornerstone Learning
  • 79. Organizations are Playing a Constant Game of Catch-up Expensive, outdated content Top-down vs. Bottom-up learning Manual curation and learning paths Complex Vendor Management 79
  • 81. 1:1,000 Ratio 81 1 L&D professional for every 1,000 learners Source: Bersin by Deloitte, 2017
  • 82. 82 Cornerstone Content Anytime PRE-CURATED Constantly Evolving Library Topics • Business Skills • Creative • Health & Wellness • Leadership & Management • Office Productivity • Personal Development • Sales & Service • Technology 4PREMIER PARTNERS 2,500+COURSE OFFERINGS
  • 83. 83 Content Anytime: European Edition PRE-CURATED Constantly Evolving • Office Productivity • Personal Development • Sales & Service • Technology • Business Skills • Creative • Health & Wellness • Leadership & Management 5PREMIER PARTNERS 2,500+COURSE OFFERINGS English Spanish German French Portuguese Library Topics
  • 84. 84 Custom Curated Packages • Leadership & Management • Office Productivity • Personal Development • Sales & Service • Technology • Business Skills • Compliance • Continuing Education & Certifications • Creative • Health & Wellness • Industry Specific 34K+MULTILANGUAGE COURSE OFFERINGS 30+PREMIER PARTNERS Library Topics 84
  • 85. 85 We Know Content! Cornerstone Learning Suite Online classes only 2017 Registrations 392M 2017 Completions 235M 85
  • 86. 86 Content Gross Revenue 50% 50% CSOD Content Providers 20%+ OPERATING MARGIN Content Economics Content Subscription Margins
  • 87. 87 Recent Content Anytime Deals Client Industry Location No. of Users Content vs. Learning RPU Multiple Manufacturer France 500 10x Retailer United States 1,000 7x Engineering United Kingdom 750 5x Oil & Gas United Kingdom 20,000 4x Insurance United States 3,000 3x Based on Content Anytime Deals through 12/31/2017
  • 88. 88 3-10x Content Anytime RPU of Learning 100% Size of Content Opportunity Overall Relative to Learning ~$225M ARR Opportunity Today What We’ve Seen Relative Opportunity Today’s ARR Opportunity Content at Scale Sizing the Content Opportunity for Cornerstone
  • 90. Winning in the Learning & HCM Market Josh Bersin Founder, Deloitte by Bersin
  • 91. Josh Bersin Principal and Founder, Bersin™ Deloitte Consulting LLP Copyright © 2018 Deloitte Development LLC. All rights reserved. The Red Hot Corporate Talent and Learning Markets A new era of growth
  • 92. Robots and AI 77% of CEOs expect the role of AI, Robotics, and Automation to “increase significantly” over the next 2 years. Source: Robots: The new low-cost worker, Dhara Ranasinghe, CNBC, April 10, 2015. https://www.cnbc.com/2015/04/10/robots-the-new-low-cost-worker.html Source: China Can’t Buy Enough Industrial Robots, Jethro Mullen, CNNTech, June 23, 2016 http://money.cnn.com/2016/06/23/technology/china-industrial- robots/index.html
  • 93. How the Global Economy Has Changed The value of “brand, IP, and services” is skyrocketing http://www.oceantomo.com/intangible-asset-market-value-study/ http://brandfinance.com/images/upload/gift_report_2017_bf_version_high_res_version.pdf
  • 94. Hiring is as hard as it has been since 2001 and “time to hire” is even greater Unemployment Rate Nearing Record Lows End of Korean War Vietnam War https://www.thebalance.com/unemployment-rate-by-year-3305506 Black Monday Dot Com Dot Bomb Financial Crisis 1970- 1976 6.2% jumping to 12.3 % Inflation 2007 4.1% Inflation Mean “time to hire” for new hires is 31 days, higher than it was in 2001. http://dhihiringindicators.com/wp-content/uploads/2018/01/2018-01-DHI-Hiring-Indicators-Report-FINAL-2.pdf Expected to drop to 3.9%
  • 95. CEOs, CFOs, CHROs agree on #1 issue: risk of retaining and attracting top talent Talent Is Now the #1 CEO Issue TCB-1652 Conference Board C-Suite Challenge 2018, n=570
  • 96. Reinvention of the Talent Management market A new war for labor and skills. Productivity, AI, and Analytics Driving The Next Wave
  • 97. 1990s-2000s 2004-2012 2012-2017 2018+ Automated talent management Integrated talent management Engagement, fit, Culture, analytics Productivity, performance, teams Automate PerformIntegrate Engage Shift from talent management to team and work management Talent management: integrated processes and systems, talent as core to HR and business agenda Systems of automation Practice-driven solutions People management: focus on culture, engagement, environment, leadership, and fit Systems of engagement Empowerment solutions Team and work management: optimizing productivity, alignment, connection of the “network of teams”, tools to make work better. Systems of productivity Productivity-driven solutions
  • 98. • Core HR Technology spending is slowing (41% say it’s flat) • Clients not fully satisfied: only 21% of customers say talent systems “always meet their needs.” • Two biggest growth areas are Learning and Analytics (37% yty) • Career, succession, onboarding, analytics hottest functional needs • User satisfaction is 2/3 lower than vendor satisfaction How will you upgrade your HR technology? Sources: Sierra-Cedar 2016–2017 HR Systems Survey White Paper, 19th Annual Edition, and Sierra-Cedar 2017–2018 HR Systems Survey White Paper, 20th Annual Edition used with permission and 2016 Bersin by Deloitte HR Systems Research Multiple pathways to an HR tech transformation todays state of replacing HR technology HighriskLowrisk ReactiveFocused Current state 22% Rip & replace Move everything all at once to the cloud 25% Hybrids Move ONLY TM or WFM apps to cloud 22% Parallel / Patchwork Combination licensed and cloud solutions 19% Hosting / Outsource Single tenant or BPO Shift to cloud is important, not sufficient Rip and replace pace slows
  • 99. Feedback and engagement Reinventing performance Video-based learning & career Social recognition Well-being Work – Team management 2018 and beyond: From Talent Management to Management Marketgrowth-adoption 2016 Pulse survey Text analytics Mobile feedback 2020 Culture assessment Coaching tools Checkins with feedback Agile, open goal management Org network analysis Recognition everywhere Custom rewards programs Customer recognition Progression over time Video learning Content curation Intelligent learning Career planning Gamification accreditation Well-being fitness tracking Competitions social sharing Points gamification Fitness merges w/ engagement Virtual work management Document management Goal sharing Goal tracking Communications messaging Process automation Integration & new talent apps Analytics driven “Systems of engagement” Apps that “Make work life better” Total Addressable Market: $16.9B in US (2/3 in companies < 500)
  • 100. The exponential importance of learning A business, economic, and social imperative “The learning curve is the earning curve.”
  • 101. A New War for Skills 2/3 of companies believe they have a shortage of technical and complex problem solving skills 2.8 2.9 3 3.1 3.4 3.6 4.4 4.5 5.5 5.5 5.6 5.7 6.5 9.8 0 1 2 3 4 5 6 7 8 9 10 Head of Customer Experience Reliability Engineer Marketing Content Manager Guest Experience Manager Licensed Realtor Head of Partnerships Peronsal Loan Consultant Brand Partner Big Data Developer Full Stack Engineer Customer Success Manager Sales Representative Data Scientist Machine Learning Engineer Most In-Demand Jobs 2018 Soft Skills Tech https://economicgraph.linkedin.com/research/LinkedIns-2017-US-Emerging-Jobs-Report Most In-Demand Skills Most In-Demand Capabilities
  • 102. Yet until now, L&D had not been keeping up 75% of the workforce will be made up of Millennials by 2025, yet 45% tell us they get no leadership development at all. 45% of North American survey respondents think their current skills will be inadequate in three years Source: A New Model for Corporate Learning, by Karie Willyerd, Alwin Grünwald, Kerry Brown, Bernd Welz, and Polly Traylor, Deloitte Human Capital Trends 2017, Deloitte Millennial Survey 2017, Bersin High-Impact Learning Organization 2017, Deloitte Human Capital Trends 2017 and 2018 of survey respondents think their companies are not giving them opportunities to develop future careers 59% The Net-Promoter Score of L&D rated by non HR professionals is -15! - Bersin HILO 2017
  • 103. We are here E-Learning & Blended 1998-2002 2005 20182010 Self-Study Online Learning Course Catalog Online University 2020 Learning In Flow of Work LearningInTheFlow ofWork Instructional Design Kirkpatrick LMS as E-Learning Platform Talent Management Career Focused Lots of Topics Learning Path Career Track Blended Learning Social Learning LMS as Talent Platform Continuous Learning Everyone, All the Time, Everywhere Micro-Learning Real-time Video Courses Everywhere Design Thinking Learning Experience LMS invisible Data Driven, Mobile Learning Experience Learning On Demand Embedded Learning Video, Self-Authored Mobile, YouTube 70-20-10 Taxonomies LMS as Experience Platform Formats Philosophy Users Systems Source: Bersin by Deloitte, Deloitte Consulting LLP From e-learning to “learning in the flow of work” We are entering a whole new era of L&D technologies and architecture
  • 104. L&D Market Size: Content, Technology, Staff Tuition Reimbursement, $27.0 Managerial, $29.6 Compliance, $23.3 Process/Procedure, $21.1 Sales, $19.0Onboarding/orientatio n, $17.3 Professional (engr, acct, legal), $16.9 IT and desktop, $16.7 Soft skills, interpersonal, $16.5 Executive/leadership, $14.6 Customer Service, $12.7 Product Education, $12.7 Basic skills, $6.1 Total Worldwide L&D Spending by Program ($ Billion) US: $141 Billion Global: $211 Billion Sources: ATD Market Study, Bersin Corporate Learning Factbooks, Toward Maturity Benchmark Surveys, Sierra-Cedar HR Systems Survey, Bersin Proprietary Research
  • 105. The L&D Marketplace Is Growing Rapidly -11% 2% 10% 12% 10% 8% 7% 2008-2009 2010-2011 2011-2012 2012-2013 2013-2014 2014-2015 2016-2017 L&D Global Spending YTY Growth Rate Sources: ATD Market Study, Bersin Corporate Learning Factbooks, Toward Maturity Benchmark Surveys, Sierra- Cedar HR Systems Survey
  • 106. Breakdown of Corporate Learning Spend Training Tools and Technology Market LMS Platforms $6 Billion Development Tools $1.5 Billion Other equipment, facilities, technologies $11.5 Billion Spend Category Pct of budget WW Spend Billion Internal Payroll and Facilities 41% 86.71$ External learning providers (content and programs) 26% 54.99$ Tools and technology 9% 19.03$ Tuition Reimbursement 13% 27.49$ Administration 11% 23.26$ 100% 211.48$ Sources: ATD Market Study, Bersin Corporate Learning Factbooks, Toward Maturity Benchmark Surveys, Sierra-Cedar HR Systems Survey, Bersin Proprietary Research
  • 107. L&D Market: Content and Programs Managerial, $7.88 , 14.3% Compliance, $6.19 , 11.3% Process/Procedure, $5.63 , 10.2% Sales, $5.07 , 9.2% Onboarding/orientation, $4.61 , 8.4% Professional (engr, acct, legal), $4.50 , 8.2% IT and desktop, $4.45 , 8.1% Soft skills, interpersonal, $4.39 , 8.0% Executive/leadership, $3.88 , 7.1% Customer Service, $3.38 , 6.1% Product Education, $3.38 , 6.1% Basic skills, $1.63 , 3.0% Total Worldwide Content And Program Spending by Program ($ Billion) US: $36.7 Billion Global: $54.9 Billion Leadership + Mgt: $11.8B Sales + Cust Svc: $8.5B General Softskills: $4.4B IT/Tech/Prof: $8.95B Sources: ATD Market Study, Bersin Corporate Learning Factbooks, Toward Maturity Benchmark Surveys, Sierra-Cedar HR Systems Survey, Bersin Proprietary Research
  • 108. Source: Meet the Modern Learner: Engaging the Overwhelmed, Distracted, and Impatient Employee, Bersin by Deloitte, Deloitte Consulting LLP The Reality of Learning Today: 24 Minutes A Week 24 minutes a week
  • 109. And… We are living longer.. stretching the talent cycle “Since 1840 there has been an increase in life expectancy of three months for every year.” Source: Gratton, Lynda; Scott, Andrew. The 100-Year Life Today’s Millennials have a 50% chance of living to 100+ Increase in Life Expectancy Over Time Source: http://www.mortality.org/ Will Generational Bias Be the Hot Button of 2018?
  • 110. Buidling a completely new career model in companies Redesigned: 58% of companies are redesigning or planning to redesign their career model Deloitte HC Trends 2017 Open Models: While 33% of companies promote vertical career moves, 67% now promote horizontal or project based career progression, and 83% expect to have “open career models” in next 3-5 years. Deloitte HC Trends 2017 More Dynamic: 31% of companies expect careers to be 3-5 years long, and 60% expect them to be 10 years or less Deloitte HC Trends 2017 Learning and career management software is the #1 fastest growing segment in HR technology (Sierra-Cedar 2016– 2017 Survey HR White Paper) Yet….54% of companies have no firm plans to build new career systems for their employees yet. Deloitte HC Trends 2018
  • 111. Many learning tools are needed Source: Toward Maturity, 2017 and Learning Technology Survey, Don Taylor, 2017 Source: Sierra-Cedar HR Systems Study, 2017 Change Has Come: 38% of LMS users want to “improve the user experience” 28% of companies are buying a new core learning platform 14% are planning on replacing their LMS
  • 112. New Learning Tech Segments Are Here Learning Experience Platforms Degreed, EdCast, PathGather Jam, Fuse, Percipio, Cornerstone, Valamis, Tribridge, … Program Experience (Delivery) Platforms Intrepid (Vitalsource), NovoEd EdX, Everwise, OpenEdX, Blackboard, Instructure, ... Micro Learning Platforms Axonify, Grovo, Qstream, Practice, Rehearsal, Jubi, Wisetail, Mindtickle, etc. LMS and Content Platforms Traditional: Cornerstone, Saba, SuccessFactors, SumTotal Modernized: Workday, Oracle, SAP, Bridge, D2L, Litmos, Intellum, Docebo, others Assessment, VR, Development Tools Video Authoring, Intelligent assessment, spaced learning, gaming, virtual reality, collaboration, simulations, … Content Libraries Udacity, Coursera, EdX, Udemy, Pluralsight, SkillSoft, CrossKnowledge, hundreds of others Learning Record Store GrassBlade, Learning Locker, Saltbox, Yet, Watershed Source: Bersin by Deloitte, Deloitte Consulting LLP 1 2 3 4 5 6 7
  • 113. Companies Are Not Yet Ready And Need Vendor Support 2018 Bersin Learning Organization Maturity Model Source: 2017 Bersin by Deloitte High-Impact Learning Organization, n=1,200, >1,000 employees; Bersin by Deloitte, Deloitte Consulting LLP Episodic / Programmatic Level 1 Responsive / Contextualized Level 2 Continuous / Empowering Level 3 Anticipatory / Flow Level 4 6% 20% 39% 35%
  • 114. believe their employees are fully aligned with the corporate purpose 23% believe internal processes for collaboration are working well 14% are excellent at building a differentiated employee experience 22% are using design thinking as part of crafting the employee experience 10% Say problem is urgent 38% Culture, engagement, and beyond Focus on the employee experience Source: Deloitte and Facebook, “Transitioning to the future of work and the workplace,” November 2016
  • 115. Self Service Intelligent ServicesCase Mgt. AI/Voice App Interfaces Engagement Feedback Recognition Learning Career Coaching Performance Goals Succession HRMS Payroll/Time Communications Analytics/AI ONA Workforce Mgt Wellbeing Rewards Benefits Sourcing Recruitment Assessment White collar Hourly Senior leaders Line managers Candidates Contractors External network Alumni Senior Geographic Business Partners Talent Specialists (OD, sourcing, recruiting, learning, organized in networks of excellence) Wellbeing, safety, culture, engagement, recognition Analytics, Monitoring, Predictive, WF Planning HR Tech, App development Research, Market Best Practices, Comp, Ben, Rewards HR Prof DevelopmentHR Ops, AI and Bots, Intelligence Junior Geo Bus Partners Teams@Work (productivity, services, team management, wellness, feedback, recognition, learning) People@Work (productivity, services, team management, wellness, feedback, recognition, learning) Candidates@Life Candidates (products, jobs, projects, opportunities) Leaders@Work Alumni@life Learning and HR Technology Architecture Of The Future
  • 116. Dan Bock Senior Vice President of Sales North America Talent Management Opportunity
  • 117. 117 Talent is the Competitive Advantage That Will Define the Winners & Losers of the 21st Century Success in business is all about people, people, people. Whatever industry a company is in, its employees are its biggest competitive advantage. -Richard Branson “ ”
  • 118. 118 How we manage talent & develop skills in the next 5 years will be completely different from the last 20
  • 119. + += RecruitingPerformanceLearning • RECRUITING MANAGEMENT • CAMPUS & EVENT RECRUITING • CANDIDATE RELATIONSHIP MANAGEMENT • ONBOARDING • PERFORMANCE MANAGEMENT • ENGAGE • SUCCESSION MANAGEMENT • COMPENSATION MANAGEMENT • LEARNING MANAGEMENT • CERTIFICATIONS • CONNECT & COLLABORATE • INSIGHTS • EXTENDED ENTERPRISE 119 The World’s #1 Solution for Unified Talent Management
  • 120. Cornerstone Learning • Foster collaborative learning with fresh content • Enable online & mobile training • Manage competencies & certifications • Build communities & activity streams • Easily administer learning Modern learning to inspire continuous development 120
  • 121. Cornerstone Performance • Facilitate continuous feedback & coaching • Develop aligned goals • Foster career mobility • Manage compensation with ease & precision • Identify top performers & future leaders Continuous performance management to drive engagement and results 121
  • 122. Cornerstone Recruiting • Branded candidate experience • Social sourcing • Recruiting analytics • Robust talent pipelines • Improved process efficiency • New hire onboarding tracking Next-generation recruiting to attract, select and onboard top talent globally 122
  • 123. 123 Canon Visualizes their Talent with Cornerstone 25% Increase in internal hires 84% Performance review completion across 22 countries Launched self-directed learning initiative across the globe
  • 124. 124 ResCare Transforms People’s Lives with Cornerstone 32% Reduced application completion time 48% Reduced time-to-hire 5% Increased application flow
  • 125. Cornerstone 7.6% SAP 7.1% Oracle 4.5% IBM 3.5% Workday 3.3% ADP 3.2% Saba Halogen 3.2% iCIMS 2.4% SumTotal; People Fluent 2.2% Ultimate 0.9% Other 59.9% Talent Management Market Remains Highly Fragmented 125 Talent Management Market Share (2017) Source: IDC Corporation, company estimates
  • 126. 7.1% 4.5% 3.2% 2.2% 3.2% 2013 2014 2015 2016 2017 Cornerstone Continues to Gain Market Share 126Source: Industry analysts, market research, Cornerstone estimates. Talent management includes learning, recruiting, performance management software Talent Management Market Share 2013-2017 5.5% 7.6%
  • 128. 0 500 1,000 1,500 2,000 2,500 3,000 3,500 Learning Performance Recruiting Cornerstone HR Existing Client Penetration Client Opportunity NumberofClients Calculated based on 3,250 clients with approximately 10,850 users on average Clear Opportunity in Recruiting 128 50% penetration in Recruiting is a $100M+ incremental ARR opportunity
  • 129. • Candidate Communication • Employer Branding • External Sourcing • SEO & Google Analytics • Campus Recruiting / Interview Events • Candidate Search • Assessments • Talent Scoring • Talent Pools • Selection • Interview Management • Background Checks • Agency Portal • Partner Integrations • Reporting • New Hire Portals • Onboarding Tracking • Forms Management • Automatic Workflows • Dashboards • Requisition Management • Applicant Tracking • Batch Actions/High Volume OnboardHire Measure *Available with purchase of Selection Cornerstone’s Recruiting Suite Supports the Entire Talent Acquisition Process 129 Select Mobile and Localized Attract
  • 130. 50% 130 Increased Investment in Recruiting More Engineering Resources in 2018
  • 131. 131 Two Critical Areas of Focus Recruiter Experience Candidate Experience
  • 132. 132 Cornerstone Recruiting Becomes Best-in-Class in May
  • 133. 133 Cornerstone Recruiting Becomes Best-in-Class in May
  • 135. Vincent Belliveau Executive Vice President & General Manager, EMEA HCM Opportunity & EMEA
  • 136. EMEA Continues to Expand its Footprint 136 10M+ Users 650+ Clients 21 Countries 30 Languages NOTE: USER AND CLIENT COUNT FIGURES EXCLUDE GROWTH EDITION AND CORNERSTONE FOR SALESFORCE. AS OF DECEMBER 31, 2017
  • 137. 2016 Was a Lost Year
  • 138. 138 2 4 4 13 5 14 13 16 0 5 10 15 20 25 30 35 Qtr1 Qtr2 Qtr3 Qtr4 Existing New • 32% of all new logos included Cornerstone HR in scope • 38% of all new ARR $s included Cornerstone HR • 18% of new ARR $s in existing accounts included Cornerstone HR HCM-driven business (EMEA stats) …Followed by a Solid Comeback in 2017 Led by Accelerating Traction with Cornerstone HR in 2017 with Both New and Existing Clients
  • 139. Our HCM Value Proposition and Opportunity
  • 140. Digital transformation of HR processes Driving employee experience Key Drivers in HCM HR 140
  • 141. Legacy Core HR Technology is Simply Outdated
  • 142. Do Nothing Rip & Replace Organizations Used to Have Two Choices or 142
  • 143. 14% 12% 15% 13% 5% 14% 19% 13% 13% 18% 22% 19% 19% 16% 16% 13% 13% 10% 9% 7% 64% 69% 66% 71% 79% 73% 68% 77% 78% 75% 0% 10% 20% 30% 40% 50% 60% 70% 80% 90% 100% TCPU Public Admin Financial Services Retail Higher Ed Other Services Healthcare Manufacturing High-Tech AMC Replace Upgrade Do Nothing Addressing the Core HR Opportunity 143Source: Sierra Cedar 2015–2016 HR Systems Survey 18th Annual Edition Cornerstone HR is attempting to address the “do nothing” segment vs. upgrade (primarily PeopleSoft) & replace (primarily Workday)
  • 144. Cornerstone’s Approach is Different Low time and cost to value Focused on the experience Lower risk Accelerates transformation 144
  • 145. An Employee-centric Approach to HCM HR TransactionsHR AdministrationTalent Management Analytics SUCCESSION PLANNING ENGAGEMENT SURVEYS COMPENSATION PLANNING BENCHMARKING LEARNING & DEVELOPMENT INSIGHTS & PREDICTIONS EMPLOYEE SELF-SERVICE TIME & SCHEDULING ONBOARDING REPORTING & ANALYTICS RECORDS ADMINISTRATION PAYROLL MANAGEMENT PERFORMANCE & GOALS ORGANISATIONAL VISUALISATION BENEFITS MANAGEMENT RECRUITING & STAFFING WORKFORCE PLANNING ORGANISATIONAL MANAGEMENT ABSENCE MANAGEMENT Cornerstone Marketplace Transformational HR Transactional HR
  • 146. + += The World’s #1 Solution for Unified Talent Management RecruitingPerformanceLearning • RECRUITING MANAGEMENT • CAMPUS & EVENT RECRUITING • CANDIDATE RELATIONSHIP MANAGEMENT • ONBOARDING • PERFORMANCE MANAGEMENT • ENGAGE • SUCCESSION MANAGEMENT • COMPENSATION MANAGEMENT • LEARNING MANAGEMENT • CERTIFICATIONS • CONNECT & COLLABORATE • INSIGHTS • EXTENDED ENTERPRISE 146
  • 148. Import Integrate Edge Import Easily map and load data into Cornerstone Edge Integrate Easily purchase and manage integrations with 3rd-party apps Develop Edge Develop Build external applications and reports using Cornerstone APIs Making Integrations Easy Cornerstone Edge 148
  • 149. Cornerstone HR Transforms HR Administration • View & manage all employee records in one place • Empower employees to manage personal data • Build configurable organizational hierarchies • Control Personally Identifiable Information (PII) access • Create headcount forecasts Modern HR administration – without the rip-and-replace price tag 149
  • 151. Cornerstone is Gaining Traction in HCM Fosway 9-Grid for Cloud HCM Source: Fosway (October 2017) Advanced into the CORE CHALLENGER position in the October 2017 Fosway 9-Grid, progressing from last year’s position as a POTENTIAL CHALLENGER PERFORMANCE POTENTIAL Potential Leader Potential Challenger Potential Performer Strategic Challenger Core Challenger Solid Performer Strategic Leader Core Leader Poor Performer ‘Oct. 2017 ‘Oct. 2016 151
  • 152. Cornerstone HR’s Impact on Deals 152*EMEA deals from 2016-2017 Average deal values converted from local currency to USD Average Suites Purchased Average RPU 1.7 3.5 Without Cornerstone HR With Cornerstone HR ~$20 ~$60 Without Cornerstone HR With Cornerstone HR • In the past two years, EMEA has seen that clients purchasing Cornerstone HR buy ~2x more product suites on average • Inclusion of Cornerstone HR also significantly increased RPUs by ~3x on average
  • 153. CHR Provides More “Shots on Goal”
  • 154. • Huge opportunity • Focused on EMEA • Addressing decentralized HR landscape Initially Targeting International Markets 154
  • 156. Chirag Shah SVP & GM, Emerging Markets Growth Market Opportunity
  • 158. 158 A Sizeable Market… 400M SEATS 100M SEATS SMB MARKET* GLOBAL ADDRESSABLE MARKET *Represents organizations with between 20 and 500 employees globally
  • 159. 159 …that Could Be Our Largest Segment In Dollars SMB unit economics are 4-5x Enterprise, and 2-3x Mid-Market Enterprise Mid-Market SMB
  • 160. 160 Established A Unified, Focused Team in 2017 We moved to a divisional structure to create a more unified, focused approach to addressing the SMB market GM SMB OperationsSMB MarketingSMB SalesSMB Product & Development *HIGHLIGHTED boxes represent new roles/functions added in 2017
  • 161. 161 Took Time To Understand Our Market We engaged an external research firm to help us better understand the makeup of the SMB market Talent Laggards Minimalists 31% Savvy HR Pro 27% Talent Champions 26%16% Addressable MarketNo Interest LOW MEDIUM HIGH Savviness & Feature Requirements 750+ SMBs Interviewed
  • 162. 162 Shifted to a Multi-Product Strategy To enable us to effectively address the entirety of the SMB market, we shifted our go-to-market to a multi-product strategy Savvy HR Pro 27M Seats Talent Champions 26M Seats Simple Robust Minimalists 31M Seats
  • 163. 163 Implemented a Segment-Specific Marketing Approach We have better aligned what we market and the way in which we market it by taking a segment-specific approach
  • 164. 165 Simplified Conversations with Pricing Consistency Pricing consistency between both PiiQ and Cornerstone solutions simplifies conversation for prospects considering both products EXAMPLE Learning & Performance: 150 users Annual Software Price $13,500 $17,500 Upfront Services Price — — Total Annual Price $13,500 $17,500 Monthly User Price $7.50 $9.72
  • 165. 166 The Result: Dramatic Year-Over-Year Sales Growth 3% 234% 0% 50% 100% 150% 200% 250% 1H '17 2H '17 After implementing many of the changes described earlier, SMB demonstrated strong second half growth (with fewer reps than in ‘16) Key Changes Implemented
  • 166. 167 Year-Over-Year Rep Productivity Improvement In the second half of 2017, the average SMB rep was generating 4.3x as much in new sales as they were in the second half of 2016 1.8x 4.3x 0.0x 1.0x 2.0x 3.0x 4.0x 5.0x 1H '17 2H '17 Key Changes Implemented
  • 167. 168 Significant Increase in SMB Deal Volume In Q4 of 2017, the volume of SMB deals was significantly higher than any other quarter in Cornerstone’s history 0 20 40 60 80 100 120 140 160 180 200 Q1:14 Q2:14 Q3:14 Q4:14 Q1:15 Q2:15 Q3:15 Q4:15 Q1:16 Q2:16 Q3:16 Q4:16 Q1:17 Q2:17 Q3:17 Q4:17 Key Changes Implemented Historical SMB Deal Volume
  • 169. 170 A Strong Foundation Current APJ Footprint Clients 170+ Users 3M+ Employees 85 7 Countries 8 Offices
  • 170. 171 But Significant Untapped Potential Remains After ten weeks assessing the APJ region, many of my observations are analogous to what I initially saw with SMB 1 Need an increased level of local expertise Sales and marketing must be more country-specific Pricing strategy must better optimize conversion 2 3
  • 171. 172 It’s Time to Focus We are creating a focused, country-specific GTM approach across the region, with deeper levels of investment in fewer major markets Large-Investment, Anchor Markets Secondary Markets Australia & New Zealand Japan Hong Kong South KoreaSingapore (ASEAN)
  • 172. 173 APJ Expected To Be Key Growth Driver After making some of the changes discussed on previous slides, we expect APJ to be the catalyst to take Cornerstone’s international mix to 40%+ in the years to come 35% 40%+ 30% 33% 36% 39% 42% 2017A 2018E 2019E 2020E International Revenue Mix
  • 173. 174 Cornerstone 2.0 - Services Partner Panel Bill Forsyth Chief Sales & Solutions Officer 174 Colin Brennan Executive Vice President Cloud Deployment Tiffany Appleby Vice President Alliances, North America Jason Magill Senior Manager Human Capital
  • 175. 1. A look back: historical financial performance 2. Transformation: top line 3. Transformation: bottom line 4. ASC 606 and 2018 outlook 5. 2020 Framework Topics to cover 176
  • 177. 168 280 481 806 1,237 1,631 2,153 2,595 2,918 3,250 2008 2009 2010 2011 2012 2013 2014 2015 2016 2017 2.1 3.3 4.9 7.5 10.6 14.1 18.1 23.8 29.9 35.3 2008 2009 2010 2011 2012 2013 2014 2015 2016 2017 Clients Users (in millions) 178 A Decade of Strong Client & User Growth
  • 178. $154 $232 $316 $400 $453 $526 2012 2013 2014 2015 2016 2017 $118 $185 $264 $340 $423 $482 2012 2013 2014 2015 2016 2017 179 Continued Top Line Growth Billings (in millions) Revenue (in millions) 57% 42% 29% 25% 14%Revenue Growth YOY:
  • 179. 180 Best Q3 in CSOD History Q3 Total New Sales Year-over-Year 2010 2011 2012 2013 2014 2015 2016 2017 New Sales Linear (New Sales) Note: charts are illustrative and not drawn to scale.
  • 180. 181 Second Best Q4 in CSOD History Q4 Total New Sales Year-over-Year 2010 2011 2012 2013 2014 2015 2016 2017 New Sales Linear (New Sales) Note: charts are illustrative and not drawn to scale.
  • 181. 182 In the Past, We Focused Only on Total Sales Total New Sales by Year Note: charts are illustrative and not drawn to scale. 2012 2013 2014 2015 2016 2017 New ARR One-Time FX
  • 182. 183 …But Our Sales Mix Shifted Negatively New Sales Composition 2011 2013 2015 2017 Recurring ServicesNew ARR One-Time 15pts lower than in 2011 Note: charts are illustrative and not drawn to scale.
  • 183. How Selling Services Impacted Our ARR 184 2014 Ending ARR Less: Churn Plus: New ARR 2015 2016 2017 2018E $439 $475-495* (8-13%) 2015 Ending ARR 2016 Ending ARR 2017 Ending ARR Less: Churn Less: Churn Less: Churn Plus: New ARR Plus: New ARR Plus: New ARR (in millions) ARR New Sales Excluded: One-Time Excluded: One-Time Excluded: One-Time *2018E ARR reflects the guidance range provided on earnings call on 2/13/18. Note: charts are illustrative and not draw to scale.
  • 184. RECURRING RECURRING RECURRING ARR’s Impact on Total Revenue 185 2015 2016 2017 SERVICES $340 +29% SERVICES $423 +25% SERVICES $482 +14% (in millions) Total Revenue Private & Confidential As ARR growth slowed, so did our recurring and total revenue growth…..
  • 185. RECURRING RECURRING RECURRING SERVICES SERVICES ARR’s Impact on Total Revenue 186 2015 2016 2017 SERVICES $430 +29% $514 +20% Source: Cornerstone estimates Maintaining historical recurring rates would have resulted in higher growth of 400bps in 2016 and 600bps in 2017 (in millions) Total Revenue +$7M (29% vs. 25%) +$32M (20% vs. 14%) Private & Confidential
  • 187. How the Services Transformation Affects Billings 2015 2016 2017 2018 Recurring Billings Services Billings 188
  • 188. Starting ARR Currency ARR Churn New ARR from Existing Customers New ARR from New Customers Ending ARR How ARR Moves Note: Bar sizes are representative only and should not be used to estimate actual values. 189 Illustrative Year-over-Year Bridge
  • 189. 190 How ARR Impacts Recurring Revenue $1M Deal ARR = $1M Rev = $1M ARR = $1M Rev = $0.5M ARR = $1M Rev = $5K Jan 1 July 1 Dec 30 EXAMPLE Date Signed Date Signed Date Signed
  • 190. Prior Year Exit ARR Revenue Lost From Churn Revenue from New ARR Currency Fair Value Adjustment 606 Adjustment Recurring Revenue Illustrative Bridge from 2017 ARR to 2018 Recurring Revenue Note: Bar sizes are representative only and should not be used to estimate actual values. 191
  • 192. -13% -5% -4% -4% 2% 6% 10% - 12% 2012 2013 2014 2015 2016 2017 2018E 193 Improving Operating Leverage Non-GAAP Operating Margin $52M - $62M Note: 2018 represents operating income and margin under ASC 606. Under ASC 605, operating income is $55-65M and margin is 11-13%.
  • 193. Sales & Marketing Spend – Trailing Our Peers 2017 S&M Spend as % of Revenue 194
  • 194. Sales & Marketing Spend Now 2018 S&M Spend as % of Revenue 195
  • 195. A Clear Path to Operating Margin Expansion Cost-cuts already made will drive operating margin expansion 2017 Adjustments 2018E Revenue $482M $497 - $507M 2017 Expenses $455M - Expense cuts announced 12/2017 -$25M + Incremental Expenses $15M = 2018 Expenses $445M Operating Profit $27M $52 - $62M Operating Margin 6% 10 -12% Note: 2018 represents operating income and margin under ASC 606. Under ASC 605, operating income is $55-65M and margin is 11-13%. 196
  • 196. 3% 2% 6% 5% 4% 9% 10% - 12% 2012 2013 2014 2015 2016 2017 2018E 197 Improving Operating Leverage $50M - $60M Unlevered Free Cash Flow
  • 197. 198 Normalized uFCF 2018 uFCF Guidance Midpoint New Datacenters Restructuring Services Exit Working Capital Impact "Normalized" 2018 uFCF ~15% Margin 10-12% Margin ~ 1% ~ 0.5% ~ 3% Operating Cash Flow - Capitalized Software - Capex + Cash Interest = UNLEVERED FREE CASH FLOW
  • 198. 606 and 2018 Outlook
  • 199. 200 1. Billings 2. Revenue 3. Operating Profit 4. Free Cash Flow How Best to Measure Our Progress During Our Transition… Our historical key financial measures have been: Going forward we believe the key metrics will be: 1. ARR 2. Subscription Revenue 3. Operating Profit 4. Unlevered Free Cash Flow
  • 200. 201 2017 – 2018 Revenue Transition Expected revenue impact of sun-setting services $397 $453 - $463 $85 $43 $0 $100 $200 $300 $400 $500 $600 2017 2018E Subscription Revenue Services Total Revenue Note: 2018 assumes ASC 606. (in millions)
  • 201. 202 Understanding ASC 606 • Modified Retrospective Adoption • 2018 financial statements and guidance reported under 606 to reflect adoption of new accounting standard • Financial statements footnotes will include 2018 results reported under 605 • New disclosure in first quarter 10-Q will provide total backlog • One-Time Financial Impacts from Adopting ASC 606 (On Jan. 1, 2018) • Reduction of $7M in deferred revenue with an increase to shareholder equity • Increase of $16M in deferred commissions with an increase to shareholder equity *Update from previous guidance of $29M in deferred commissions • 2018 Financial Impacts • ~$3M total revenue headwind • Slight increase to commission expense • ~$3M operating profit headwind • No impact to cash flow • Expect Commission accounting to improve margins by 2pts over the next several years
  • 202. 2017 Actual (605) 2018 Guidance (605) 2018 Guidance (606) Annual Recurring Revenue* $439M $475 - $495M (8-13% growth) $475 - $495M (8-13% growth) Total Revenue $482M $500 - $510M (4-6% growth) $497 - $507M (3-5% growth) Subscription Revenue $397M $458 - $468M (15-18% growth) $453 - $463 (14-17% growth) Professional Consulting Services Revenue $85M Down ~50% Down ~50% Operating Profit* $27M (6% margin) $55 - $65M (11-13% margin) $52 - $62M (10-12% margin) Unlevered Free Cash Flow* $44M (9% margin) $50 - $60M (10-12% margin) $50 - $60M (10-12% margin) 2018 Guidance (605 and 606) *Denotes a non-GAAP metric. ** Net Interest Expense is Gross Interest Expense less Interest Income Note: Reflects guidance issued as of February 13th, 2018. Please refer to the earnings press release for Q1 2018 guidance. 203 OTHER: 1. Total S&M dollars down YOY 2. Net Interest Expense**: 1. GAAP $25M 2. Non-GAAP $16M 3. Cash Interest Paid $14M 4. Shares outstanding to increase from 58M to 63M when EPS is positive. 5. Operating margin and uFCF margin percentages could vary depending on the pace of services roll-off 6. Income tax expense slightly above $2M 7. Capex 3-4% of revenue
  • 203. Q1 2017 Actual (605) Q1 2018 Guidance (605) Q1 2018 Guidance (606) Total Revenue $112M $126 - $128M (13-15%) $126 - $128M (13-15%) Subscription Revenue $93M $112 - $114M (21-23%) $111 - $113M (19-22%) Professional Consulting Services Revenue $19M Down ~20% Down ~20% Operating Margin* 4.4% Slight Improvement YOY Slight Improvement YOY Unlevered Free Cash Flow Margin* ($14M) Slight Improvement YOY Slight Improvement YOY Q1 2018 Guidance (605 and 606) 204 OTHER: 1. Gross margin expected to be down YOY in Q1, but to significantly improve on a sequential basis in Q2-Q4 2018 2. Net Interest Expense**: 1. GAAP $8M 2. Non-GAAP $5M 3. Cash Interest Paid $3M *Denotes a non-GAAP metric. ** Net Interest Expense is Gross Interest Expense less Interest Income Note: Reflects guidance issued as of February 13th, 2018. Please refer to the earnings press release for Q1 2018 guidance.
  • 205. 206 FY17 Actual FY18 Guidance Low Growth Moderate Growth High Growth SUBSCRIPTION REVENUE GROWTH 16.8% 14-17% < 10% 10 - 20% 20 - 30% NON-GAAP OPERATING MARGIN 5.6% 10-12% 30%+ 18 - 28% 12 - 22% UNLEVERED FREE CASH FLOW MARGIN 9.1% 10-12% 30%+ 20 - 30% 15 - 25% 2020 Growth/Profitability Framework 2020 Framework Note: 2018 assume ASC 606.
  • 206. 207Note: 2020 uFCF target assumes we have no cash taxes and assumes the convertible note is converted into equity. 2020 “Moderate Growth” Target in uFCF ~$150M per share ~$2.00 2020 Growth/Profitability Framework
  • 207. Adam Miller Founder & CEO Summary
  • 208. 1. Exited the enterprise delivery business 2. Reduced Sales & Marketing spend 3. Accelerated margin improvement initiatives 209 Got fit
  • 209. 210 Growing 1. Attaching Content to Learning deals 2. Layering on recurring services 3. Penetrating the installed base
  • 211. 212 Dominate the Learning Market Definitive market leader in Learning Management Only holistic “learning platform” in the market Embedded content & machine learning (Learning Management + Learning Experience)
  • 212. 213 Re-establish Our Leadership in Talent Management Deepest functionality in the market Extreme focus on the experience Holistically integrated across the talent suite
  • 213. 214 Emerge as a Global Human Capital Management Player Only real alternative to “rip & replace” Employee-driven experience Transformation without the cost