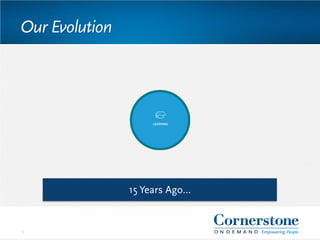
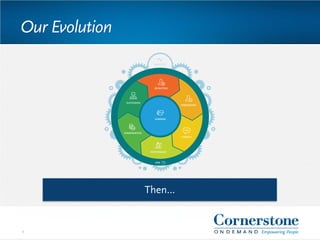
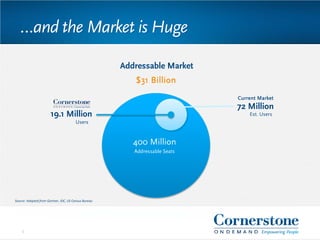
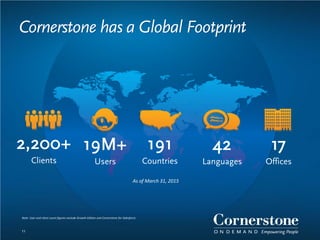
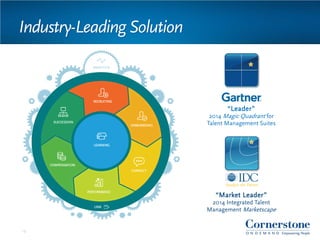
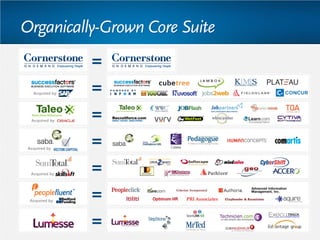
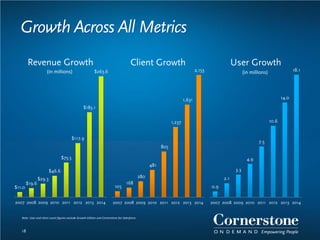
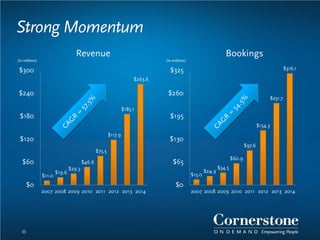
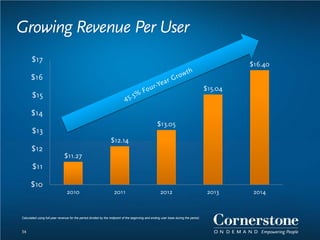
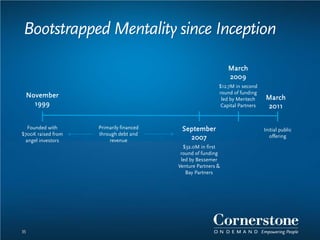
Corporate Overview
Second Quarter 2015
This presentation includes forward-looking statements. In this presentation, the words “believe,” “may,” “will,” “estimate,” “continue,” “anticipate,” “intend,” “expect,” “predict,”
“potential” and similar expressions, as they relate to Cornerstone OnDemand, Inc. (“Cornerstone OnDemand” or the “Company”), business and management, are intended to identify
forward-looking statements. In light of the risks and uncertainties outlined below, the future events and circumstances discussed in this presentation may not occur, and actual results
could differ materially from those anticipated or implied in the forward-looking statements. The Company has based these forward-looking statements largely on its current expectations
and projections about future events and financial trends affecting its business. Forward-looking statements should not be read as guarantees of future performance or results, and will not
necessarily be accurate indications of the times at, or by, which such performance or results will be achieved. Forward-looking statements are based on information available at the date of
this presentation and management’s good faith belief as of such date with respect to future events, and are subject to risks and uncertainties that could cause actual performance or results
to differ materially from those expressed in or suggested by the forward-looking statements. Important factors that could cause such differences include, but are not limited to:
• statements regarding the Company’s business strategies;
• the Company’s anticipated future operating results and operating expenses;
• the Company’s ability to attract new clients to enter into subscriptions for its solution;
• the Company’s ability to service those clients effectively and induce them to renew and upgrade their deployments of the Company’s solution;
• the Company’s ability to expand its sales organization to address effectively the new industries, geographies and types of organizations the company intends to target;
• the Company’s ability to accurately forecast revenue and appropriately plan its expenses; market acceptance of enhanced solutions, alternate ways of addressing learning and talent
management needs or new technologies generally by the Company and its competitors; continued acceptance of SaaS as an effective method for delivering learning and talent
management solutions and other business management applications; the attraction and retention of qualified employees and key personnel;
• the Company’s ability to protect and defend its intellectual property; costs associated with defending intellectual property infringement and other claims; events in the markets for the
Company’s solution and alternatives to the Company’s solution, as well as in the United States and global markets generally; future regulatory, judicial and legislative changes in the
Company’s industry; changes in the competitive environment in the Company’s industry and the markets in which the Company operates; and other factors discussed under “Risk
Factors” and “Management’s Discussion and Analysis of Financial Condition and Results of Operations” in the Company’s periodic reports filed with the Securities and Exchange
Commission (the “SEC”).
Forward-looking statements speak only as of the date of this presentation. You should not put undue reliance on any forward-looking statement. The Company assumes no obligation to
update any forward-looking statements to reflect actual results, changes in assumptions or changes in other factors affecting future performance or results, except to the extent required by
applicable laws. If the Company updates one or more forward-looking statements, no inference should be drawn that it will make additional updates with respect to those or other
forward-looking statements.
In considering investing in the Company’s securities, you should read the documents the Company has filed with the SEC for more complete information about the Company. You may get
these documents for free by visiting EDGAR on the SEC Web site at www.sec.gov.
Safe Harbor
Our Evolution
3
15 Years Ago…
Our Evolution
4
Then…
Our Evolution
5
Now
The Opportunity
7
Work is Changing
WHO
WHAT
WHERE
WHEN
HOW
The Market Need is Real
8
…and the Market is Huge
Source: Adapted from Gartner, IDC, US Census Bureau
Addressable Market
19.1 Million
Users
$31 Billion
400 Million
Addressable Seats
72 Million
Est. Users
Current Market
9
Scale to Meet the Need
Cornerstone has a Global Footprint
191
Countries
42
Languages
17
Offices
2,200+
Clients
19M+
Users
As of March 31, 2015
11
Note: User and client count figures exclude Growth Edition and Cornerstone for Salesforce.
12
“Leader”
2014 Magic Quadrant for
Talent Management Suites
“Market Leader”
2014 Integrated Talent
Management Marketscape
Industry-Leading Solution
Organically-Grown Core Suite
Acquired by
Acquired by
Acquired by
Acquired by
Acquired by
Marching to $1B
The Competitive Landscape
 Focus on innovation
 Organically grown
 Pure SaaS
 System of engagement
 Focus on client success
 Focus on integration
 Built through acquisition
 Mix of SaaS and On-Premise
 System of record
 Clients multiple levels removed
ERP
Suite
Best
Of Breed
15
CSOD has Accelerating Client Traction
2003-2004 2009 2011 20132007
2008 2010 2012 20142005-2006
Key Client Additions
12 21 44 73 105 168
280
481
805
1,237
1,631
2,153
0
400
800
1,200
1,600
2,000
2,400
2003 2004 2005 2006 2007 2008 2009 2010 2011 2012 2013 2014
16
Expanded Global Footprint
Europe, Middle East & Africa Asia Pacific
Select Notable Clients Select Notable Clients
Germany South Africa Spain
AustriaFranceUnited Kingdom
Japan China Australia
JapanIndiaChina
8 Offices
29 Languages
5.6M Est. Users
5 Offices
9 Languages
1.6M Est. Users
17
Growth Across All Metrics
$11.0
$19.6
$29.3
$46.6
$75.5
$117.9
$185.1
$263.6
2007 2008 2009 2010 2011 2012 2013 2014
Revenue Growth
105
168
280
481
805
1,237
1,631
2,153
2007 2008 2009 2010 2011 2012 2013 2014
Client Growth
0.9
2.1
3.3
4.9
7.5
10.6
14.0
18.1
2007 2008 2009 2010 2011 2012 2013 2014
User Growth
(in millions) (in millions)
18
Note: User and client count figures exclude Growth Edition and Cornerstone for Salesforce.
Now with More People with More to Sell
19
Bolstered by Tier One Global Partners
Select Alliances
20
Global Global GlobalGlobal Global
Opportunities Abound
Investment Landscape
 Market Segments
 Vertical Opportunity
 Installed Base Opportunity
 Extended Enterprise
 Big Data
 Platform
22
Market Segment Opportunity
Many, Many Small Business Deals
8 Figure
Enterprise Deals
CORE
BUSINESS
23
Vertical Opportunity
24
Healthcare Life SciencesPublic Sector
Installed Base Penetration
25
have 2+ modules have 3+ modulesNearly
0
250
500
750
1,000
1,250
1,500
1,750
2,000
2,250
Learning Performance Succession Connect Compensation Recruiting Onboarding
Existing Client Penetration Client Opportunity
NumberofClients
Installed Base Opportunity
26 Calculated based on 2,237 clients with approximately 8,500 users on average.
Approximately $1.5B opportunity within installed base
60%
penetration
among other
products
results in
nearly
$700M
opportunity
Extended Enterprise Opportunity
27
Business
Bundled
Purchase
Standalone
Purchase
Bundled
Purchase
Standalone
Purchase
Training for a person
to fill an ongoing need
Training for a person
to close skills gap or
personal interest
Training for people
for ongoing
development
Training for people
to close skills gaps
Consumers
Training
Coordinator
Big Data Opp: CSOD has “Massive Data”
28
Transactional Data | Usage Data | Effective Dating | Behavioral Data
19.1M Users | 191 Countries | Decade of Data
Position
Previous Position
Education
Skills
Interests
Certifications
Accomplishments
Languages
Organization
Preferences
…
Connections
Live Feed (Status)
Feedback
Actions
Snapshots
Teams
Discussions
Badges
Likes
Comments
…
Industry
Business Unit
Department
Division
Region
Groups
Hierarchies
Cost Center
Grade
Location
…
Transcript
Performance
Skills
Goals
Assessments
Dev Plans
Succession
Compensation
Applicants
Applicant Status
…
Collaboration
Organization
Talent
User
Cornerstone Analytics Suite
29
Cornerstone Data APIsCornerstone ViewCornerstone Reporting
Standard & custom reports
embedded with Cornerstone
Big data solution for
predictive hiring
Cornerstone Selection
formerly Evolv Selection
Cornerstone Insights
formerly Evolv Insights
Highly visual dashboards that can
easily slice/dice talent information
Public APIs that can be easily
consumed into 3rd party apps
Cornerstone Planning
Predictive analytics for
managing talent decisions
Big data solution for workforce
planning
Platform Opportunity: Cornerstone Edge
LEARN
Cornerstone API Services Cornerstone App Builder Cornerstone MarketplaceCornerstone Developer
INTEGRATE BUILD MARKET
Developer community to
learn and access key
resources for Cornerstone
Edge
Review Cornerstone API
library, documentation,
tutorials
Create new, unique applications
leveraging Cornerstone APIs &
development tools
Easily access, download,
install and configure custom
and 3rd party apps
30
Multi-tenant REST APIs Mobile-Ready
Cornerstone Apps Partner Apps Custom Apps
One unified suite to recruit, train,
develop, and connect employees
Marketplace of apps integrated and
embedded within Cornerstone
Client-specific applications designed
and built by clients or partners
31
Cornerstone Platform Changes Everything
Financial Highlights
Strong Momentum
$11.0
$19.6
$29.3
$46.6
$75.5
$117.9
$185.1
$263.6
$0
$60
$120
$180
$240
$300
2007 2008 2009 2010 2011 2012 2013 2014
$15.0
$24.9
$34.5
$60.9
$97.6
$154.3
$231.7
$316.1
$0
$65
$130
$195
$260
$325
2007 2008 2009 2010 2011 2012 2013 2014
(in millions)
33
(in millions)
Revenue Bookings
Growing Revenue Per User
34
$11.27
$12.14
$13.05
$15.04
$16.40
$10
$11
$12
$13
$14
$15
$16
$17
2010 2011 2012 2013 2014
Calculated using full-year revenue for the period divided by the midpoint of the beginning and ending user base during the period.
November
1999
Founded with
$700K raised from
angel investors
September
2007
$32.0M in first
round of funding
led by Bessemer
Venture Partners &
Bay Partners
March
2009
$12.7M in second
round of funding
led by Meritech
Capital Partners
Initial public
offering
March
2011
Primarily financed
through debt and
revenue
35
Bootstrapped Mentality since Inception
Clear Path to Profitability
$0.2
$2.2
$11.2
$20.6
$33.3
$43.0
$0
$9
$18
$27
$36
$45
2010 2011 2012 2013 2014 2015E
(in millions)
36
-22%
-17%
-14%
-7%
-6%
-5%
-25%
-20%
-15%
-10%
-5%
0%
2010 2011 2012 2013 2014 2015E
Non-GAAP Operating Cash Flow Non-GAAP Net Loss Margin
Note: 2015E non-GAAP net loss margin uses the midpoint of the revenue guidance range of $337.5 - $341.5M
Not just Software, but Service
37
95% average dollar retention
since inception
Many repeat buyers
Pioneering Client Success
Framework
Business consulting, client
success management and
solution architecture
Thank
You!

Featured Presentation

  • 1.
  • 2.
    This presentation includesforward-looking statements. In this presentation, the words “believe,” “may,” “will,” “estimate,” “continue,” “anticipate,” “intend,” “expect,” “predict,” “potential” and similar expressions, as they relate to Cornerstone OnDemand, Inc. (“Cornerstone OnDemand” or the “Company”), business and management, are intended to identify forward-looking statements. In light of the risks and uncertainties outlined below, the future events and circumstances discussed in this presentation may not occur, and actual results could differ materially from those anticipated or implied in the forward-looking statements. The Company has based these forward-looking statements largely on its current expectations and projections about future events and financial trends affecting its business. Forward-looking statements should not be read as guarantees of future performance or results, and will not necessarily be accurate indications of the times at, or by, which such performance or results will be achieved. Forward-looking statements are based on information available at the date of this presentation and management’s good faith belief as of such date with respect to future events, and are subject to risks and uncertainties that could cause actual performance or results to differ materially from those expressed in or suggested by the forward-looking statements. Important factors that could cause such differences include, but are not limited to: • statements regarding the Company’s business strategies; • the Company’s anticipated future operating results and operating expenses; • the Company’s ability to attract new clients to enter into subscriptions for its solution; • the Company’s ability to service those clients effectively and induce them to renew and upgrade their deployments of the Company’s solution; • the Company’s ability to expand its sales organization to address effectively the new industries, geographies and types of organizations the company intends to target; • the Company’s ability to accurately forecast revenue and appropriately plan its expenses; market acceptance of enhanced solutions, alternate ways of addressing learning and talent management needs or new technologies generally by the Company and its competitors; continued acceptance of SaaS as an effective method for delivering learning and talent management solutions and other business management applications; the attraction and retention of qualified employees and key personnel; • the Company’s ability to protect and defend its intellectual property; costs associated with defending intellectual property infringement and other claims; events in the markets for the Company’s solution and alternatives to the Company’s solution, as well as in the United States and global markets generally; future regulatory, judicial and legislative changes in the Company’s industry; changes in the competitive environment in the Company’s industry and the markets in which the Company operates; and other factors discussed under “Risk Factors” and “Management’s Discussion and Analysis of Financial Condition and Results of Operations” in the Company’s periodic reports filed with the Securities and Exchange Commission (the “SEC”). Forward-looking statements speak only as of the date of this presentation. You should not put undue reliance on any forward-looking statement. The Company assumes no obligation to update any forward-looking statements to reflect actual results, changes in assumptions or changes in other factors affecting future performance or results, except to the extent required by applicable laws. If the Company updates one or more forward-looking statements, no inference should be drawn that it will make additional updates with respect to those or other forward-looking statements. In considering investing in the Company’s securities, you should read the documents the Company has filed with the SEC for more complete information about the Company. You may get these documents for free by visiting EDGAR on the SEC Web site at www.sec.gov. Safe Harbor
  • 3.
  • 4.
  • 5.
  • 6.
  • 7.
  • 8.
    The Market Needis Real 8
  • 9.
    …and the Marketis Huge Source: Adapted from Gartner, IDC, US Census Bureau Addressable Market 19.1 Million Users $31 Billion 400 Million Addressable Seats 72 Million Est. Users Current Market 9
  • 10.
    Scale to Meetthe Need
  • 11.
    Cornerstone has aGlobal Footprint 191 Countries 42 Languages 17 Offices 2,200+ Clients 19M+ Users As of March 31, 2015 11 Note: User and client count figures exclude Growth Edition and Cornerstone for Salesforce.
  • 12.
    12 “Leader” 2014 Magic Quadrantfor Talent Management Suites “Market Leader” 2014 Integrated Talent Management Marketscape Industry-Leading Solution
  • 13.
    Organically-Grown Core Suite Acquiredby Acquired by Acquired by Acquired by Acquired by
  • 14.
  • 15.
    The Competitive Landscape Focus on innovation  Organically grown  Pure SaaS  System of engagement  Focus on client success  Focus on integration  Built through acquisition  Mix of SaaS and On-Premise  System of record  Clients multiple levels removed ERP Suite Best Of Breed 15
  • 16.
    CSOD has AcceleratingClient Traction 2003-2004 2009 2011 20132007 2008 2010 2012 20142005-2006 Key Client Additions 12 21 44 73 105 168 280 481 805 1,237 1,631 2,153 0 400 800 1,200 1,600 2,000 2,400 2003 2004 2005 2006 2007 2008 2009 2010 2011 2012 2013 2014 16
  • 17.
    Expanded Global Footprint Europe,Middle East & Africa Asia Pacific Select Notable Clients Select Notable Clients Germany South Africa Spain AustriaFranceUnited Kingdom Japan China Australia JapanIndiaChina 8 Offices 29 Languages 5.6M Est. Users 5 Offices 9 Languages 1.6M Est. Users 17
  • 18.
    Growth Across AllMetrics $11.0 $19.6 $29.3 $46.6 $75.5 $117.9 $185.1 $263.6 2007 2008 2009 2010 2011 2012 2013 2014 Revenue Growth 105 168 280 481 805 1,237 1,631 2,153 2007 2008 2009 2010 2011 2012 2013 2014 Client Growth 0.9 2.1 3.3 4.9 7.5 10.6 14.0 18.1 2007 2008 2009 2010 2011 2012 2013 2014 User Growth (in millions) (in millions) 18 Note: User and client count figures exclude Growth Edition and Cornerstone for Salesforce.
  • 19.
    Now with MorePeople with More to Sell 19
  • 20.
    Bolstered by TierOne Global Partners Select Alliances 20 Global Global GlobalGlobal Global
  • 21.
  • 22.
    Investment Landscape  MarketSegments  Vertical Opportunity  Installed Base Opportunity  Extended Enterprise  Big Data  Platform 22
  • 23.
    Market Segment Opportunity Many,Many Small Business Deals 8 Figure Enterprise Deals CORE BUSINESS 23
  • 24.
  • 25.
    Installed Base Penetration 25 have2+ modules have 3+ modulesNearly
  • 26.
    0 250 500 750 1,000 1,250 1,500 1,750 2,000 2,250 Learning Performance SuccessionConnect Compensation Recruiting Onboarding Existing Client Penetration Client Opportunity NumberofClients Installed Base Opportunity 26 Calculated based on 2,237 clients with approximately 8,500 users on average. Approximately $1.5B opportunity within installed base 60% penetration among other products results in nearly $700M opportunity
  • 27.
    Extended Enterprise Opportunity 27 Business Bundled Purchase Standalone Purchase Bundled Purchase Standalone Purchase Trainingfor a person to fill an ongoing need Training for a person to close skills gap or personal interest Training for people for ongoing development Training for people to close skills gaps Consumers Training Coordinator
  • 28.
    Big Data Opp:CSOD has “Massive Data” 28 Transactional Data | Usage Data | Effective Dating | Behavioral Data 19.1M Users | 191 Countries | Decade of Data Position Previous Position Education Skills Interests Certifications Accomplishments Languages Organization Preferences … Connections Live Feed (Status) Feedback Actions Snapshots Teams Discussions Badges Likes Comments … Industry Business Unit Department Division Region Groups Hierarchies Cost Center Grade Location … Transcript Performance Skills Goals Assessments Dev Plans Succession Compensation Applicants Applicant Status … Collaboration Organization Talent User
  • 29.
    Cornerstone Analytics Suite 29 CornerstoneData APIsCornerstone ViewCornerstone Reporting Standard & custom reports embedded with Cornerstone Big data solution for predictive hiring Cornerstone Selection formerly Evolv Selection Cornerstone Insights formerly Evolv Insights Highly visual dashboards that can easily slice/dice talent information Public APIs that can be easily consumed into 3rd party apps Cornerstone Planning Predictive analytics for managing talent decisions Big data solution for workforce planning
  • 30.
    Platform Opportunity: CornerstoneEdge LEARN Cornerstone API Services Cornerstone App Builder Cornerstone MarketplaceCornerstone Developer INTEGRATE BUILD MARKET Developer community to learn and access key resources for Cornerstone Edge Review Cornerstone API library, documentation, tutorials Create new, unique applications leveraging Cornerstone APIs & development tools Easily access, download, install and configure custom and 3rd party apps 30
  • 31.
    Multi-tenant REST APIsMobile-Ready Cornerstone Apps Partner Apps Custom Apps One unified suite to recruit, train, develop, and connect employees Marketplace of apps integrated and embedded within Cornerstone Client-specific applications designed and built by clients or partners 31 Cornerstone Platform Changes Everything
  • 32.
  • 33.
    Strong Momentum $11.0 $19.6 $29.3 $46.6 $75.5 $117.9 $185.1 $263.6 $0 $60 $120 $180 $240 $300 2007 20082009 2010 2011 2012 2013 2014 $15.0 $24.9 $34.5 $60.9 $97.6 $154.3 $231.7 $316.1 $0 $65 $130 $195 $260 $325 2007 2008 2009 2010 2011 2012 2013 2014 (in millions) 33 (in millions) Revenue Bookings
  • 34.
    Growing Revenue PerUser 34 $11.27 $12.14 $13.05 $15.04 $16.40 $10 $11 $12 $13 $14 $15 $16 $17 2010 2011 2012 2013 2014 Calculated using full-year revenue for the period divided by the midpoint of the beginning and ending user base during the period.
  • 35.
    November 1999 Founded with $700K raisedfrom angel investors September 2007 $32.0M in first round of funding led by Bessemer Venture Partners & Bay Partners March 2009 $12.7M in second round of funding led by Meritech Capital Partners Initial public offering March 2011 Primarily financed through debt and revenue 35 Bootstrapped Mentality since Inception
  • 36.
    Clear Path toProfitability $0.2 $2.2 $11.2 $20.6 $33.3 $43.0 $0 $9 $18 $27 $36 $45 2010 2011 2012 2013 2014 2015E (in millions) 36 -22% -17% -14% -7% -6% -5% -25% -20% -15% -10% -5% 0% 2010 2011 2012 2013 2014 2015E Non-GAAP Operating Cash Flow Non-GAAP Net Loss Margin Note: 2015E non-GAAP net loss margin uses the midpoint of the revenue guidance range of $337.5 - $341.5M
  • 37.
    Not just Software,but Service 37 95% average dollar retention since inception Many repeat buyers Pioneering Client Success Framework Business consulting, client success management and solution architecture
  • 38.