Download to read offline
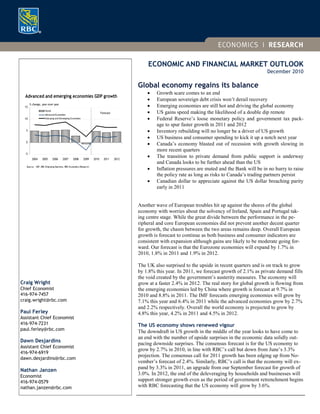

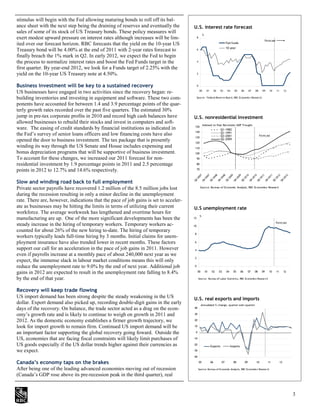

The document provides an economic and financial market outlook for December 2010. It makes the following key points: 1) The global economy has regained balance as growth fears subside. Emerging economies continue to drive growth, while advanced economies are recovering. 2) The US economy is gaining speed and the likelihood of a double-dip recession is now remote. Growth is expected to accelerate to 3.3% in 2011 and 3.6% in 2012 supported by business and consumer spending. 3) European sovereign debt issues pose ongoing risks but overall European growth is expected to continue, albeit at moderate levels of 1.7-1.9% through 2012.


