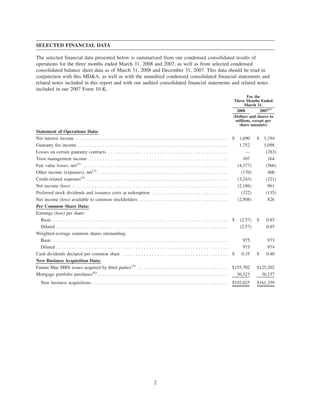
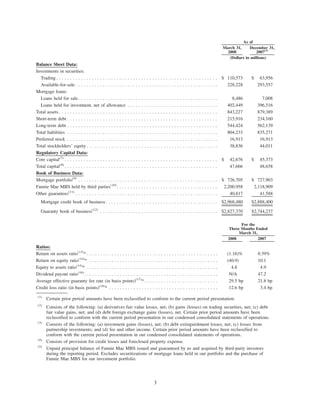
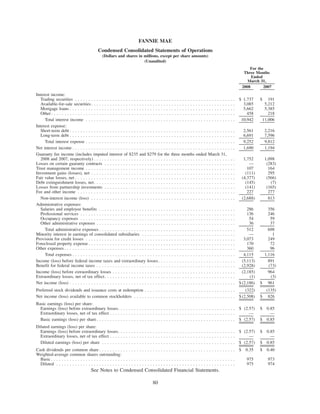
This document is Fannie Mae's Form 10-Q quarterly report filed with the SEC for the quarter ended March 31, 2008. It includes Fannie Mae's unaudited condensed consolidated financial statements and notes, as well as management's discussion and analysis of financial condition and results of operations. Some key details include:
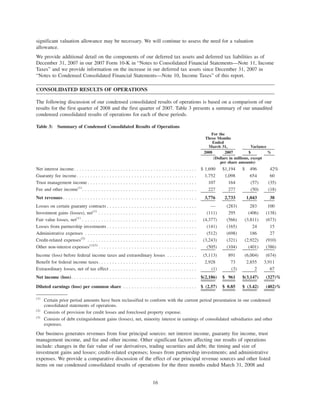
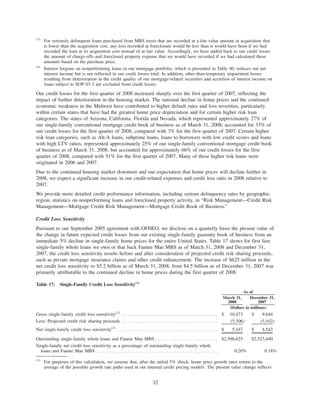
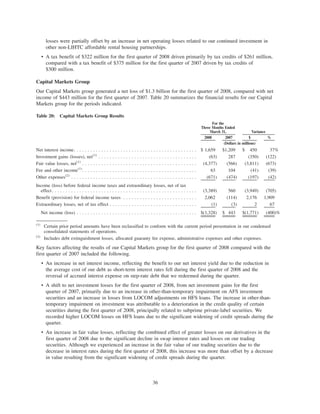
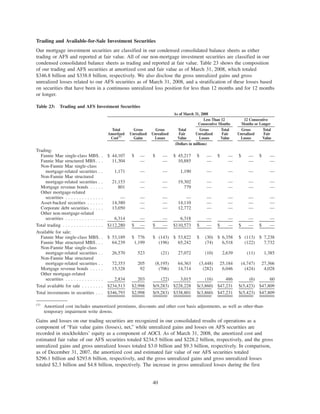
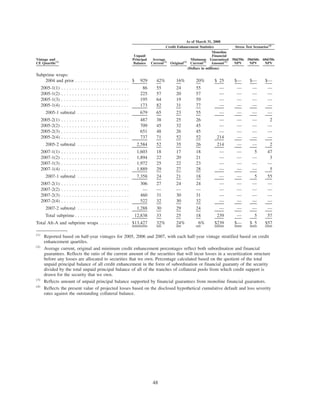
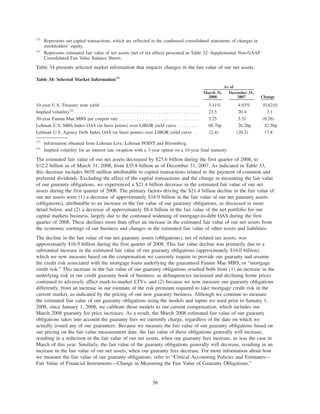
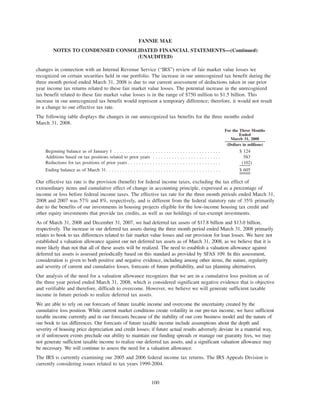
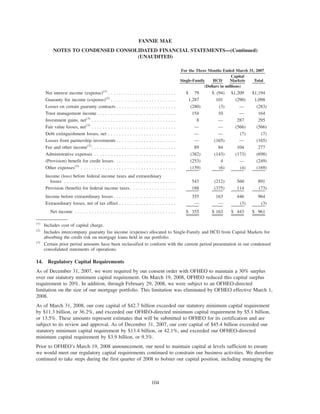
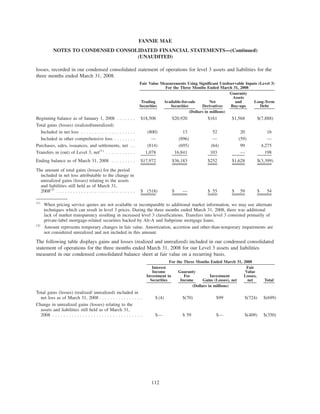
- Fannie Mae reported a net loss of $1.5 billion for the first quarter of 2008, compared to net income of $1.6 billion for the same period in 2007.
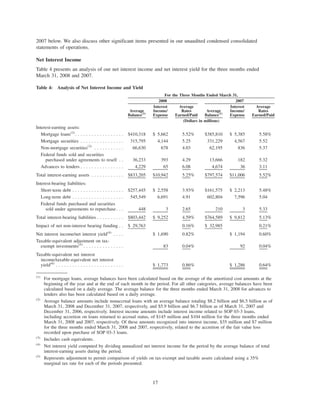
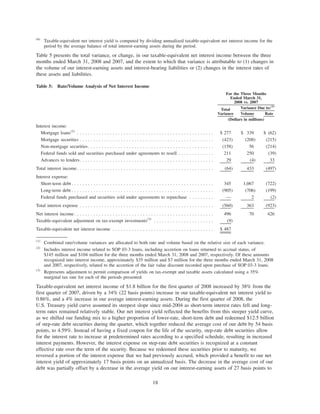
- Net interest income decreased by $0.4 billion compared to the first quarter of 2007, primarily due to higher debt funding costs and lower yields on mortgage loans and investments.
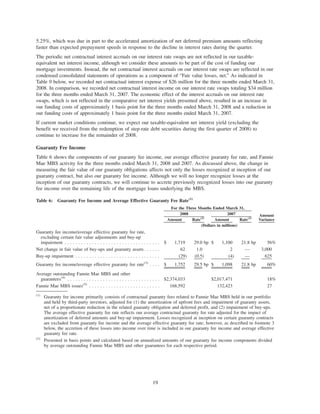
- Credit-


![United Health Group [PDF Document] Form 10-Q](https://cdn.slidesharecdn.com/ss_thumbnails/1016488-thumbnail.jpg?width=640&height=640&fit=bounds)


![United Health Group[PDF Document] Form 10-Q](https://cdn.slidesharecdn.com/ss_thumbnails/1016491-thumbnail.jpg?width=640&height=640&fit=bounds)


