This document is Fannie Mae's annual report on Form 10-K for the fiscal year ended December 31, 2007 filed with the United States Securities and Exchange Commission. It summarizes Fannie Mae's business operations, financial results, risks, legal proceedings, and other required disclosures. Specifically, it provides an overview of Fannie Mae's mission and role in the housing and mortgage markets, describes its business segments and activities, reviews its financial results for 2007 including net income of $11.8 billion, and identifies various legal, regulatory and operational risks facing the company. The report was filed to comply with SEC reporting requirements for publicly traded companies.
Our financial result in 2016 was good, despite the challenging market environment. Orders received exceeded sales and our profitability remained on a satisfactory level even though sales decreased. A strong cash flow and balance sheet create a solid foundation for the future. More info: metso.com/2016
At EY we developed a helpful guide to preparing 2018 season proxy statements. It contains observations about current best practices and also functions as a comprehensive reference to SEC requirements.
Edexcel IGCSE & O Level
Accounting
Correction of errors
Situations where errors occur
Two types of errors
Trial Balance
Errors which do not affect Trial Balance agreement
Omission, Commission, Original Entry, Principal, Compensation, Complete Reversal, Duplication
Errors which affect the agreement of trial balance
suspense account
All igcse past papers
model questions
Die wahlen in den südlichen provinzen starke mobilisierung für die abstimmung...Tanja Seidemann
Die Wahlkampagne für die Abstimmung vom 07. Oktober ruft einen besonderen Enthusiasmus in den südlichen Provinzen hervor, wo die Mobilisierung generell ist, um diese Abstimmung erfolgreich zu machen, die als eine Verankerung des marokkanischen demokratischen und politischen einzigartigen Modells sein möchte.
Chico’s exclusively designed, private branded clothing for women featuring a combination of great style with on-trend, expressive and one-of-a-kind designs that are figure-flattering, unique, relaxed, and fashionable. http://www.chicos.com
when will pi network coin be available on crypto exchange.DOT TECH
There is no set date for when Pi coins will enter the market.
However, the developers are working hard to get them released as soon as possible.
Once they are available, users will be able to exchange other cryptocurrencies for Pi coins on designated exchanges.
But for now the only way to sell your pi coins is through verified pi vendor.
Here is the telegram contact of my personal pi vendor
@Pi_vendor_247
how to sell pi coins effectively (from 50 - 100k pi)DOT TECH
Anywhere in the world, including Africa, America, and Europe, you can sell Pi Network Coins online and receive cash through online payment options.
Pi has not yet been launched on any exchange because we are currently using the confined Mainnet. The planned launch date for Pi is June 28, 2026.
Reselling to investors who want to hold until the mainnet launch in 2026 is currently the sole way to sell.
Consequently, right now. All you need to do is select the right pi network provider.
Who is a pi merchant?
An individual who buys coins from miners on the pi network and resells them to investors hoping to hang onto them until the mainnet is launched is known as a pi merchant.
debuts.
I'll provide you the Telegram username
@Pi_vendor_247
how to swap pi coins to foreign currency withdrawable.DOT TECH
As of my last update, Pi is still in the testing phase and is not tradable on any exchanges.
However, Pi Network has announced plans to launch its Testnet and Mainnet in the future, which may include listing Pi on exchanges.
The current method for selling pi coins involves exchanging them with a pi vendor who purchases pi coins for investment reasons.
If you want to sell your pi coins, reach out to a pi vendor and sell them to anyone looking to sell pi coins from any country around the globe.
Below is the contact information for my personal pi vendor.
Telegram: @Pi_vendor_247
The Evolution of Non-Banking Financial Companies (NBFCs) in India: Challenges...beulahfernandes8
Role in Financial System
NBFCs are critical in bridging the financial inclusion gap.
They provide specialized financial services that cater to segments often neglected by traditional banks.
Economic Impact
NBFCs contribute significantly to India's GDP.
They support sectors like micro, small, and medium enterprises (MSMEs), housing finance, and personal loans.
what is the future of Pi Network currency.DOT TECH
The future of the Pi cryptocurrency is uncertain, and its success will depend on several factors. Pi is a relatively new cryptocurrency that aims to be user-friendly and accessible to a wide audience. Here are a few key considerations for its future:
Message: @Pi_vendor_247 on telegram if u want to sell PI COINS.
1. Mainnet Launch: As of my last knowledge update in January 2022, Pi was still in the testnet phase. Its success will depend on a successful transition to a mainnet, where actual transactions can take place.
2. User Adoption: Pi's success will be closely tied to user adoption. The more users who join the network and actively participate, the stronger the ecosystem can become.
3. Utility and Use Cases: For a cryptocurrency to thrive, it must offer utility and practical use cases. The Pi team has talked about various applications, including peer-to-peer transactions, smart contracts, and more. The development and implementation of these features will be essential.
4. Regulatory Environment: The regulatory environment for cryptocurrencies is evolving globally. How Pi navigates and complies with regulations in various jurisdictions will significantly impact its future.
5. Technology Development: The Pi network must continue to develop and improve its technology, security, and scalability to compete with established cryptocurrencies.
6. Community Engagement: The Pi community plays a critical role in its future. Engaged users can help build trust and grow the network.
7. Monetization and Sustainability: The Pi team's monetization strategy, such as fees, partnerships, or other revenue sources, will affect its long-term sustainability.
It's essential to approach Pi or any new cryptocurrency with caution and conduct due diligence. Cryptocurrency investments involve risks, and potential rewards can be uncertain. The success and future of Pi will depend on the collective efforts of its team, community, and the broader cryptocurrency market dynamics. It's advisable to stay updated on Pi's development and follow any updates from the official Pi Network website or announcements from the team.
how to sell pi coins at high rate quickly.DOT TECH
Where can I sell my pi coins at a high rate.
Pi is not launched yet on any exchange. But one can easily sell his or her pi coins to investors who want to hold pi till mainnet launch.
This means crypto whales want to hold pi. And you can get a good rate for selling pi to them. I will leave the telegram contact of my personal pi vendor below.
A vendor is someone who buys from a miner and resell it to a holder or crypto whale.
Here is the telegram contact of my vendor:
@Pi_vendor_247
Financial Assets: Debit vs Equity Securities.pptxWrito-Finance
financial assets represent claim for future benefit or cash. Financial assets are formed by establishing contracts between participants. These financial assets are used for collection of huge amounts of money for business purposes.
Two major Types: Debt Securities and Equity Securities.
Debt Securities are Also known as fixed-income securities or instruments. The type of assets is formed by establishing contracts between investor and issuer of the asset.
• The first type of Debit securities is BONDS. Bonds are issued by corporations and government (both local and national government).
• The second important type of Debit security is NOTES. Apart from similarities associated with notes and bonds, notes have shorter term maturity.
• The 3rd important type of Debit security is TRESURY BILLS. These securities have short-term ranging from three months, six months, and one year. Issuer of such securities are governments.
• Above discussed debit securities are mostly issued by governments and corporations. CERTIFICATE OF DEPOSITS CDs are issued by Banks and Financial Institutions. Risk factor associated with CDs gets reduced when issued by reputable institutions or Banks.
Following are the risk attached with debt securities: Credit risk, interest rate risk and currency risk
There are no fixed maturity dates in such securities, and asset’s value is determined by company’s performance. There are two major types of equity securities: common stock and preferred stock.
Common Stock: These are simple equity securities and bear no complexities which the preferred stock bears. Holders of such securities or instrument have the voting rights when it comes to select the company’s board of director or the business decisions to be made.
Preferred Stock: Preferred stocks are sometime referred to as hybrid securities, because it contains elements of both debit security and equity security. Preferred stock confers ownership rights to security holder that is why it is equity instrument
<a href="https://www.writofinance.com/equity-securities-features-types-risk/" >Equity securities </a> as a whole is used for capital funding for companies. Companies have multiple expenses to cover. Potential growth of company is required in competitive market. So, these securities are used for capital generation, and then uses it for company’s growth.
Concluding remarks
Both are employed in business. Businesses are often established through debit securities, then what is the need for equity securities. Companies have to cover multiple expenses and expansion of business. They can also use equity instruments for repayment of debits. So, there are multiple uses for securities. As an investor, you need tools for analysis. Investment decisions are made by carefully analyzing the market. For better analysis of the stock market, investors often employ financial analysis of companies.
Poonawalla Fincorp and IndusInd Bank Introduce New Co-Branded Credit Cardnickysharmasucks
The unveiling of the IndusInd Bank Poonawalla Fincorp eLITE RuPay Platinum Credit Card marks a notable milestone in the Indian financial landscape, showcasing a successful partnership between two leading institutions, Poonawalla Fincorp and IndusInd Bank. This co-branded credit card not only offers users a plethora of benefits but also reflects a commitment to innovation and adaptation. With a focus on providing value-driven and customer-centric solutions, this launch represents more than just a new product—it signifies a step towards redefining the banking experience for millions. Promising convenience, rewards, and a touch of luxury in everyday financial transactions, this collaboration aims to cater to the evolving needs of customers and set new standards in the industry.
US Economic Outlook - Being Decided - M Capital Group August 2021.pdfpchutichetpong
The U.S. economy is continuing its impressive recovery from the COVID-19 pandemic and not slowing down despite re-occurring bumps. The U.S. savings rate reached its highest ever recorded level at 34% in April 2020 and Americans seem ready to spend. The sectors that had been hurt the most by the pandemic specifically reduced consumer spending, like retail, leisure, hospitality, and travel, are now experiencing massive growth in revenue and job openings.
Could this growth lead to a “Roaring Twenties”? As quickly as the U.S. economy contracted, experiencing a 9.1% drop in economic output relative to the business cycle in Q2 2020, the largest in recorded history, it has rebounded beyond expectations. This surprising growth seems to be fueled by the U.S. government’s aggressive fiscal and monetary policies, and an increase in consumer spending as mobility restrictions are lifted. Unemployment rates between June 2020 and June 2021 decreased by 5.2%, while the demand for labor is increasing, coupled with increasing wages to incentivize Americans to rejoin the labor force. Schools and businesses are expected to fully reopen soon. In parallel, vaccination rates across the country and the world continue to rise, with full vaccination rates of 50% and 14.8% respectively.
However, it is not completely smooth sailing from here. According to M Capital Group, the main risks that threaten the continued growth of the U.S. economy are inflation, unsettled trade relations, and another wave of Covid-19 mutations that could shut down the world again. Have we learned from the past year of COVID-19 and adapted our economy accordingly?
“In order for the U.S. economy to continue growing, whether there is another wave or not, the U.S. needs to focus on diversifying supply chains, supporting business investment, and maintaining consumer spending,” says Grace Feeley, a research analyst at M Capital Group.
While the economic indicators are positive, the risks are coming closer to manifesting and threatening such growth. The new variants spreading throughout the world, Delta, Lambda, and Gamma, are vaccine-resistant and muddy the predictions made about the economy and health of the country. These variants bring back the feeling of uncertainty that has wreaked havoc not only on the stock market but the mindset of people around the world. MCG provides unique insight on how to mitigate these risks to possibly ensure a bright economic future.
how can i use my minded pi coins I need some funds.DOT TECH
If you are interested in selling your pi coins, i have a verified pi merchant, who buys pi coins and resell them to exchanges looking forward to hold till mainnet launch.
Because the core team has announced that pi network will not be doing any pre-sale. The only way exchanges like huobi, bitmart and hotbit can get pi is by buying from miners.
Now a merchant stands in between these exchanges and the miners. As a link to make transactions smooth. Because right now in the enclosed mainnet you can't sell pi coins your self. You need the help of a merchant,
i will leave the telegram contact of my personal pi merchant below. 👇 I and my friends has traded more than 3000pi coins with him successfully.
@Pi_vendor_247
1. UNITED STATES SECURITIES AND EXCHANGE COMMISSION
Washington, D.C. 20549
Form 10-K
ANNUAL REPORT PURSUANT TO SECTION 13 OR 15(d)
OF THE SECURITIES EXCHANGE ACT OF 1934
For the fiscal year ended December 31, 2007
Commission File No.: 0-50231
Federal National Mortgage Association(Exact name of registrant as specified in its charter)
Fannie Mae
Federally chartered corporation
(State or other jurisdiction of
incorporation or organization)
52-0883107
(I.R.S. Employer
Identification No.)
3900 Wisconsin Avenue,
NW Washington, DC
(Address of principal executive offices)
20016
(Zip Code)
Registrant’s telephone number, including area code:
(202) 752-7000
Securities registered pursuant to Section 12(b) of the Act:
None
Securities registered pursuant to Section 12(g) of the Act:
Common Stock, without par value
(Title of class)
Indicate by check mark if the registrant is a well-known seasoned issuer, as defined in Rule 405 of the Securities
Act. Yes n No ¥
Indicate by check mark if the registrant is not required to file reports pursuant to Section 13 or 15(d) of the
Act. Yes n No ¥
Indicate by check mark whether the registrant (1) has filed all reports required to be filed by Section 13 or 15(d) of the Securities
Exchange Act of 1934 during the preceding 12 months (or for such shorter period that the registrant was required to file such
reports), and (2) has been subject to such filing requirements for the past 90 days. Yes ¥ No n
Indicate by check mark if disclosure of delinquent filers pursuant to Item 405 of Regulation S-K is not contained herein, and will
not be contained, to the best of registrant’s knowledge, in definitive proxy or information statements incorporated by reference in
Part III of this Form 10-K or any amendment to this Form 10-K. n
Indicate by check mark whether the registrant is a large accelerated filer, an accelerated filer, a non-accelerated filer, or a smaller
reporting company. See the definitions of “large accelerated filer,” “accelerated filer” and “smaller reporting company” in
Rule 12b-2 of the Exchange Act. (Check one):
Large accelerated filer ¥ Accelerated filer n Non-accelerated filer n
(Do not check if a smaller reporting company)
Smaller reporting company n
Indicate by check mark whether the registrant is a shell company (as defined in Rule 12b-2 of the Act). Yes n No ¥
The aggregate market value of the common stock held by non-affiliates of the registrant computed by reference to the price at
which the common stock was last sold on June 29, 2007 (the last business day of the registrant’s most recently completed second
fiscal quarter) was approximately $63,724 million.
As of January 31, 2008, there were 978,284,482 shares of common stock of the registrant outstanding.
DOCUMENTS INCORPORATED BY REFERENCE:
Portions of the registrant’s Proxy Statement for the 2008 Annual Meeting of Shareholders and the registrant’s Current Report on
Form 8-K to be filed contemporaneously with the Proxy Statement are incorporated by reference in this Form 10-K in response to
Items 10, 11, 12, 13 and 14 of Part III.
6. PART I
Because of the complexity of our business and the industry in which we operate, we have included in this
annual report on Form 10-K a glossary under “Part II—Item 7—Management’s Discussion and Analysis of
Financial Condition and Results of Operations (“MD&A”)—Glossary of Terms Used in This Report.”
Item 1. Business
OVERVIEW
Fannie Mae’s activities enhance the liquidity and stability of the mortgage market and contribute to making
housing in the United States more affordable and more available to low-, moderate- and middle-income
Americans. These activities include providing funds to mortgage lenders through our purchases of mortgage
assets, and issuing and guaranteeing mortgage-related securities that facilitate the flow of additional funds into
the mortgage market. We also make other investments that increase the supply of affordable housing.
We are a government-sponsored enterprise (“GSE”) chartered by the U.S. Congress under the name “Federal
National Mortgage Association” and are aligned with national policies to support expanded access to housing
and increased opportunities for homeownership. We are subject to government oversight and regulation. Our
regulators include the Office of Federal Housing Enterprise Oversight (“OFHEO”), the Department of Housing
and Urban Development (“HUD”), the Securities and Exchange Commission (“SEC”), and the Department of
the Treasury.
Although we are a corporation chartered by the U.S. Congress, the U.S. government does not guarantee,
directly or indirectly, our securities or other obligations. We are a stockholder-owned corporation, and our
business is self-sustaining and funded exclusively with private capital. Our common stock is listed on the New
York Stock Exchange, and traded under the symbol “FNM.” Our debt securities are actively traded in the over-
the-counter market.
RESIDENTIAL MORTGAGE MARKET OVERVIEW
We operate in the U.S. residential mortgage market, specifically in the secondary mortgage market where
mortgages are bought and sold. We discuss below market and economic factors affecting our business and our
role in the secondary mortgage market.
Market and Economic Factors Affecting Our Business
Our business operates within the U.S. residential mortgage market, and therefore, we consider the amount of
U.S. residential mortgage debt outstanding to be the best measure of the size of our overall market. As of
September 30, 2007, the latest date for which information was available, the amount of U.S. residential
mortgage debt outstanding was estimated by the Federal Reserve to be approximately $11.8 trillion (including
$11.0 trillion of single-family mortgages). Our mortgage credit book of business, which includes mortgage
assets we hold in our investment portfolio, our Fannie Mae mortgage-backed securities (“Fannie Mae MBS”)
held by third parties and credit enhancements that we provide on mortgage assets, was $2.8 trillion as of
September 30, 2007, or approximately 23% of total U.S. residential mortgage debt outstanding.
1
7. The table below provides overall housing and mortgage market statistics for 2007, 2006 and 2005.
Housing and Mortgage Market Data(1)
2007 2006 2005
Home sales (units in thousands) . . . . . . . . . . . . . . . . . . . . . . . . . . . . . . . . . . . . . . . . . . 6,426 7,529 8,359
Home price appreciation (depreciation) based on Fannie Mae House Price Index(2)
. . . . . . (3.1)% 1.1% 12.9%
Home price appreciation (depreciation) based on OFHEO Purchase-Only House Price
Index(3)
. . . . . . . . . . . . . . . . . . . . . . . . . . . . . . . . . . . . . . . . . . . . . . . . . . . . . . . . . (0.3)% 4.1% 9.6%
Single-family mortgage originations (in billions) . . . . . . . . . . . . . . . . . . . . . . . . . . . . . . $2,488 $ 2,761 $ 3,034
Type of single-family mortgage origination:
Purchase share . . . . . . . . . . . . . . . . . . . . . . . . . . . . . . . . . . . . . . . . . . . . . . . . . . . . 50.1% 52.4% 49.8%
Refinance share . . . . . . . . . . . . . . . . . . . . . . . . . . . . . . . . . . . . . . . . . . . . . . . . . . . 49.9% 47.6% 50.2%
Adjustable-rate mortgage share(4)
. . . . . . . . . . . . . . . . . . . . . . . . . . . . . . . . . . . . . . . 17.8% 28.6% 32.4%
Fixed-rate mortgage share . . . . . . . . . . . . . . . . . . . . . . . . . . . . . . . . . . . . . . . . . . . . 82.2% 71.4% 67.6%
Residential mortgage debt outstanding (in billions)(5)
. . . . . . . . . . . . . . . . . . . . . . . . . . . $ — $11,173 $10,036
(1)
The sources of the housing and mortgage market data in this table are the Federal Reserve Board, the Bureau of the
Census, HUD, the National Association of Realtors, the Mortgage Bankers Association and OFHEO. Single-family
mortgage originations, as well as the purchase and refinance shares, are based on February 2008 estimates from Fannie
Mae’s Economics & Mortgage Market Analysis Group. Certain previously reported data may have been changed to
reflect revised historical data from any or all of these organizations.
(2)
Fannie Mae calculates a House Price Index (“HPI”) quarterly using data provided by Fannie Mae, Freddie Mac and
other third party data on home sales. Fannie Mae’s HPI is a weighted repeat transactions index, meaning that it
measures average price changes in repeat sales on the same properties. House price appreciation (depreciation)
reported above reflects the percentage change in Fannie Mae’s HPI from the fourth quarter of the prior year to the
fourth quarter of the reported year.
(3)
OFHEO publishes a purchase-only House Price Index quarterly using data provided by Fannie Mae and Freddie Mac.
OFHEO’s HPI is a truncated measure because it is based solely on loans from Fannie Mae and Freddie Mac. As a
result, it excludes loans in excess of conforming loan amounts, or jumbo loans, and includes only a portion of total
subprime and Alt-A loans outstanding in the overall market. OFHEO’s HPI is a weighted repeat transactions index,
meaning that it measures average price changes in repeat sales on the same properties. House price appreciation
(depreciation) reported above reflects the percentage change in OFHEO’s HPI from the fourth quarter of the prior year
to the fourth quarter of the reported year.
(4)
The adjustable-rate mortgage share is the share of conventional mortgage applications that consisted of adjustable-rate
mortgages, as reported in the Mortgage Bankers Association’s Weekly Mortgage Applications Survey.
(5)
The Federal Reserve’s residential mortgage debt outstanding data as of December 31, 2007 was not available as of the
date of this report.
Mortgage and housing market conditions, which significantly affect our business and our financial
performance, worsened progressively through 2007. The housing market downturn that began in the second
half of 2006 continued through 2007 and is continuing in 2008. The most recent available data show
significant declines in new and existing home sales, housing starts and mortgage originations compared with
prior year levels. Overall housing demand decreased over the past year due to a slowdown in the overall
economy, affordability constraints, and declines in demand for investor properties and second homes, which
had been a key driver of overall housing activity. In addition, inventories of unsold homes have risen
significantly over the past year. The decreased demand and increased supply in the housing market has put
downward pressure on home prices. We estimate that home prices declined by 3.1% on a national basis during
2007. With weak housing activity and national home price declines, growth in total U.S. residential mortgage
debt outstanding slowed to an estimated annual rate of 8% in the first nine months of 2007, compared with
12% over the first nine months of 2006.
These challenging market and economic conditions caused a material increase in mortgage delinquencies and
foreclosures during 2007. The credit performance of subprime and Alt-A loans, as well as other higher risk
loans, has deteriorated sharply during the past year, and even the prime conventional portion of the mortgage
2
8. market has seen signs of credit distress. Many lenders have tightened lending standards or elected to stop
originating subprime and other higher risk loans completely, which has adversely affected many borrowers
seeking alternative financing to refinance out of adjustable-rate mortgages (“ARMs”) resetting to higher rates.
The reduction in liquidity and funding sources in the mortgage credit market has led to a substantial shift in
mortgage originations. The share of mortgage originations consisting of traditional fixed-rate conforming
mortgages has increased substantially, while the share of mortgage originations consisting of Alt-A and
subprime mortgages has dropped significantly. Moreover, credit concerns and the resulting liquidity issues
have affected the general capital markets. During the second half of 2007, the capital markets were
characterized by high levels of volatility, reduced levels of liquidity in the mortgage and broader credit
markets, significantly wider credit spreads and rating agency downgrades on a growing number of mortgage-
related securities. In response to concerns over liquidity in the financial markets, from August 2007 through
January 2008, the Federal Reserve reduced its discount rate by a total of 275 basis points to 3.50% and
lowered the federal funds rate during this period by a total of 225 basis points to 3.00%. After rising in the
first half of the year, long-term bond yields declined during the second half of 2007. As short-term interest
rates decreased in the second half of 2007, the spread between long- and short-term interest rates widened,
resulting in a steepening of the yield curve.
We expect the slower growth trend in U.S. residential mortgage debt outstanding to continue throughout 2008,
and we believe average home prices are likely to continue to decline in 2008. See “Item 1A—Risk Factors”
for a description of the risks associated with the housing market downturn and recent home price declines.
Our Role in the Secondary Mortgage Market
The U.S. Congress chartered Fannie Mae and certain other GSEs to help ensure stability and liquidity within
the secondary mortgage market. In addition, we believe our activities and those of other GSEs help lower the
costs of borrowing in the mortgage market, which makes housing more affordable and increases
homeownership, especially for low- to moderate-income families. We believe our activities also increase the
supply of affordable rental housing.
We operate in the secondary mortgage market where mortgages are bought and sold. We securitize mortgage
loans originated by lenders in the primary mortgage market into Fannie Mae MBS, which can then be readily
bought and sold in the secondary mortgage market. For a description of the securitization process, refer to
“Business Segments—Single-Family Credit Guaranty Business—Mortgage Securitizations” below. By delivering
loans to us in exchange for Fannie Mae MBS, lenders gain the advantage of holding a highly liquid instrument
that offers them the flexibility to determine under what conditions they will hold or sell the MBS. We also
participate in the secondary mortgage market by purchasing mortgage loans (often referred to as “whole loans”)
and mortgage-related securities, including Fannie Mae MBS, for our mortgage portfolio. By selling loans and
mortgage-related securities to us, lenders replenish their funds and, consequently, are able to make additional
loans. Under our charter, we may not lend money directly to consumers in the primary mortgage market.
OUR CUSTOMERS
Our principal customers are lenders that operate within the primary mortgage market where mortgage loans
are originated and funds are loaned to borrowers. Our customers include mortgage banking companies,
investment banks, savings and loan associations, savings banks, commercial banks, credit unions, community
banks, insurance companies, and state and local housing finance agencies. Lenders originating mortgages in
the primary mortgage market often sell them in the secondary mortgage market in the form of whole loans or
in the form of mortgage-related securities.
During 2007, approximately 1,000 lenders delivered mortgage loans to us, either for securitization or for
purchase. We acquire a significant portion of our single-family mortgage loans from several large mortgage
lenders. During 2007, our top five lender customers, in the aggregate, accounted for approximately 56% of our
single-family business volume, compared with 51% in 2006.
3
9. Our top customer, Countrywide Financial Corporation (through its subsidiaries), accounted for approximately
28% of our single-family business volume in 2007, compared with 26% in 2006. In January 2008, Bank of
America Corporation announced that it had reached an agreement to purchase Countrywide Financial
Corporation. Together, Bank of America and Countrywide accounted for approximately 32% of our single-
family business volume in 2007. If the merger is completed and the combined company continues to account
for the same percentage of our business volume as the two prior companies, Bank of America will become our
largest customer. We cannot predict at this time whether or when this merger will be completed and what
effect the merger, if completed, will have on our relationship with Countrywide and Bank of America. Due to
increasing consolidation within the mortgage industry, as well as a number of mortgage lenders having gone
out of business since late 2006, we, as well as our competitors, seek business from a decreasing number of
large mortgage lenders. See “Item 1A—Risk Factors” for a discussion of the risks that this customer
concentration poses to our business.
BUSINESS SEGMENTS
We are organized in three complementary business segments: Single-Family Credit Guaranty, Housing and
Community Development, and Capital Markets. The table below displays net revenues, net income (loss) and
total assets for each of our business segments for the years ended December 31, 2007, 2006 and 2005.
Business Segment Summary Financial Information
2007 2006 2005
For the Year Ended December 31,
(Dollars in millions)
Net revenues:(1)
Single-Family Credit Guaranty . . . . . . . . . . . . . . . . . . . . . . . . . . . . . . . . . $ 7,039 $ 6,073 $ 5,585
Housing and Community Development . . . . . . . . . . . . . . . . . . . . . . . . . . . 424 510 607
Capital Markets. . . . . . . . . . . . . . . . . . . . . . . . . . . . . . . . . . . . . . . . . . . . 3,528 5,202 10,764
Total . . . . . . . . . . . . . . . . . . . . . . . . . . . . . . . . . . . . . . . . . . . . . . . . . $10,991 $11,785 $16,956
Net income (loss):
Single-Family Credit Guaranty . . . . . . . . . . . . . . . . . . . . . . . . . . . . . . . . . $ (858) $ 2,044 $ 2,623
Housing and Community Development . . . . . . . . . . . . . . . . . . . . . . . . . . . 157 338 503
Capital Markets. . . . . . . . . . . . . . . . . . . . . . . . . . . . . . . . . . . . . . . . . . . . (1,349) 1,677 3,221
Total . . . . . . . . . . . . . . . . . . . . . . . . . . . . . . . . . . . . . . . . . . . . . . . . . $ (2,050) $ 4,059 $ 6,347
2007 2006 2005
As of December 31,
(Dollars in millions)
Total assets:
Single-Family Credit Guaranty. . . . . . . . . . . . . . . . . . . . . . . . . . . . . . . $ 23,356 $ 15,777 $ 14,450
Housing and Community Development . . . . . . . . . . . . . . . . . . . . . . . . . 15,094 14,100 12,075
Capital Markets . . . . . . . . . . . . . . . . . . . . . . . . . . . . . . . . . . . . . . . . . 844,097 814,059 807,643
Total . . . . . . . . . . . . . . . . . . . . . . . . . . . . . . . . . . . . . . . . . . . . . . . $882,547 $843,936 $834,168
(1)
Includes net interest income, guaranty fee income, trust management income, and fee and other income.
For information on the results of operations of our business segments, see “Part II—Item 7—MD&A—
Business Segment Results.”
Single-Family Credit Guaranty Business
Our Single-Family Credit Guaranty (“Single-Family”) business works with our lender customers to securitize
single-family mortgage loans into Fannie Mae MBS and to facilitate the purchase of single-family mortgage
loans for our mortgage portfolio. Single-family mortgage loans relate to properties with four or fewer
residential units. Revenues in the segment are derived primarily from: (i) guaranty fees received as
compensation for assuming the credit risk on the mortgage loans underlying single-family Fannie Mae MBS
4
10. and on the single-family mortgage loans held in our portfolio and (ii) trust management income, which is a
fee we earn derived from interest earned on cash flows between the date of remittance of mortgage and other
payments to us by servicers and the date of distribution of these payments to MBS certificateholders.
The aggregate amount of single-family guaranty fees we receive in any period depends on the amount of
Fannie Mae MBS outstanding during that period and the applicable guaranty fee rates. The amount of Fannie
Mae MBS outstanding at any time is primarily determined by the rate at which we issue new Fannie Mae
MBS and by the repayment rate for the loans underlying our outstanding Fannie Mae MBS. Less significant
factors affecting the amount of Fannie Mae MBS outstanding are the extent to which Fannie Mae purchases
loans from its MBS trusts because of borrower default (with the amount of these purchases affected by rates
of borrower defaults on the loans) or because the loans do not conform to the representations made by the
lenders.
Mortgage Securitizations
Our most common type of securitization transaction is referred to as a “lender swap transaction.” Mortgage
lenders that operate in the primary mortgage market generally deliver pools of mortgage loans to us in
exchange for Fannie Mae MBS backed by these loans. After receiving the loans in a lender swap transaction,
we place them in a trust that is established for the sole purpose of holding the loans separate and apart from
our assets. We serve as trustee for the trust. Upon creation of the trust, we deliver to the lender (or its
designee) Fannie Mae MBS that are backed by the pool of mortgage loans in the trust and that represent a
beneficial ownership interest in each of the loans. We guarantee to each MBS trust that we will supplement
amounts received by the MBS trust as required to permit timely payment of principal and interest on the
related Fannie Mae MBS. We retain a portion of the interest payment as the fee for providing our guaranty.
Then, on behalf of the trust, we make monthly distributions to the Fannie Mae MBS certificateholders from
the principal and interest payments and other collections on the underlying mortgage loans.
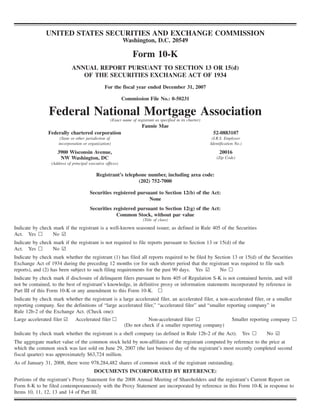
The following diagram illustrates the basic process by which we create a typical Fannie Mae MBS in the case
where a lender chooses to sell the Fannie Mae MBS to a third-party investor.
Borrowers
Lenders
Investors
$$ Mortgages
We create Fannie Mae MBS
backed by pools of mortgage
loans and return the MBS to
lenders. We assume credit
risk, for which we receive
guaranty fees.
2
Fannie
Lenders sell Fannie
Mae MBS to
investors.
3
MBS
TrustFannie Mae
MBS
Fannie Mae
MBS
Lenders originate
mortgage loans
with borrowers.
1
$$
Mortgages
Fannie Mae
MBS
Mortgages
5
11. We issue both single-class and multi-class Fannie Mae MBS. Single-class Fannie Mae MBS refers to Fannie
Mae MBS where the investors receive principal and interest payments in proportion to their percentage
ownership of the MBS issue. Multi-class Fannie Mae MBS refers to Fannie Mae MBS, including real estate
mortgage investment conduits (“REMICs”), where the cash flows on the underlying mortgage assets are
divided, creating several classes of securities, each of which represents a beneficial ownership interest in a
separate portion of cash flows. By separating the cash flows, the resulting classes may consist of: (1) interest-
only payments; (2) principal-only payments; (3) different portions of the principal and interest payments; or
(4) combinations of each of these. Terms to maturity of some multi-class Fannie Mae MBS, particularly
REMIC classes, may match or be shorter than the maturity of the underlying mortgage loans and/or mortgage-
related securities. As a result, each of the classes in a multi-class Fannie Mae MBS may have a different
coupon rate, average life, repayment sensitivity or final maturity. We also issue structured Fannie Mae MBS,
which are multi-class Fannie Mae MBS or single-class Fannie Mae MBS that are resecuritizations of other
single-class Fannie Mae MBS.
MBS Trusts
Single-Family Master Trust Agreement
Each of our single-family MBS trusts formed on or after June 1, 2007 is governed by the terms of our single-
family master trust agreement. Each of our single-family MBS trusts formed prior to June 1, 2007 is governed
either by our fixed-rate or adjustable-rate trust indenture. In addition, each MBS trust, regardless of the date of
its formation, is governed by an issue supplement documenting the formation of that MBS trust and the
issuance of the Fannie Mae MBS by that trust. The master trust agreement or the trust indenture, together with
the issue supplement and any amendments, are the “trust documents” that govern an individual MBS trust.
Optional and Required Purchases of Mortgage Loans from Single-Family MBS Trusts
In accordance with the terms of our single-family MBS trust documents, we have the option or the obligation,
in some instances, to purchase specified mortgage loans from an MBS trust. Our acquisition cost for these
loans is the unpaid principal balance of the loan plus accrued interest.
Optional Purchases
Under our single-family trust documents, we have the right, but are not required, to purchase a mortgage loan
from an MBS trust under a variety of circumstances. When we elect to purchase a mortgage loan or real-estate
owned (“REO”) property from an MBS trust, we primarily do so in one of the following four situations:
• four or more consecutive monthly payments due under the loan are delinquent in whole or in part;
• there is a material breach of a representation and warranty made in connection with the transfer or sale of
the mortgage loan to us;
• the mortgaged property is acquired by the trust as REO property; or
• the borrower transfers or proposes to transfer the mortgaged property and the transfer is not permitted by
an enforceable “due-on-transfer” or “due-on-sale” provision without full payment of the mortgage loan.
We generally exercise our contractual option to purchase a mortgage loan from an MBS trust when we believe
the benefit to us of owning the loan exceeds the benefit of leaving the loan in the trust. In deciding whether
and when to purchase a loan from an MBS trust, we consider a variety of factors. In general, these factors
include: our loss mitigation strategies and the exposure to credit losses we face under our guaranty; our cost of
funds; the effect that a purchase will have on our capital; relevant market yields; the administrative costs
associated with purchasing and holding the loan; mission and policy considerations; counterparty exposure to
lenders that have agreed to cover losses associated with delinquent loans; general market conditions; our
statutory obligations under our Charter Act; and other legal obligations such as those established by consumer
finance laws. We may also purchase loans from an MBS trust, using the optional purchase provision relating
to delinquent payments, as necessary to ensure compliance with provisions of the trust documents. Refer to
“Part II—Item 7—MD&A—Critical Accounting Policies and Estimates” and “Part II—Item 7—MD&A—
6
12. Consolidated Results of Operations” for a description of our accounting for delinquent loans purchased from
MBS trusts and the effect of these purchases on our 2007 financial results.
Required Purchases
Under our single-family trust documents, we generally are required to purchase a mortgage loan from an MBS
trust if:
• a mortgage loan becomes and remains delinquent for 24 consecutive months (excluding months during
which the borrower is complying with a loss mitigation remedy);
• for an adjustable-rate mortgage loan, the interest rate converts from an adjustable rate to a fixed rate, the
index by which the interest rate is determined changes, or the mortgage margin or minimum and
maximum interest rates are changed in connection with an assumption of the loan;
• the borrower exercises a conditional modification option on the maturity date of a loan requiring a final
balloon payment or agrees to modify the loan instead of refinancing the loan in connection with the direct
servicer’s strategy for retaining borrowers;
• we determine, or our regulator or a court determines, that our original acquisition of the mortgage loan
was not permitted;
• a court or governmental entity requires us to purchase the mortgage loan;
• a mortgage insurer or guarantor requires us, after a default under a mortgage loan, to delay the exercise of
loss mitigation remedies beyond any applicable period of time otherwise permitted by the trust
documents; or
• a mortgage insurer or mortgage guarantor requires the trust to transfer a mortgage loan or related REO
property in connection with an insurance or guaranty payment.
Mortgage Acquisitions
We acquire single-family mortgage loans for securitization or for our investment portfolio through either our
flow or bulk transaction channels. In our flow business, we enter into agreements that generally set
agreed-upon guaranty fee prices for a lender’s future delivery of individual loans to us over a specified time
period. Because these agreements establish guaranty fee prices for an extended period of time, we may be
limited in our ability to renegotiate the pricing on our flow transactions with individual lenders to reflect
changes in market conditions and the credit risk of mortgage loans that meet our eligibility standards. These
agreements permit us, however, to charge risk-based price adjustments that apply to all loans delivered to us
with certain risk characteristics. Flow business represents the majority of our mortgage acquisition volumes.
Our bulk business consists of transactions in which a defined set of loans are to be delivered to us in bulk, and
we have the opportunity to review the loans for eligibility and pricing prior to delivery in accordance with the
terms of the applicable contracts. Guaranty fees and other contract terms for our bulk mortgage acquisitions
are negotiated on an individual transaction basis. As a result, we generally have a greater ability to adjust our
pricing more rapidly than in our flow transaction channel to reflect changes in market conditions and the
credit risk of the specific transactions.
Mortgage Servicing
We do not perform the day-to-day servicing of the mortgage loans that are held in our mortgage portfolio or
that back our Fannie Mae MBS (referred to as “primary servicing”). However, if a primary servicer defaults,
we have ultimate responsibility for servicing the loans we purchase or guarantee until a new primary servicer
can be put in place. We also have certain ongoing administrative functions in connection with the mortgage
loans we securitize into Fannie Mae MBS. Typically, lenders who sell single-family mortgage loans to us
initially service the mortgage loans they sell to us. There is an active market in which lenders sell servicing
rights and obligations to other servicers. Our agreement with lenders requires our approval for all servicing
7
13. transfers. We may at times engage a servicing entity to service loans on our behalf due to termination of a
servicer’s servicing relationship or for other reasons.
Mortgage servicers typically collect and remit principal and interest payments, administer escrow accounts,
monitor and report delinquencies, evaluate transfers of ownership interests, respond to requests for partial
releases of security, and handle proceeds from casualty and condemnation losses. For problem loans, servicing
includes negotiating workouts, engaging in loss mitigation and, if necessary, inspecting and preserving
properties and processing foreclosures and bankruptcies. We have the right to remove servicing responsibilities
from any servicer under criteria established in our contractual arrangements with servicers. We compensate
servicers primarily by permitting them to retain a specified portion of each interest payment on a serviced
mortgage loan, called a “servicing fee.” Servicers also generally retain prepayment premiums, assumption fees,
late payment charges and other similar charges, to the extent they are collected from borrowers, as additional
servicing compensation. We also compensate servicers for negotiating workouts on problem loans.
Refer to “Item 1A—Risk Factors” and “Part II—MD&A—Risk Management—Credit Risk Management—
Institutional Counterparty Credit Risk Management” for a discussion of the risks associated with a default by
a mortgage servicer and how we seek to manage those risks.
Mortgage Credit Risk Management
Our Single-Family business has responsibility for managing our credit risk exposure relating to single-family
Fannie Mae MBS held by third parties, as well as managing and pricing the credit risk of single-family
mortgage loans and single-family Fannie Mae MBS held in our own mortgage portfolio. For a description of
our methods for managing single-family mortgage credit risk, refer to “Part II—Item 7—MD&A—Risk
Management—Credit Risk Management—Mortgage Credit Risk Management.”
Housing and Community Development Business
Our Housing and Community Development (“HCD”) business works with our lender customers to securitize
multifamily mortgage loans into Fannie Mae MBS and to facilitate the purchase of multifamily mortgage
loans for our mortgage portfolio. Our HCD business also makes debt and equity investments to increase the
supply of affordable housing. Revenues in the segment are derived from a variety of sources, including the
guaranty fees received as compensation for assuming the credit risk on the mortgage loans underlying
multifamily Fannie Mae MBS and on the multifamily mortgage loans held in our portfolio, transaction fees
associated with the multifamily business and bond credit enhancement fees. In addition, HCD’s investments in
rental housing projects eligible for the federal low-income housing tax credit and other investments generate
both tax credits and net operating losses that reduce our federal income tax liability. Other investments in
rental and for-sale housing generate revenue and losses from operations and the eventual sale of the assets.
Mortgage Securitizations
Our HCD business securitizes multifamily mortgage loans into Fannie Mae MBS. Multifamily mortgage loans
relate to properties with five or more residential units, which may be apartment communities, cooperative
properties or manufactured housing communities. Our HCD business generally creates multifamily Fannie
Mae MBS in the same manner as our Single-Family business creates single-family Fannie Mae MBS. See
“Single-Family Credit Guaranty Business—Mortgage Securitizations” for a description of a typical lender
swap securitization transaction.
MBS Trusts
Multifamily Master Trust Agreement
Each of our multifamily MBS trusts formed on or after September 1, 2007 is governed by the terms of our
multifamily master trust agreement. Each of our multifamily MBS trusts formed prior to September 1, 2007 is
governed either by our fixed-rate or adjustable-rate trust indenture. In addition, each MBS trust, regardless of
8
14. the date of its formation, is governed by an issue supplement documenting the formation of that MBS trust
and the issuance of the Fannie Mae MBS by that trust.
Optional and Required Purchases of Mortgage Loans from Multifamily MBS Trusts
In accordance with the terms of our multifamily MBS trust documents, we have the option or the obligation,
in some instances, to purchase specified mortgage loans from a trust. Our acquisition cost for these loans is
the unpaid principal balance of the loan plus accrued interest. Under our multifamily trust documents, we have
the option to purchase loans from a multifamily MBS trust under the same conditions and terms described
under “Single-Family Credit Guaranty Business—MBS Trusts—Optional and Required Purchases of Mortgage
Loans from Single-Family MBS Trusts—Optional Purchases.” In general, we exercise our option to purchase a
loan from a multifamily MBS trust if the loan is delinquent, in whole or in part, as to four or more
consecutive monthly payments. After we purchase the loan, we generally work with the borrower to modify
the loan. Under our multifamily trust documents, we also are required to purchase loans from a multifamily
MBS trust typically under the same conditions described under “Single-Family Credit Guaranty Business—
MBS Trusts—Optional and Required Purchases of Mortgage Loans from Single-Family MBS Trusts—
Required Purchases.”
Mortgage Acquisitions
Our HCD business acquires multifamily mortgage loans for securitization or for our investment portfolio
through either our flow or bulk transaction channels, in substantially the same manner as described under
“Single-Family Credit Guaranty Business—Mortgage Acquisitions.” In recent years, the percentage of our
multifamily business activity that has consisted of purchases for our investment portfolio has increased relative
to our securitization activity.
Mortgage Servicing
Multifamily mortgage servicing occurs in substantially the same manner as our single-family mortgage
servicing described under “Single-Family Credit Guaranty Business—Mortgage Servicing.” However, in the
case of multifamily loans, servicing also may include performing routine property inspections, evaluating the
financial condition of owners, and administering various types of agreements (including agreements regarding
replacement reserves, completion or repair, and operations and maintenance).
Affordable Housing Investments
Our HCD business helps to expand the supply of affordable housing by investing in rental and for-sale
housing projects. Most of these investments are in rental housing that is eligible for federal low-income
housing tax credits, and the remainder are in conventional rental and primarily entry-level, for-sale housing.
These investments are consistent with our focus on serving communities and improving access to affordable
housing.
LIHTC Partnerships. Our HCD business invests predominantly in low-income housing tax credit (“LIHTC”)
limited partnerships or limited liability companies (referred to collectively as “LIHTC partnerships”) that
directly or indirectly own an interest in rental housing developed or rehabilitated by the LIHTC partnerships.
By renting a specified portion of the housing units to qualified low-income tenants over a 15-year period, the
LIHTC partnerships become eligible for the federal low-income housing tax credit. The LIHTC partnerships
are generally organized by fund manager sponsors who seek investments with third-party developers that, in
turn, develop or rehabilitate the properties and then manage them. We invest in these partnerships in a non-
controlling capacity, with the fund manager acting in a controlling capacity. We earn a return on our
investments in LIHTC partnerships through reductions in our federal income tax liability that result from both
our use of the tax credits for which the LIHTC partnerships qualify and the deductibility of the LIHTC
partnerships’ net operating losses. For additional information regarding our investments in LIHTC partnerships
and their impact on our financial results, refer to “Part II—Item 7—MD&A—Consolidated Results of
9
15. Operations—Losses from Partnership Investments” and “Part II—Item 7—MD&A—Off-Balance Sheet
Arrangements and Variable Interest Entities.”
Equity Investments. Our HCD business also makes equity investments in rental and for-sale housing,
typically through fund managers or directly with developers and operators. Because we invest in a non-
controlling capacity, our exposure is generally limited to the amount of our investment. Our equity investments
in for-sale housing generally involve the acquisition, development and/or construction of entry-level homes or
the conversion of existing housing to entry-level homes.
Debt Investments. Our HCD business also helps to expand the supply of affordable housing by participating
in specialized debt financing for a variety of customers. These activities include providing loans to community
development financial institution intermediaries to re-lend for community revitalization projects that expand
the supply of affordable housing; purchasing participation interests in acquisition, development and
construction loans from lending institutions; and providing financing for single-family and multifamily
housing to housing finance agencies, public housing authorities and municipalities.
Mortgage Credit Risk Management
Our HCD business has responsibility for managing our credit risk exposure relating to multifamily Fannie Mae
MBS held by third parties, as well as managing and pricing the credit risk of multifamily mortgage loans and
multifamily Fannie Mae MBS held in our mortgage portfolio. For a description of our methods for managing
multifamily mortgage credit risk, refer to “Part II—Item 7—MD&A—Risk Management—Credit Risk
Management—Mortgage Credit Risk Management.”
Capital Markets Group
Our Capital Markets group manages our investment activity in mortgage loans, mortgage-related securities and
other investments, our debt financing activity, and our liquidity and capital positions. We fund our investments
primarily through proceeds from our issuance of debt securities in the domestic and international capital
markets.
Our Capital Markets group generates most of its revenue from the difference, or spread, between the interest
we earn on our mortgage assets and the interest we pay on the debt we issue to fund these assets. We refer to
this spread as our net interest yield. Changes in the fair value of the derivative instruments and trading
securities we hold impact the net income or loss reported by the Capital Markets group business segment.
Mortgage Investments
Our mortgage investments include both mortgage-related securities and mortgage loans. We purchase primarily
conventional (i.e., loans that are not federally insured or guaranteed) single-family fixed-rate or adjustable-rate,
first lien mortgage loans, or mortgage-related securities backed by these types of loans. In addition, we
purchase loans insured by the Federal Housing Administration (“FHA”), loans guaranteed by the Department
of Veterans Affairs (“VA”) or by the Rural Housing Service of the Department of Agriculture (“RHS”),
manufactured housing loans, multifamily mortgage loans, subordinate lien mortgage loans (for example, loans
secured by second liens) and other mortgage-related securities. Most of these loans are prepayable at the
option of the borrower. Our investments in mortgage-related securities include structured mortgage-related
securities such as REMICs. For information on our mortgage investments, including the composition of our
mortgage investment portfolio by product type, refer to “Part II—Item 7—MD&A—Consolidated Balance
Sheet Analysis.”
Investment Activities
Our Capital Markets group seeks to maximize long-term total returns while fulfilling our chartered liquidity
function. Our Capital Markets group increases the liquidity of the mortgage market by maintaining a constant
presence as an active investor in mortgage assets and, in particular, supports the liquidity and value of Fannie
Mae MBS in a variety of market conditions.
10
16. The Capital Markets group’s purchases and sales of mortgage assets in any given period generally are
determined by the rates of return that we expect to earn on the equity capital underlying our investments.
When we expect to earn returns greater than our other uses of capital, we generally will be an active purchaser
of mortgage loans and mortgage-related securities. When we believe that few opportunities exist to deploy
capital in mortgage investments, we generally will be a less active purchaser, and may be a net seller, of
mortgage loans and mortgage-related securities. This investment strategy is consistent with our chartered
liquidity function, as the periods during which our purchase of mortgage assets is economically attractive to us
generally have been periods in which market demand for mortgage assets is low.
The spread between the amount we earn on mortgage assets available for purchase or sale and our funding costs,
after consideration of the net risks associated with the investment, is an important factor in determining whether
we are a net buyer or seller of mortgage assets. When the spread between the yield on mortgage assets and our
borrowing costs is wide, which is typically when market demand for mortgage assets is low, we will look for
opportunities to add liquidity to the market primarily by purchasing mortgage assets and issuing debt to investors
to fund those purchases. When this spread is narrow, which is typically when market demand for mortgage
assets is high, we will look for opportunities to meet demand by selling mortgage assets from our portfolio.
Our investment activities are also affected by our capital requirements and other regulatory constraints, as
described below under “Our Charter and Regulation of Our Activities—Regulation and Oversight of Our
Activities.”
Debt Financing Activities
Our Capital Markets group funds its investments primarily through the issuance of debt securities in the
domestic and international capital markets. The objective of our debt financing activities is to manage our
liquidity requirements while obtaining funds as efficiently as possible. We structure our financings not only to
satisfy our funding and risk management requirements, but also to access the capital markets in an orderly
manner using debt securities designed to appeal to a wide range of investors. International investors, seeking
many of the features offered in our debt programs for their U.S. dollar-denominated investments, have been a
significant source of funding in recent years.
Our debt trades in the “agency sector” of the capital markets, along with the debt of other GSEs. Debt in the
agency sector benefits from bank regulations that allow commercial banks to invest in our debt and other
agency debt to a greater extent than other corporate debt. These factors, along with the high credit rating of
our senior unsecured debt securities and the manner in which we conduct our financing programs, have
contributed to the favorable trading characteristics of our debt. As a result, we generally have been able to
borrow at lower interest rates than other corporate debt issuers. For information on the credit ratings of our
long-term and short-term senior unsecured debt, subordinated debt and preferred stock, refer to “Part II—
Item 7—MD&A—Liquidity and Capital Management—Liquidity—Credit Ratings and Risk Ratings.”
Securitization Activities
Our Capital Markets group engages in two principal types of securitization activities:
• creating and issuing Fannie Mae MBS from our mortgage portfolio assets, either for sale into the
secondary market or to retain in our portfolio; and
• issuing structured Fannie Mae MBS for customers in exchange for a transaction fee.
Our Capital Markets group creates Fannie Mae MBS using mortgage loans and mortgage-related securities that
we hold in our investment portfolio, referred to as “portfolio securitizations.” We currently securitize a majority
of the single-family mortgage loans we purchase within the first month of purchase. Our Capital Markets group
may sell these Fannie Mae MBS into the secondary market or may retain the Fannie Mae MBS in our
investment portfolio. In addition, the Capital Markets group issues structured Fannie Mae MBS, which are
generally created through swap transactions, typically with our lender customers or securities dealer customers.
In these transactions, the customer “swaps” a mortgage asset it owns for a structured Fannie Mae MBS we issue.
Our Capital Markets group earns transaction fees for issuing structured Fannie Mae MBS for third parties.
11
17. Customer Services
Our Capital Markets group provides our lender customers and their affiliates with services that include:
offering to purchase a wide variety of mortgage assets, including non-standard mortgage loan products;
segregating customer portfolios to obtain optimal pricing for their mortgage loans; and assisting customers
with the hedging of their mortgage business. These activities provide a significant flow of assets for our
mortgage portfolio, help to create a broader market for our customers and enhance liquidity in the secondary
mortgage market.
Risk Management
Our Capital Markets group has responsibility for managing our interest rate risk, liquidity risk and the credit
risk of the non-Fannie Mae mortgage-related securities held in our portfolio. For a description of our methods
for managing these and other risks to our business, refer to “Part II—Item 7—MD&A—Risk Management.”
COMPETITION
Our competitors include the Federal Home Loan Mortgage Corporation, referred to as Freddie Mac, the
Federal Home Loan Banks, the FHA, financial institutions, securities dealers, insurance companies, pension
funds, investment funds and other investors.
We compete to acquire mortgage assets in the secondary market both for our investment portfolio and for
securitization into Fannie Mae MBS. Competition for the acquisition of mortgage assets is affected by many
factors, including the supply of residential mortgage loans offered for sale in the secondary market by loan
originators and other market participants, the current demand for mortgage assets from mortgage investors,
and the credit risk and prices associated with available mortgage investments.
We also compete for the issuance of mortgage-related securities to investors. Issuers of mortgage-related
securities compete on the basis of the value of their products and services relative to the prices they charge.
An issuer can deliver value through the liquidity and trading levels of its securities, the range of products and
services it offers, its ability to customize products based on the specific preferences of individual investors,
and the reliability and consistency with which it conducts its business. In recent years, there was a significant
increase in the issuance of mortgage-related securities by non-agency issuers, which caused a decrease in our
share of the market for new issuances of single-family mortgage-related securities from 2003 to 2006. Non-
agency issuers, also referred to as private-label issuers, are those issuers of mortgage-related securities other
than agency issuers Fannie Mae, Freddie Mac and the Government National Mortgage Association (“Ginnie
Mae”). The mortgage and credit market disruption that began in 2007 led many investors to curtail their
purchases of private-label mortgage-related securities in favor of mortgage-related securities backed by GSE
guaranties. Based on data provided by Inside MBS & ABS, we estimate that issuances of private-label
mortgage-related securities declined by 83% from the fourth quarter of 2006 to the fourth quarter of 2007. As
a result of these changes in investor demand, our estimated market share of new single-family mortgage-
related securities issuance increased significantly to approximately 48.5% for the fourth quarter of 2007 from
approximately 24.6% for the fourth quarter of 2006. Our estimates of market share are based on publicly
available data and exclude previously securitized mortgages.
We also compete for low-cost debt funding with institutions that hold mortgage portfolios, including Freddie
Mac and the Federal Home Loan Banks.
OUR CHARTER AND REGULATION OF OUR ACTIVITIES
We are a stockholder-owned corporation, originally established in 1938, organized and existing under the
Federal National Mortgage Association Charter Act, which we refer to as the Charter Act or our charter.
12
18. Charter Act
The Charter Act sets forth the activities that we are permitted to conduct, authorizes us to issue debt and
equity securities, and describes our general corporate powers. The Charter Act states that our purpose is to:
• provide stability in the secondary market for residential mortgages;
• respond appropriately to the private capital market;
• provide ongoing assistance to the secondary market for residential mortgages (including activities relating
to mortgages on housing for low- and moderate-income families involving a reasonable economic return
that may be less than the return earned on other activities) by increasing the liquidity of mortgage
investments and improving the distribution of investment capital available for residential mortgage
financing; and
• promote access to mortgage credit throughout the nation (including central cities, rural areas and
underserved areas) by increasing the liquidity of mortgage investments and improving the distribution of
investment capital available for residential mortgage financing.
In addition to the alignment of our overall strategy with these purposes, all of our business activities must be
permissible under the Charter Act. Our charter authorizes us to, among other things, purchase, service, sell,
lend on the security of, and otherwise deal in certain mortgage loans; issue debt obligations and mortgage-
related securities; and “do all things as are necessary or incidental to the proper management of [our] affairs
and the proper conduct of [our] business.”
Loan Standards
Mortgage loans we purchase or securitize must meet the following standards required by the Charter Act.
• Principal Balance Limitations. Our charter permits us to purchase and securitize conventional mortgage
loans secured by either a single-family or multifamily property. Single-family conventional mortgage loans
are generally subject to maximum original principal balance limits. The principal balance limits are often
referred to as “conforming loan limits” and are established each year based on the national average price of
a one-family residence. OFHEO has set the conforming loan limit for a one-family residence at $417,000
for 2007 and 2008. In February 2008, Congress passed legislation that temporarily increases the conforming
loan limit in high-cost metropolitan areas for loans originated between July 1, 2007 and December 31,
2008. For a one-family residence, the loan limit increased to 125% of the area’s median house price, up to a
maximum of $729,750. Higher original principal balance limits apply to mortgage loans secured by two- to
four-family residences and also to loans in Alaska, Hawaii, Guam and the Virgin Islands. No statutory limits
apply to the maximum original principal balance of multifamily mortgage loans that we purchase or
securitize. In addition, the Charter Act imposes no maximum original principal balance limits on loans we
purchase or securitize that are either insured by the FHA or guaranteed by the VA.
• Quality Standards. The Charter Act requires that, so far as practicable and in our judgment, the
mortgage loans we purchase or securitize must be of a quality, type and class that generally meet the
purchase standards of private institutional mortgage investors. To comply with this requirement and to
operate our business efficiently, we have eligibility policies and provide guidelines both for the mortgage
loans we purchase or securitize and for the sellers and servicers of these loans.
• Loan-to-Value and Credit Enhancement Requirements. The Charter Act generally requires credit
enhancement on any conventional single-family mortgage loan that we purchase or securitize if it has a
loan-to-value ratio over 80% at the time of purchase. We also do not purchase or securitize second lien
single-family mortgage loans when the combined loan-to-value ratio exceeds 80%, unless the second lien
mortgage loan has credit enhancement in accordance with the requirements of the Charter Act. The credit
enhancement required by our charter may take the form of one or more of the following: (i) insurance or
a guaranty by a qualified insurer; (ii) a seller’s agreement to repurchase or replace any mortgage loan in
default (for such period and under such circumstances as we may require); or (iii) retention by the seller
of at least a 10% participation interest in the mortgage loans. We do not adjust the loan-to-value ratio of
13
19. loans bearing credit enhancement to reflect that credit enhancement. Regardless of loan-to-value ratio, the
Charter Act does not require us to obtain credit enhancement to acquire two types of loans that are often
described as “conventional mortgage loans”: home improvement loans and loans secured by manufactured
housing.
Other Charter Act Limitations and Requirements
In addition to specifying our purpose, authorizing our activities and establishing various limitations and
requirements relating to the loans we purchase and securitize, the Charter Act has the following provisions.
• Issuances of Our Securities. The Charter Act authorizes us, upon approval of the Secretary of the
Treasury, to issue debt obligations and mortgage-related securities. At the discretion of the Secretary of
the Treasury, the Department of the Treasury may purchase obligations of Fannie Mae up to a maximum
of $2.25 billion outstanding at any one time. We have not used this facility since our transition from
government ownership in 1968. Neither the U.S. government nor any of its agencies guarantees, directly
or indirectly, our debt or mortgage-related securities or is obligated to finance our operations or assist us
in any other manner.
• Exemptions for Our Securities. Securities we issue are “exempted securities” under laws administered by
the SEC. As a result, registration statements with respect to offerings of our securities are not filed with
the SEC. In March 2003, we voluntarily registered our common stock with the SEC under Section 12(g)
of the Securities Exchange Act of 1934 (the “Exchange Act”). As a result, we are required to file periodic
and current reports with the SEC, including annual reports on Form 10-K, quarterly reports on Form 10-Q
and current reports on Form 8-K. We are also required to file proxy statements with the SEC. In addition,
our directors and certain officers are required to file reports with the SEC relating to their ownership of
Fannie Mae equity securities. The voluntary registration of our common stock under Section 12(g) of the
Exchange Act does not affect the exempt status of the debt, equity and mortgage-backed securities that
we issue.
• Exemption from Specified Taxes. Pursuant to the Charter Act, we are exempt from taxation by states,
counties, municipalities or local taxing authorities, except for taxation by those authorities on our real
property. However, we are not exempt from the payment of federal corporate income taxes.
• Other Limitations and Requirements. Under the Charter Act, we may not originate mortgage loans or
advance funds to a mortgage seller on an interim basis, using mortgage loans as collateral, pending the
sale of the mortgages in the secondary market. In addition, we may only purchase or securitize mortgages
on properties located in the United States, including the District of Columbia, the Commonwealth of
Puerto Rico, and the territories and possessions of the United States.
Regulation and Oversight of Our Activities
As a federally chartered corporation, we are subject to Congressional legislation and oversight and are
regulated by HUD and OFHEO. In addition, we are subject to regulation by the Department of the Treasury
and by the SEC.
HUD Regulation
Program Approval
HUD has general regulatory authority to promulgate rules and regulations to carry out the purposes of the
Charter Act, excluding authority over matters granted exclusively to OFHEO. We are required under the Charter
Act to obtain approval of the Secretary of HUD for any new conventional mortgage program that is significantly
different from those approved or engaged in prior to the enactment of the Federal Housing Enterprises Financial
Safety and Soundness Act of 1992 (the “1992 Act”). The Secretary of HUD must approve any new program
unless the Charter Act does not authorize it or the Secretary finds that it is not in the public interest.
14
20. Investment Review
HUD periodically conducts reviews of our activities to ensure compliance with the Charter Act and other
regulatory requirements. In June 2006, HUD announced that it would conduct a review of our investments and
holdings, including certain equity and debt investments classified in our consolidated financial statements as
“other assets/other liabilities,” to determine whether our investment activities are consistent with our charter
authority. We are fully cooperating with this review. If HUD determines that these investment activities are not
permissible under the Charter Act, we could be prevented from continuing some of our current business
activities and may be required to modify our investment approach.
Annual Housing Goals and Subgoals
For each calendar year, we are subject to housing goals and subgoals set by HUD. The goals, which are set as
a percentage of the total number of dwelling units underlying our total mortgage purchases, are intended to
expand housing opportunities (1) for low- and moderate-income families, (2) in HUD-defined underserved
areas, including central cities and rural areas, and (3) for low-income families in low-income areas and for
very low-income families, which is referred to as “special affordable housing.” In addition, HUD has
established three home purchase subgoals that are expressed as percentages of the total number of mortgages
we purchase that finance the purchase of single-family, owner-occupied properties located in metropolitan
areas, and a subgoal for multifamily special affordable housing that is expressed as a dollar amount. We report
our progress toward achieving our housing goals to HUD on a quarterly basis, and we are required to submit a
report to HUD and Congress on our performance in meeting our housing goals on an annual basis.
The following table compares our performance against the housing goals and subgoals for 2007, 2006 and 2005.
The 2005 and 2006 performance results are final results that have been validated by HUD. The 2007 performance
results are preliminary results that we have not finalized and that also have not yet been validated by HUD.
Housing Goals and Subgoals Performance
Result(1)
Goal Result(1)
Goal Result(1)
Goal
2007 2006 2005
Housing goals:(2)
Low- and moderate-income housing . . . . . . . . . . . . . . . . . 55.34% 55.0% 56.93% 53.0% 55.06% 52.0%
Underserved areas . . . . . . . . . . . . . . . . . . . . . . . . . . . . . . 43.41 38.0 43.59 38.0 41.43 37.0
Special affordable housing . . . . . . . . . . . . . . . . . . . . . . . . 26.47 25.0 27.81 23.0 26.28 22.0
Housing subgoals:
Home purchase subgoals:(3)
Low- and moderate-income housing. . . . . . . . . . . . . . . . 42.16 47.0% 46.93% 46.0% 44.59% 45.0%
Underserved areas . . . . . . . . . . . . . . . . . . . . . . . . . . . . 33.46 33.0 34.49 33.0 32.56 32.0
Special affordable housing . . . . . . . . . . . . . . . . . . . . . . 15.46 18.0 17.95 17.0 17.03 17.0
Multifamily special affordable housing subgoal
($ in billions)(4)
. . . . . . . . . . . . . . . . . . . . . . . . . . . . . . $19.85 $5.49 $13.31 $5.49 $10.39 $5.49
(1)
Results presented for 2007 are preliminary and reflect our best estimates as of the date of this report. These results
may differ from the results we report in our Annual Housing Activities Report for 2007. In addition, HUD has not yet
determined our results for 2007. The source of our 2006 and 2005 results is HUD’s analysis of data we submitted to
HUD. Some results differ from the results we reported in our Annual Housing Activities Reports for 2006 and 2005.
(2)
Goals are expressed as a percentage of the total number of dwelling units financed by eligible mortgage loan
purchases during the period.
(3)
Home purchase subgoals measure our performance by the number of loans (not dwelling units) providing purchase
money for owner-occupied single-family housing in metropolitan areas.
(4)
The multifamily subgoal is measured by loan amount and expressed as a dollar amount.
As shown by the table above, in 2005, we met each of our three housing goals and three of the four subgoals,
but fell slightly short of the “low- and moderate-income housing” home purchase subgoal. We met all of our
housing goals and subgoals in 2006.
15
21. In 2007, we believe that we met each of our three housing goals, as well as the “underserved areas” home
purchase subgoal and “multifamily special affordable housing” subgoal. However, based on our preliminary
calculations, we believe that we did not meet our “low- and moderate-income housing” and “special affordable
housing” home purchase subgoals. We expect to submit our 2007 Annual Housing Activities Report to HUD
in March 2008, and HUD will make the final determination regarding our housing goals performance for
2007.
Declining market conditions and the increased goal levels in 2007 made meeting our housing goals and
subgoals even more challenging than in previous years. Challenges to meeting our housing goals and subgoals
in 2007 included deteriorating conditions in the mortgage credit markets and reduced housing affordability.
Housing affordability has declined significantly in the past several years, due to previous increases in home
prices, increases in interest rates from previous historically low levels and reduced income growth rates. The
credit tightening that began in the second half of 2007 also contributed to reduced affordability. These difficult
market conditions negatively impacted market opportunities to purchase mortgages that satisfied the subgoal
requirements. We expect these market conditions to continue to affect our ability to meet our housing goals
and subgoals in 2008. Moreover, all of the housing goals and one of the housing subgoals have increased for
2008.
The housing goals are subject to enforcement by the Secretary of HUD. The subgoals, however, are treated
differently. Pursuant to the 1992 Act, the “low- and moderate-income housing” and “underserved areas” home
purchase subgoals are not enforceable by HUD. However, HUD has taken the position that the “special
affordable housing” and “multifamily special affordable housing” subgoals are enforceable. If our efforts to
meet the housing goals and special affordable housing subgoals prove to be insufficient, we may become
subject to a housing plan that could require us to take additional steps that could have an adverse effect on our
profitability. HUD’s regulations state that HUD shall require us to submit a housing plan if we fail to meet
one or more housing goals and HUD determines that achievement was feasible, taking into account market
and economic conditions and our financial condition. The housing plan must describe the actions we will take
to meet the goal in the next calendar year. If HUD determines that we have failed to submit a housing plan or
to make a good faith effort to comply with the plan, HUD has the right to take certain administrative actions.
The potential penalties for failure to comply with the housing plan requirements are a cease-and-desist order
and civil money penalties.
There is no penalty for failing to meet the “low- and moderate-income housing” home purchase subgoal,
because it is not enforceable. However, if HUD determines that achievement of the “special affordable
housing” home purchase subgoal was feasible in 2007, we may become subject to a housing plan as described
above.
See “Item 1A—Risk Factors” for a description of how changes we have made to our business strategies in
order to meet HUD’s housing goals and subgoals have increased our credit losses and may reduce our
profitability.
OFHEO Regulation
OFHEO is an independent office within HUD that is responsible for ensuring that we are adequately
capitalized and operating safely in accordance with the 1992 Act. OFHEO has agency examination authority,
and we are required to submit to OFHEO annual and quarterly reports on our financial condition and results
of operations. OFHEO is authorized to levy annual assessments on Fannie Mae and Freddie Mac, to the extent
authorized by Congress, to cover OFHEO’s reasonable expenses. OFHEO’s formal enforcement powers
include the power to impose temporary and final cease-and-desist orders and civil monetary penalties on the
company and our directors and executive officers.
OFHEO Consent Order
In 2003, OFHEO began a special examination of our accounting policies and practices, internal controls,
financial reporting, corporate governance, and other matters. In May 2006, concurrently with OFHEO’s release
of its final report of the special examination, we agreed to OFHEO’s issuance of a consent order that resolved
16
22. open matters relating to their investigation of us. Under the consent order, we neither admitted nor denied any
wrongdoing and agreed to make changes and take actions in specified areas, including our accounting
practices, capital levels and activities, corporate governance, Board of Directors, internal controls, public
disclosures, regulatory reporting, personnel and compensation practices.
In the OFHEO consent order, we agreed to the following additional restrictions relating to our capital activity:
• We must maintain a 30% capital surplus over our statutory minimum capital requirement until such time
as the Director of OFHEO determines that the requirement should be modified or allowed to expire,
taking into account factors such as the resolution of accounting and internal control issues. For a
description of our statutory minimum capital requirement and OFHEO-directed minimum capital
requirement, see “Capital Adequacy Requirements.”
• We must seek the approval of the Director of OFHEO before engaging in any transaction that could have
the effect of reducing our capital surplus below an amount equal to 30% more than our statutory
minimum capital requirement.
• We must submit a written report to OFHEO detailing the rationale and process for any proposed capital
distribution before making such distribution.
• We are not permitted to increase the amount of our mortgage portfolio assets above a specified amount,
except in limited circumstances at the discretion of OFHEO.
Under the OFHEO consent order, we were initially restricted from increasing our net mortgage portfolio assets
above $727.75 billion. In September 2007, OFHEO issued an interpretation of the consent order revising the
mortgage portfolio cap so that it is no longer based on the amount of our “net mortgage portfolio assets,”
which reflects adjustments under U.S. generally accepted accounting principles (“GAAP”). The mortgage
portfolio cap is now compared to our “average monthly mortgage portfolio balance.” Our “average monthly
mortgage portfolio balance” is the cumulative average of the month-end unpaid principal balances of our
mortgage portfolio (as defined and reported in our Monthly Summary Report, a monthly statistical report on
our business activity, which we file with the SEC in a current report on Form 8-K) for the previous 12-month
period. Through June 2008, however, the reporting period will begin with and include July 2007 and end with
the month covered by the current Monthly Summary Report. This measure is a statistical measure rather than
an amount computed in accordance with GAAP, and excludes both consolidated mortgage-related assets
acquired through the assumption of debt and the impact on the unpaid principal balances recorded on our
purchases of seriously delinquent loans from MBS trusts pursuant to Statement of Position No. 03-3,
Accounting for Certain Loans or Debt Securities Acquired in a Transfer. For purposes of this calculation,
OFHEO’s interpretation sets the July 2007 month-end portfolio balance at $725 billion. In addition, any net
increase in delinquent loan balances in our portfolio after September 30, 2007 will be excluded from the
month-end portfolio balance.
The mortgage portfolio cap was set at $735 billion for the third quarter of 2007 and $742.35 billion for the
fourth quarter of 2007. For each subsequent quarter, the mortgage portfolio cap increases by 0.5%, not to
exceed 2% per year. The mortgage portfolio cap is currently set at $746 billion for the first quarter of 2008.
Our “average monthly mortgage portfolio balance” as of December 31, 2007 was $725.3 billion, which was
$17.1 billion below our applicable portfolio limit of $742.35 billion.
In its Fiscal Year 2007 Performance and Accountability Report, released November 15, 2007, OFHEO
recognized that we had complied with 88% of the requirements of the OFHEO consent order. With the filing
of this Form 10-K, we believe that we are in compliance with all 81 requirements of the OFHEO consent
order.
Capital Adequacy Requirements
We are subject to capital adequacy requirements established by the 1992 Act. The statutory capital framework
incorporates two different quantitative assessments of capital—a minimum capital requirement and a risk-
based capital requirement. The minimum capital requirement is ratio-based, while the risk-based capital
17
23. requirement is based on simulated stress test performance. The 1992 Act requires us to maintain sufficient
capital to meet both of these requirements in order to be classified as “adequately capitalized.”
OFHEO is permitted or required to take remedial action if we fail to meet our capital requirements, depending
upon which requirement we fail to meet. If OFHEO classifies us as significantly undercapitalized, we would
be required to submit a capital restoration plan and would be subject to additional restrictions on our ability to
make capital distributions. OFHEO has the ability to take additional supervisory actions if the Director
determines that we have failed to make reasonable efforts to comply with that plan or are engaging in
unapproved conduct that could result in a rapid depletion of our core capital, or if the value of the property
securing mortgage loans we hold or have securitized has decreased significantly. The 1992 Act also gives
OFHEO the authority, after following prescribed procedures, to appoint a conservator. Under OFHEO’s
regulations, appointment of a conservator is mandatory, with limited exceptions, if we are critically
undercapitalized. OFHEO has discretion under its rules to appoint a conservator if we are significantly
undercapitalized and alternative remedies are unavailable. The 1992 Act and OFHEO’s rules also specify other
grounds for appointing a conservator.
Statutory Minimum Capital Requirement and OFHEO-directed Minimum Capital Requirement. OFHEO’s
ratio-based minimum capital standard ties our capital requirements to the size of our book of business. For
purposes of the statutory minimum capital requirement, we are in compliance if our core capital equals or
exceeds our statutory minimum capital requirement. Core capital is defined by statute as the sum of the stated
value of outstanding common stock (common stock less treasury stock), the stated value of outstanding non-
cumulative perpetual preferred stock, paid-in capital and retained earnings, as determined in accordance with
GAAP. Our statutory minimum capital requirement is generally equal to the sum of:
• 2.50% of on-balance sheet assets;
• 0.45% of the unpaid principal balance of outstanding Fannie Mae MBS held by third parties; and
• up to 0.45% of other off-balance sheet obligations, which may be adjusted by the Director of OFHEO
under certain circumstances.
Our consent order with OFHEO requires us to maintain a 30% capital surplus over our statutory minimum
capital requirement. We refer to this requirement as the “OFHEO-directed minimum capital requirement.”
Each quarter, as part of its capital classification announcement, OFHEO publishes our standing relative to the
statutory minimum capital requirement and the OFHEO-directed minimum capital requirement. For a
description of the amounts by which our core capital exceeded our statutory minimum capital requirement and
OFHEO-directed minimum capital requirement as of December 31, 2007 and December 31, 2006, see
“Part II—Item 7—MD&A—Liquidity and Capital Management—Capital Management—Capital Classification
Measures.”
Statutory Risk-Based Capital Requirement. OFHEO’s risk-based capital requirement ties our capital
requirements to the risk in our book of business, as measured by a stress test model. The stress test simulates
our financial performance over a ten-year period of severe economic conditions characterized by both extreme
interest rate movements and high mortgage default rates. Simulation results indicate the amount of capital
required to survive this prolonged period of economic stress without new business or active risk management
action. In addition to this model-based amount, the risk-based capital requirement includes a 30% surcharge to
cover unspecified management and operations risks.
Our total capital base is used to meet our risk-based capital requirement. Total capital is defined by statute as
the sum of our core capital plus the total allowance for loan losses and reserve for guaranty losses in
connection with Fannie Mae MBS, less the specific loss allowance (that is, the allowance required on
individually-impaired loans). Each quarter, OFHEO runs a detailed profile of our book of business through the
stress test simulation model. The model generates cash flows and financial statements to evaluate our risk and
measure our capital adequacy during the ten-year stress horizon. As part of its quarterly capital classification
announcement, OFHEO makes these stress test results publicly available. For a description of the amounts by
which our total capital exceeded our statutory risk-based capital requirement as of December 31, 2007 and
18
24. 2006, see “Part II—Item 7—MD&A—Liquidity and Capital Management—Capital Management—Capital
Classification Measures.”
In October 2007, OFHEO announced a proposed rule that would change the mortgage loan loss severity
formulas used in the regulatory risk-based capital stress test. If adopted, the proposed changes would increase
our risk-based capital requirement. Using data from the third and fourth quarters of 2006, OFHEO’s
recalculation of the risk-based capital requirement for those periods using the proposed formulas showed that
our total capital base would continue to exceed the revised risk-based capital requirements.
Statutory Critical Capital Requirement. Our critical capital requirement is the amount of core capital below
which we would be classified as critically undercapitalized and generally would be required to be placed in
conservatorship. Our critical capital requirement is generally equal to the sum of:
• 1.25% of on-balance sheet assets;
• 0.25% of the unpaid principal balance of outstanding Fannie Mae MBS held by third parties; and
• up to 0.25% of other off-balance sheet obligations, which may be adjusted by the Director of OFHEO
under certain circumstances.
For a description of the amounts by which our core capital exceeded our statutory critical capital requirement
as of December 31, 2007 and 2006, see “Part II—Item 7—MD&A—Liquidity and Capital Management—
Capital Management—Capital Classification Measures.”
OFHEO Direction on Interagency Guidance on Nontraditional Mortgages and Subprime Lending
In September 2006 and June 2007, five federal financial regulatory agencies jointly issued guidance on risks
posed by nontraditional mortgage products (that is, mortgage products that allow borrowers to defer repayment
of principal or interest) and by subprime mortgages. The interagency guidance directed regulated financial
institutions that originate nontraditional and subprime mortgage loans to follow prudent lending practices,
including following safe and sound underwriting practices and providing borrowers with clear and balanced
information about the relative benefits and risks of these products sufficiently early in the process to enable
them to make informed decisions. OFHEO directed us to apply the risk management, underwriting and
consumer protection principles of the interagency guidance to the mortgage loans and mortgage-related
securities that we acquire for our portfolio and for securitization into Fannie Mae MBS. Accordingly, we have
made changes to our underwriting standards implementing the interagency guidance.
Recent Legislative Developments and Possible Changes in Our Regulations and Oversight
In February 2008, Congress passed legislation that temporarily increases the conforming loan limit in high-
cost metropolitan areas for loans originated between July 1, 2007 and December 31, 2008. For a one-family
residence, the loan limit increased to 125% of the area’s median house price, up to a maximum of 175% of
the otherwise applicable loan limit. The Securities Industry and Financial Markets Association has initially
determined that mortgage-related securities backed by these “jumbo conforming” loans are not eligible to be
traded in the TBA market. The TBA, or “to be announced,” securities market is a forward, or delayed delivery,
market for mortgage-related securities backed by 30-year and 15-year single-family mortgage loans issued by
us and other agency issuers. Most of our single-class, single-family Fannie Mae MBS are sold by lenders in
the TBA market. Accordingly, the inability of mortgage-related securities backed by jumbo conforming
mortgages to trade in this market may limit the liquidity of these securities and make the execution less
favorable. In addition, we will be required to implement changes to our systems in order to be able to acquire
and securitize jumbo conforming loans, particularly due to the variation in the conforming loan limit by
metropolitan statistical area.
There is legislation pending before the U.S. Congress that would change the regulatory framework under
which we, Freddie Mac and the Federal Home Loan Banks operate. On May 22, 2007, the House of
Representatives approved a bill that would establish a new, independent regulator for us and the other GSEs,
with broad authority over both safety and soundness and mission.
19
25. As of the date of this filing, one GSE reform bill has been introduced in the Senate and another is expected.
For a description of how the changes in the regulation of our business contemplated by these GSE reform bills
and other legislative proposals could materially adversely affect our business and earnings, see “Item 1A—
Risk Factors.”
EXECUTIVE OFFICERS
Our current executive officers are listed below. They have provided the following information about their
principal occupation, business experience and other matters.
Daniel H. Mudd, 49, has served as President and Chief Executive Officer of Fannie Mae since June 2005.
Mr. Mudd previously served as Vice Chairman of Fannie Mae’s Board of Directors and interim Chief Executive
Officer, from December 2004 to June 2005, and as Vice Chairman and Chief Operating Officer from February
2000 to December 2004. Prior to his employment with Fannie Mae, Mr. Mudd was President and Chief
Executive Officer of GE Capital, Japan, a diversified financial services company and a wholly-owned subsidiary
of the General Electric Company, from April 1999 to February 2000. He also served as President of GE Capital,
Asia Pacific, from May 1996 to June 1999. Mr. Mudd has served as a director of the Fannie Mae Foundation
since March 2000, serving as Chairman since June 2005, interim Chairman from December 2004 to June 2005,
and Vice Chairman from September 2003 to December 2004. Mr. Mudd serves as a director of Fortress
Investment Group LLC. Mr. Mudd has been a Fannie Mae director since February 2000.
Kenneth J. Bacon, 53, has been Executive Vice President—Housing and Community Development since
July 2005. He was interim head of Housing and Community Development from January 2005 to July 2005.
He was Senior Vice President—Multifamily Lending and Investment from May 2000 to January 2005, and
Senior Vice President—American Communities Fund from October 1999 to May 2000. From August 1998 to
October 1999 he was Senior Vice President of the Community Development Capital Corporation. He was
Senior Vice President of Fannie Mae’s Northeastern Regional Office in Philadelphia from May 1993 to August
1998. Mr. Bacon has served as a director of the Fannie Mae Foundation since January 1995 and as Vice
Chairman since January 2005. Mr. Bacon is also a director of Comcast Corporation and the Corporation for
Supportive Housing. He is a member of the Executive Leadership Council and the Real Estate Round Table.
Enrico Dallavecchia, 46, has been Executive Vice President and Chief Risk Officer since June 2006. Prior to
joining Fannie Mae, Mr. Dallavecchia was with JP Morgan Chase, where he served as Head of Market Risk for
Retail Financial Services, Chief Investment Office and Asset Wealth Management from April 2005 to May 2006
and as Market Risk Officer for Global Treasury, Retail Financial Services, Credit Cards and Proprietary
Positioning Division and Co-head of Market Risk Technology from December 1998 to March 2005.
Linda K. Knight, 58, has been Executive Vice President—Enterprise Operations since April 2007. Prior to her
present appointment, Ms. Knight served as Executive Vice President—Capital Markets from March 2006 to
April 2007. Before that, Ms. Knight served as Senior Vice President and Treasurer from February 1993 to
March 2006, and Vice President and Assistant Treasurer from November 1986 to February 1993. Ms. Knight
held the position of Director, Treasurer’s Office from November 1984 to November 1986, and Assistant
Director, Treasurer’s Office from February 1984 to November 1984. Ms. Knight joined Fannie Mae in August
1982 as a senior market analyst.
Robert J. Levin, 52, has been Executive Vice President and Chief Business Officer since November 2005.
Mr. Levin was Fannie Mae’s interim Chief Financial Officer from December 2004 to January 2006. Prior to
that position, Mr. Levin was the Executive Vice President of Housing and Community Development from June
1998 to December 2004. From June 1990 to June 1998, he was Executive Vice President—Marketing.
Mr. Levin joined Fannie Mae in 1981. Mr. Levin has previously served as a director and as treasurer of the
Fannie Mae Foundation.
Thomas A. Lund, 49, has been Executive Vice President—Single-Family Mortgage Business since July 2005.
He was interim head of Single-Family Mortgage Business from January 2005 to July 2005 and Senior Vice
President—Chief Acquisitions Office from January 2004 to January 2005. Mr. Lund served as Senior Vice
President—Investor Channel from August 2000 to January 2004, Senior Vice President—Southwestern
20