Download to read offline
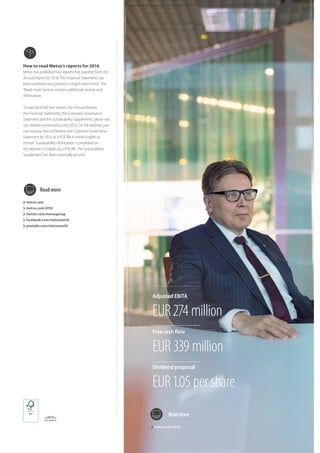
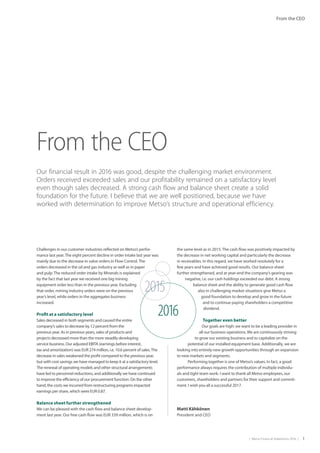

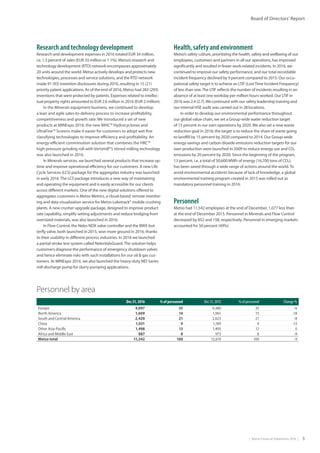
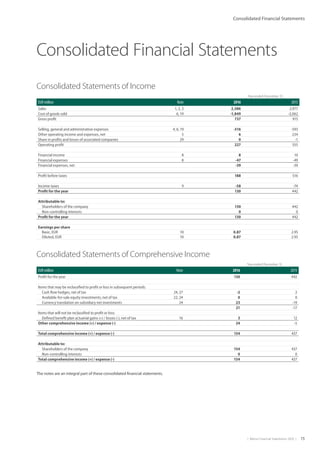
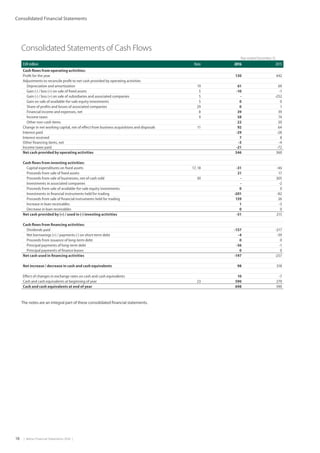
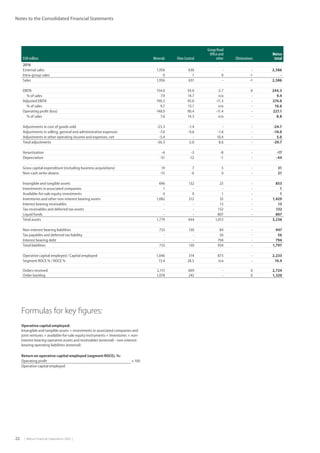
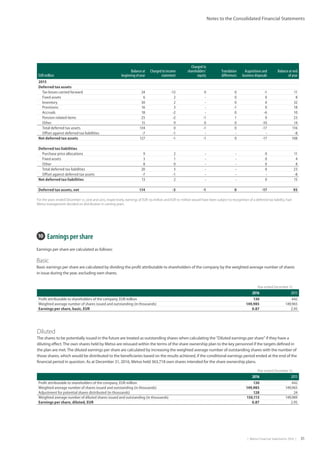
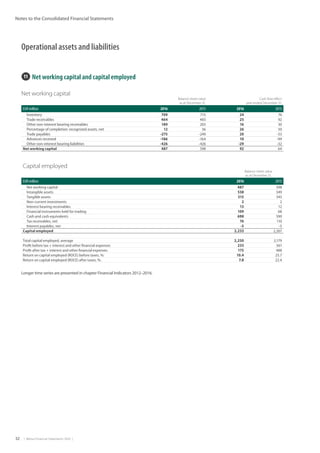
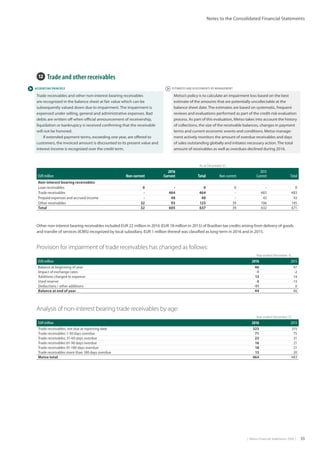
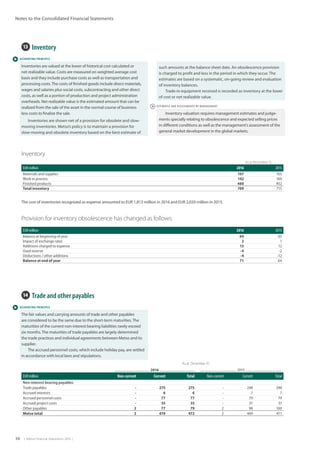
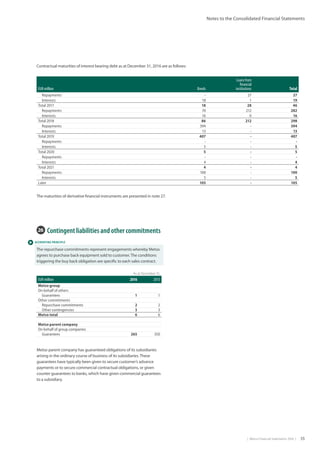


Metso's 2016 financial report indicates a challenging market environment with an 8% decline in order intake primarily due to decreased demand in the oil and gas and mining sectors. Despite a 12% drop in sales, profitability was maintained at satisfactory levels, and free cash flow remained consistent at EUR 339 million, enhancing the company's balance sheet. The report highlights ongoing efforts to optimize operational efficiency and implies a focus on future growth opportunities.


![[ls머트리얼즈]LS Materials 417200 Algorithm Investment Report](https://cdn.slidesharecdn.com/ss_thumbnails/lsmaterials417200algorithminvestmentreport-260202182715-66072c7b-thumbnail.jpg?width=640&height=640&fit=bounds)
