Download to read offline
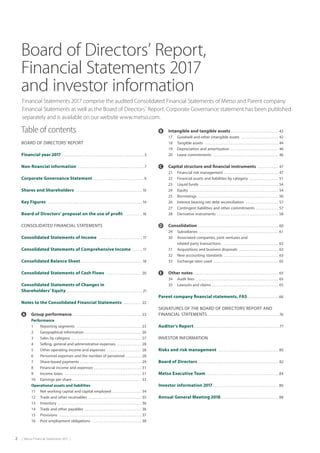
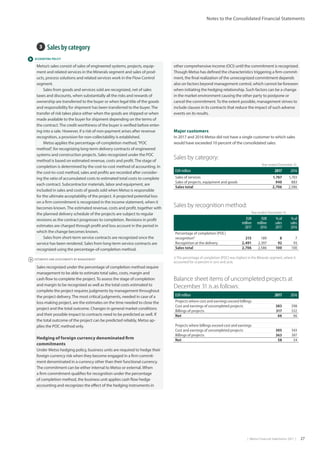
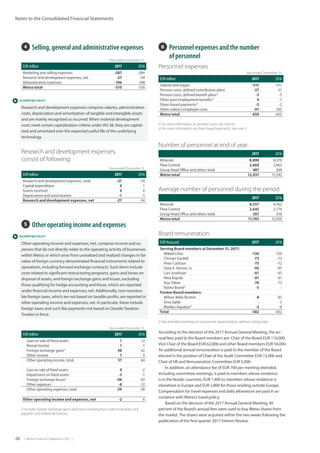
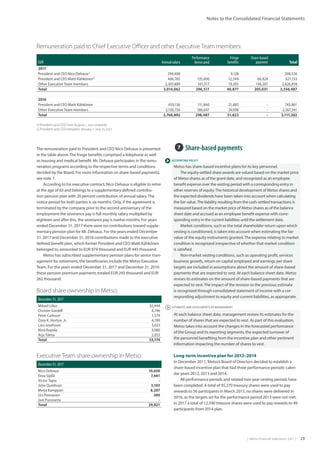
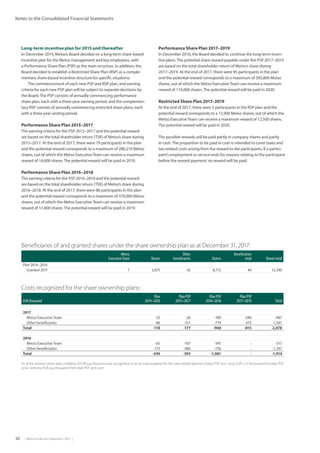
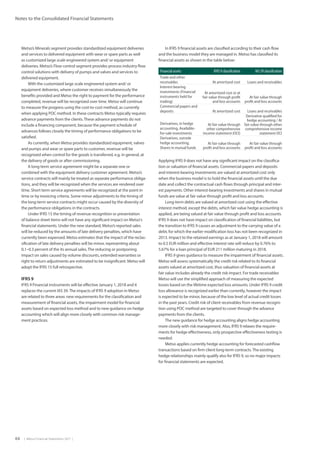
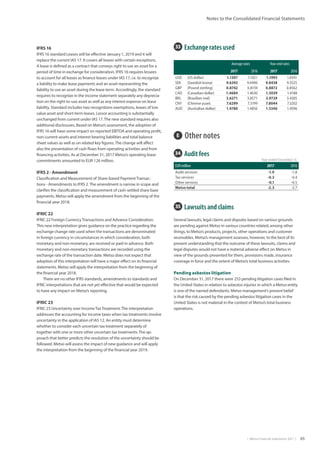
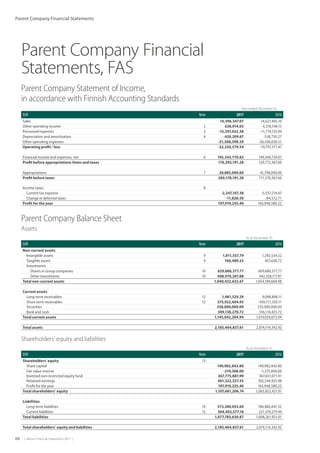


This document contains Metso's annual financial statements and Board of Directors' report for 2017. It includes four sections - the Board of Directors' report, consolidated financial statements, parent company financial statements under Finnish accounting standards, and investor information. The Board report indicates orders and sales grew in 2017 but profitability declined due to challenges in mining projects and ramping up services. A new organizational structure with 7 business areas was implemented. The consolidated financial statements provide details on Metso's financial performance for 2017 including segment reporting, income statements, balance sheets, cash flows, and notes on accounting policies. The parent company financial statements are prepared according to Finnish accounting standards. The investor information section covers risks, governance


