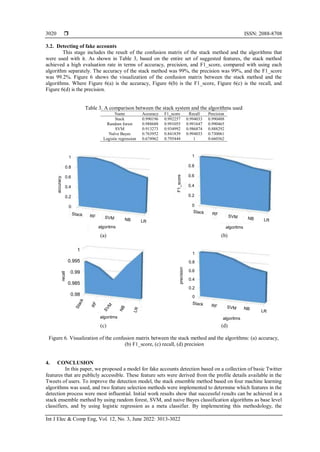
The document discusses a stack ensemble system designed to detect fake accounts on Twitter using machine learning algorithms, achieving an accuracy of 99%. It outlines methods for data preprocessing, feature extraction through Spearman correlation and chi-square tests, and employs random forest, support vector machine, and naive bayes algorithms with logistic regression as a meta-classifier. The study demonstrates that the ensemble approach improves prediction accuracy compared to individual algorithms.
![International Journal of Electrical and Computer Engineering (IJECE)
Vol. 12, No. 3, June 2022, pp. 3013~3022
ISSN: 2088-8708, DOI: 10.11591/ijece.v12i3.pp3013-3022 3013
Journal homepage: http://ijece.iaescore.com
Fake accounts detection on social media using stack ensemble
system
Amna Kadhim Ali, Abdulhussein Mohsin Abdullah²
Department of Computer Science, College of Computer Science and Information Technology, University of Basrah, Basrah, Iraq
Article Info ABSTRACT
Article history:
Received Mar 6, 2021
Revised Jan 4, 2022
Accepted Jan 21, 2022
In today’s world, social media has spread widely, and the social life of
people have become deeply associated with social media use. They use it to
communicate with each other, share events and news, and even run
businesses. The huge growth in social media and the massive number of
users has lured attackers to distribute harmful content through fake accounts,
leading to a large number of people falling victim to those accounts. In this
work, we propose a mechanism for identifying fake accounts on the social
media site Twitter by using two methods to preprocess data and extract the
most effective features, they are the spearman correlation coefficient and the
chi-square test. For classification, we used supervised machine learning
algorithms based on the ensemble system (stack method) by using random
forest, support vector machine, and naive Bayes algorithms in the first level
of the stack, and the logistic regression algorithm as a meta classifier. The
stack ensemble system was shown to be effective in achieving the best
results when compared to the algorithms used with it, with data accuracy
reaching 99%.
Keywords:
Classification
Combining system
Feature selection techniques
Machine learning
Twitter accounts
This is an open access article under the CC BY-SA license.
Corresponding Author:
Amna Kadhim Ali
Department of Computer Science, College of Computer Science and Information Technology, University
of Basrah
Basrah, Iraq
Email: amna.k.ali.itc.cs.p@uobasrah.edu.iq
1. INTRODUCTION
Social media use is becoming increasingly common, and it has become an essential part of daily life
around the world. Besides being a means of communication, it is also considered a means of gaining fame
and running a business. Social media sites are popular because of people’s interests in making friends,
posting pictures, tagging individuals in group photos, sharing their ideas and opinions on popular subjects,
maintaining good working relationships, and having a general interest in others.
Twitter is one of the social media platforms used for cooperation and communication between users.
It was initiated in 2006 [1], and in recent years, the number of users has reached millions. Users share short
messages, called tweets, of 140 characters or less, as well as pictures and videos, as the primary forms of
communication on the network. Regrettably, the emergence of social communication on Twitter has drawn
the attention of cybercriminals who leverage the trust between users to spread malicious content on the
network, resulting in a large number of victims. They create fake accounts [2] and use them to spread false
news or steal users’ accounts. Therefore, uncovering these accounts has become one of the major challenges
faced by social media sites at present [3].
A variety of methods have been proposed by researchers to classify fake accounts [4]–[6], some
using crowdsourcing [7] which rely on human effort to detect them, or using a graph [8], [9] by analyzing](https://image.slidesharecdn.com/8325201emr26oct6marf-220628062057-087535b1/85/Fake-accounts-detection-on-social-media-using-stack-ensemble-system-1-320.jpg)
![ ISSN: 2088-8708
Int J Elec & Comp Eng, Vol. 12, No. 3, June 2022: 3013-3022
3014
network contents or using machine learning algorithms to classify accounts depending on specific features.
Ersahin et al. [10] introduce a method of detecting fake accounts from the Twitter dataset using a
classification algorithm called Naive Bayes. The accuracy of the pre-processed dataset was increased by
using a supervised discretization technique called entropy minimization discretization (EMD), to reach a
90.9% accurate result.
Previous research [11] implemented a machine learning pipeline for online social networks to
identify fake accounts. The framework classified groups of fake accounts instead of creating a forecast for
each individual account to determine if they were generated by the same person. Several classification
algorithms have been proposed, such as support vector machine (SVM), random forest, and deep neural
network.
A previous study [12] examined the identification of Twitter spam accounts to enhance the initial
detection of spammer classes by incorporating both managed principal component analysis (PCA) and k-
mean algorithms. To detect spam on social networks, several existing features were adopted, and new
features were added to improve performance. Three classification algorithms, multi-layer perceptron (MLP),
support vector machine, and random forest, were trained. The best results were found using the random forest
algorithm, which had an accuracy of 96.30%.
Another previous study [13] identified fake Instagram accounts as a problem of binary classification
and proposed a cost-sensitive technique for reducing required features. The technique was based on a genetic
algorithm to pick the best attributes for automatic classification of computation, correct the variance using the
synthetic minority over-sampling technique-nominal continuous (SMOTE-NC) algorithm in a false
computation dataset, and evaluate multiple methods of pattern recognition on pooled datasets. Ultimately,
with a rating of 86%, the support vector machine and neural network-based techniques achieved the highest
F1 score for robotic computing detection, and the neural network achieved the best F1 rating at 95%. In this
paper, spearman's correlation coefficient and the chi-square test were used to preprocess Twitter data to find
the best qualities for distinguishing between fake and real accounts [14], and the min-max normalization
method to scale the data between (0, 1). For data classification, we used machine learning algorithms based
on the stack ensemble system to increase the predictive strength of the algorithms and achieve the highest
accuracy in data classification.
2. RESEARCH METHOD
This section discusses the suggested method for detecting fake accounts on social media and
contains six basic steps. They are; dataset collection, data cleaning, features extraction and selection, data
scaling, a classification stage depending on the ensemble system (stack method), and an evaluation and
comparison stage. Figure 1 shows the phases of the technique adopted.
Figure 1. The steps of the technique adopted for the detection process
Twitter data collection
Data cleaning
Feature extraction and selection
Data scaling
Training data Testing data
Random Forest SVM Naïve Bayes
Evaluatin
&
comparison
Stack
ensemble
system
prediction
Logistic Regression
Real Fake](https://image.slidesharecdn.com/8325201emr26oct6marf-220628062057-087535b1/85/Fake-accounts-detection-on-social-media-using-stack-ensemble-system-2-320.jpg)
![Int J Elec & Comp Eng ISSN: 2088-8708
Fake accounts detection on social media using stack ensemble system (Amna Kadhim Ali)
3015
2.1. Twitter data collection
The Management Information Base "MIB" dataset [15] is used in this research, consisting of five
datasets obtained from Twitter, two of them represent real accounts and three of them are fake accounts. The
sum of all accounts is 5,301 with 29 features. They can be explained: i) the fake project (TFP) consists of 469
real accounts, ii) elections 2013 (E13) consist of 1,481 real accounts, iii) fastfollowerz dataset consist of
1,169 fake accounts, iv) InterTwitter dataset consist of 1,337 fake accounts, and v) Twitter technology
dataset consist of 845 fake accounts.
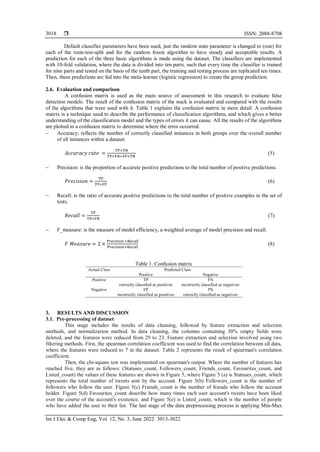
2.2. Data cleaning
During the data collection process, some errors occur that lead to the loss of some data. This
problem leads to a decrease in the quality of the data and thus leads to low-quality results when analyzing
and exploring them. Our grouped data contains several blank fields, as shown in Figure 2, where the yellow
color denotes the empty fields. Keeping these empty fields negatively affects the classification process and
leads to inaccurate results, so this stage includes removing the columns of features that contain 30% or more
blank fields [16].
Figure 2. All features
2.3. Feature extraction and selection
Feature extraction is used to determine the optimal subset of features for model creation by
eliminating inappropriate or redundant features, thereby concentrating only on necessary features. The
purpose of this strategy is to minimize the training time for the prediction model by reducing
over-processing, to improve the model's generalizability, and to help researchers interpret the model. In the
proposed research, two methods are used to select the best features. These methods are:
2.3.1. Spearman rank correlation
Spearman correlation coefficient is one of the filtering methods used for feature selection [17],
which tests the intensity and orientation of the monotonic association between two quantitative variables.
They have values ranging from (-1) to (+1) to show the correlation degree. When the two variables are
independent, each correlation measure is entirely zero. The result of spearman is a table that contains the
correlation coefficients that link each variable in the dataset to the other variables. The following formula is
employed to calculate the spearman rank correlation:
𝑆 = 1 − (
6 ∑ d𝒾s2
m(m2−1)
) (1)
where S=spearman rank correlation, dis=represents the distinction between the respective variable ranks,
m=number of observations.](https://image.slidesharecdn.com/8325201emr26oct6marf-220628062057-087535b1/85/Fake-accounts-detection-on-social-media-using-stack-ensemble-system-3-320.jpg)
![ ISSN: 2088-8708
Int J Elec & Comp Eng, Vol. 12, No. 3, June 2022: 3013-3022
3016
2.3.2. Chi-square test
The chi-square test is one of the statistical methods used to verify the independence of two
events [18]. Whenever the two features are independent, the calculated chi-value is small compared to the
critical chi value, meaning a large calculated chi-square value disproves the hypothesis of independence.
A large chi-square value indicates which feature is dependent on the response and can be used for model
training. The chi square formula is:
x2
𝑒 = ∑
(Oᵢ−Eᵢ)²
Eᵢ
(2)
where e=degree of freedom, O=observed value(s), E=expected value(s).
First, the spearman correlation coefficient is used to find the correlation between all the features,
whether numerical or qualitative, depending on the data rank, and extract only the correlated features. After
applying spearman's correlation coefficient, two features of the remaining dataset contain empty fields. They
are; default_profile and background_image. These features must be configured to use the statistical
chi-square test. To fill in these fields, the number of current values for the columns is calculated, and the
most common value was chosen to fill in the empty fields [19]. Then a chi-square test is implemented on
spearman's output to find the correlation between the features and the target (output), to choose the best
features that affect whether the account is fake or real to use in the classification process. The flow chart in
Figure 3 explains the feature extraction process.
Figure 3. Feature extraction flow chart
2.4. Data scaling (normalization)
Scaling of features is a technique used to normalize the range of individual data variables or
features. In this section, all numeric values in the selected features are listed between zero and one by using
Min-Max normalization to increase the processing speed. In Min-Max normalization, the minimum value of
the variable is converted to zero and the maximum value is converted to one, while the rest of the values are
converted to a decimal number between zero and one. The general formula is:
𝑣ʹ
=
v−minₐ
max ₐ− min ₐ
(𝑛𝑒𝑤_𝑚𝑎𝑥ₐ − 𝑛𝑒𝑤_𝑚𝑖𝑛ₐ) + 𝑛𝑒𝑤_𝑚𝑖𝑛ₐ (3)
whereas v= is an original value and v’=is the normalized value.
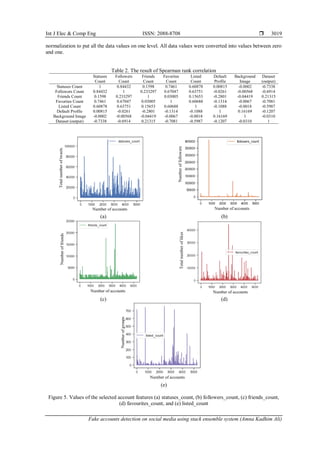
2.5. Detection model
We used the ensemble system by inserting features extracted from the datasets after normalizing
them into a stacking. Stacking is an ensemble learning method that combines several classifiers or regression
models through the meta-classifier or meta-regressor to improve predictive strength [20]. As shown in
Figure 4, based on a full training group, the basic-level models are trained, and then the meta-model is
trained on the model-like features of the basic level outputs. The algorithm below summarizes stacking.
Stacking Algorithm
Input: training data D={xᵢ, yᵢ}ᵢᵐ̳ₗ
Output: ensemble classifier H
Step 1: learn first-level classifiers
for t = 1 to T do
learn ht based on D
end for
Step 2: create a new prediction data set
New
feature set
after
cleaning
Extract the
correlation
between (all
features) by
using Spearman
Rank Correlation
Build a new
dataset from
correlated
features
Configure the
data use the
statistical Chi-
Square by filling
in the remaining
empty fields
Extract the
correlation
between (each
feature and the
target) by using
Chi-Square test
New
dataset](https://image.slidesharecdn.com/8325201emr26oct6marf-220628062057-087535b1/85/Fake-accounts-detection-on-social-media-using-stack-ensemble-system-4-320.jpg)
![Int J Elec & Comp Eng ISSN: 2088-8708
Fake accounts detection on social media using stack ensemble system (Amna Kadhim Ali)
3017
for i=1 to m do
Dₕ={xʹᵢ, yᵢ}, where xʹᵢ={h₁ (xᵢ),…., hT (xᵢ)}
end for
Step 3: learn a meta-classifier
learn H based on Dₕ
return H
Figure 4. Stack ensemble system
The most important characteristic of the stack method is that it can benefit from the performance of
a group of well-performing models in a classification or regression task and can provide better predictions
than any individual model in the group. In our research, a group of the most common algorithms are used,
four different learning techniques are trained and tested depending on the stack method. These algorithms
are:
2.5.1. Random forest algorithm
Random forest (RF) is a powerful machine learning algorithm that performs the tasks of
classification and regression [21], [22]. The basic building block of a random forest is derived from the
decision tree. The model is obtained by dividing the data into bootstrapping samples depending on the
number of trees that we want to perform, building a simple prediction model within each section, and
combining their outputs based on the bagging ensemble learning technique to get to the final prediction.
2.5.2. Support vector machine algorithm
Support vector machine (SVM) is one of the most popular supervised learning algorithms that finds
the optimal hyperplane, which separates the data points into two-component by maximizing the margin,
which represents the distance from the decision surface to the closest data point [23], [24]. SVM is effective
in cases where the number of dimensions is greater than the number of samples given.
2.5.3. Naïve Bayes algorithm
Naive Bayes (NB) is a type of classifier of probabilities. It works on the theory of Bayes and deals
with both categorical variables and continuous variables [25], [26]. NB assumes that each pair of labeled-
value features is independent of each other, meaning that the presence of any particular feature in a class is
unrelated to the presence of other features. The NB equation is:
𝑃 (𝐴𝐵) =
P (A) P(BA)
𝑃(B)
(4)
2.5.4. Logistic regression algorithm
Logistic regression (LR) is one of the machine learning algorithms used in binary classification [27].
It is a simple and commonly used algorithm that measures the relationship between one variable and many
dependent variables (which we want to predict). As it uses its logistic function to estimate probabilities, to
make a prediction, these probabilities must be converted into binary values, a task known as the sigmoid
function. The sigmoid function is a curve in the form of an S that takes any number of real values and places
them in the range between zero and one.
In the proposed method, the first level algorithms of the stack, including random forest, SVM, and
naive Bayes, are trained on the training set, a k-fold validation is performed on each of these learners [28],
and the validated expected values are collected from all the first level algorithms to use them as inputs to the
meta classifier (logistic regression). The same steps are used to generate predictions on the test set. The
accounts in the test suite are classified into real and fake accounts based on the training suite that is provided.
The data was divided into a training and test group by choosing 75% as training data and 25% as testing data
using stratified sampling [29] to ensure an equal division and maintain the same proportion of classes.](https://image.slidesharecdn.com/8325201emr26oct6marf-220628062057-087535b1/85/Fake-accounts-detection-on-social-media-using-stack-ensemble-system-5-320.jpg)
![Int J Elec & Comp Eng ISSN: 2088-8708
Fake accounts detection on social media using stack ensemble system (Amna Kadhim Ali)
3021
accuracy of the data reached 99%. The results also revealed that the ensemble system has a significantly
higher impact on the accuracy of the detection process over using each algorithm separately. For future work,
much larger data could be collected using the same methodology as this work but using other machine
learning algorithms.
REFERENCES
[1] S. Edosomwan, S. K. Prakasan, D. Kouame, J. Watson, and T. Seymour, “The history of social media and its impact on business,”
The Journal of Applied Management and Entrepreneurship, vol. 16, no. 3, pp. 79–91, 2011.
[2] D. Yuan et al., “Detecting fake accounts in online social networks at the time of registrations,” in Proceedings of the 2019 ACM
SIGSAC Conference on Computer and Communications Security, Nov. 2019, pp. 1423–1438, doi: 10.1145/3319535.3363198.
[3] R. Kaur and S. Singh, “A survey of data mining and social network analysis based anomaly detection techniques,” Egyptian
Informatics Journal, vol. 17, no. 2, pp. 199–216, Jul. 2016, doi: 10.1016/j.eij.2015.11.004.
[4] M. Al-Qurishi, M. Al-Rakhami, A. Alamri, M. Alrubaian, S. M. M. Rahman, and M. S. Hossain, “Sybil defense techniques in
online social networks: a survey,” IEEE Access, vol. 5, pp. 1200–1219, 2017, doi: 10.1109/ACCESS.2017.2656635.
[5] K. Anand, J. Kumar, and K. Anand, “Anomaly detection in online social network: a survey,” in 2017 International Conference on
Inventive Communication and Computational Technologies (ICICCT), Mar. 2017, pp. 456–459, doi:
10.1109/ICICCT.2017.7975239.
[6] F. Masood et al., “Spammer detection and fake user identification on social networks,” IEEE Access, vol. 7, pp. 68140–68152,
2019, doi: 10.1109/ACCESS.2019.2918196.
[7] G. Wang et al., “Serf and turf: crowdturfing for fun and profit,” in Proceedings of the 21st international conference on World
Wide Web - WWW ’12, Nov. 2011, pp. 679–688, doi: 10.1145/2187836.2187928.
[8] M. Mohammadrezaei, M. E. Shiri, and A. M. Rahmani, “Identifying fake accounts on social networks based on graph analysis
and classification algorithms,” Security and Communication Networks, vol. 2018, pp. 1–8, Aug. 2018, doi:
10.1155/2018/5923156.
[9] M. BalaAnand, N. Karthikeyan, S. Karthik, R. Varatharajan, G. Manogaran, and C. B. Sivaparthipan, “An enhanced graph-based
semi-supervised learning algorithm to detect fake users on Twitter,” The Journal of Supercomputing, vol. 75, no. 9,
pp. 6085–6105, Sep. 2019, doi: 10.1007/s11227-019-02948-w.
[10] B. Ersahin, O. Aktas, D. Kilinc, and C. Akyol, “Twitter fake account detection,” in 2017 International Conference on Computer
Science and Engineering (UBMK), Oct. 2017, pp. 388–392, doi: 10.1109/UBMK.2017.8093420.
[11] G. A, Radhika S, and Jayalakshmi S. L., “Detecting fake accounts in media application using machine learning,” International
Journal of Advanced Networking and Applications (IJANA), pp. 234–237.
[12] K. S. Adewole, T. Han, W. Wu, H. Song, and A. K. Sangaiah, “Twitter spam account detection based on clustering and
classification methods,” The Journal of Supercomputing, vol. 76, no. 7, pp. 4802–4837, Jul. 2020, doi: 10.1007/s11227-018-2641-
x.
[13] F. C. Akyon and M. E. Kalfaoglu, “Instagram fake and automated account detection,” 2019 Innovations in Intelligent Systems and
Applications Conference (ASYU), 2019, pp. 1-7, doi: 10.1109/ASYU48272.2019.8946437.
[14] A. El Azab, A. M. Idrees, M. A. Mahmoud, and H. Hefny, “Fake account detection in Twitter based on minimum weighted
feature set,” International Journal of Computer, Electrical, Automation, Control and Information Engineering, vol. 10, no. 1,
pp. 13–18, 2016, doi: 10.5281/zenodo.1110582.
[15] S. Cresci, R. Di Pietro, M. Petrocchi, A. Spognardi, and M. Tesconi, “Fame for sale: efficient detection of fake Twitter
followers,” Decision Support Systems, vol. 80, pp. 56–71, Sep. 2015, doi: 10.1016/j.dss.2015.09.003.
[16] J. Clavel, G. Merceron, and G. Escarguel, “Missing data estimation in morphometrics: how much is too much?,” Systematic
Biology, vol. 63, no. 2, pp. 203–218, Mar. 2014, doi: 10.1093/sysbio/syt100.
[17] Ms. K. Nagalakshmi, M. P. Nanthini, M. A. Saranya, and Mrs. B. Revathi, “Detect fake identities using machine learning,” SSRG
International Journal of Computer Science and Engineering (SSRG – IJCSE), pp. 80–84, 2019.
[18] I. S. Thaseen, C. A. Kumar, and A. Ahmad, “Integrated intrusion detection model using chi-square feature selection and ensemble
of classifiers,” Arabian Journal for Science and Engineering, vol. 44, no. 4, pp. 3357–3368, Apr. 2019, doi: 10.1007/s13369-018-
3507-5.
[19] O. Olasehinde and K. Williams, “A machine learning framework for improving classification accuracy using stacked ensemble a
machine learning framework for improving classification accuracy using stacked ensemble,” ISTEAMS Multidisciplinary
Conference AlHikmah University. Ilorin, 2018.
[20] K. R. Purba, D. Asirvatham, and R. K. Murugesan, “Classification of Instagram fake users using supervised machine learning
algorithms,” International Journal of Electrical and Computer Engineering (IJECE), vol. 10, no. 3, pp. 2763–2772, Jun. 2020,
doi: 10.11591/ijece.v10i3.pp2763-2772.
[21] P. Bharadwaj and Z. Shao, “Fake news detection with semantic features and text mining,” International Journal on Natural
Language Computing, vol. 8, no. 3, pp. 17–22, Jun. 2019, doi: 10.5121/ijnlc.2019.8302.
[22] S. Y. Wani, M. M. Kirmani, and S. I. Ansarulla, “Prediction of fake profiles on Facebook using supervised machine learning
techniques-a theoretical model,” International Journal of Computer Science and Information Technologies (IJCSIT), vol. 7, no. 4,
pp. 1735–1738, 2016.
[23] L. K. Ramasamy, S. Kadry, Y. Nam, and M. N. Meqdad, “Performance analysis of sentiments in Twitter dataset using SVM
models,” International Journal of Electrical and Computer Engineering (IJECE), vol. 11, no. 3, pp. 2275–2284, Jun. 2021, doi:
10.11591/ijece.v11i3.pp2275-2284.
[24] H. A. Santoso, E. H. Rachmawanto, and U. Hidayati, “Fake Twitter account classification of fake news spreading using Naive
Bayes,” Scientific Journal of Informatics, vol. 7, no. 2, pp. 228–237, 2020.
[25] M. M. Saritas, “Performance analysis of ANN and naive Bayes classification algorithm for data classification,” International
Journal of Intelligent Systems and Applications in Engineering, vol. 7, no. 2, pp. 88–91, Jan. 2019, doi:
10.18201/ijisae.2019252786.
[26] I. Aydin, M. Sevi, and M. U. Salur, “Detection of fake Twitter accounts with machine learning algorithms,” in 2018 International
Conference on Artificial Intelligence and Data Processing (IDAP), Sep. 2018, pp. 1–4, doi: 10.1109/IDAP.2018.8620830.
[27] D. Berrar, “Cross-validation,” in Encyclopedia of Bioinformatics and Computational Biology, vol. 1–3, Elsevier, 2019,
pp. 542–545.
[28] J. Kaiser, “Dealing with missing values in data,” Journal of Systems Integration, pp. 42–51, 2014, doi: 10.20470/jsi.v5i1.178.](https://image.slidesharecdn.com/8325201emr26oct6marf-220628062057-087535b1/85/Fake-accounts-detection-on-social-media-using-stack-ensemble-system-9-320.jpg)
![ ISSN: 2088-8708
Int J Elec & Comp Eng, Vol. 12, No. 3, June 2022: 3013-3022
3022
[29] A. M. Al-Zoubi, J. Alqatawna, and H. Paris, “Spam profile detection in social networks based on public features,” in 2017 8th
International Conference on Information and Communication Systems (ICICS), Apr. 2017, pp. 130–135, doi:
10.1109/IACS.2017.7921959.
BIOGRAPHIES OF AUTHORS
Amna Kadhim Ali received a B.Sc. in Computer Science in 2006 from the
University of Basrah, Iraq. Now, she is a student pursuing a master's degree in Artificial
Intelligence at the University of Basrah, Basrah, Iraq. She can be contacted by email:
amna.k.ali.itc.cs.p@uobasrah.edu.iq.
Abdulhussein M. Abdullah Professor at the University of Basrah, Basrah, Iraq.
He received an MSc in Computer Science in 1990 and a PhD degree from the University of
Basrah, Iraq in 2001. His areas of interest include Speech Recognition, the Semantic Web,
Image Processing, and Machine Learning. He can be contacted by email:
abduihussein.abdullah@uobasrah.edu.iq.](https://image.slidesharecdn.com/8325201emr26oct6marf-220628062057-087535b1/85/Fake-accounts-detection-on-social-media-using-stack-ensemble-system-10-320.jpg)