Download as PDF, PPTX


![3–Advertising market in the UK–A duopoly?
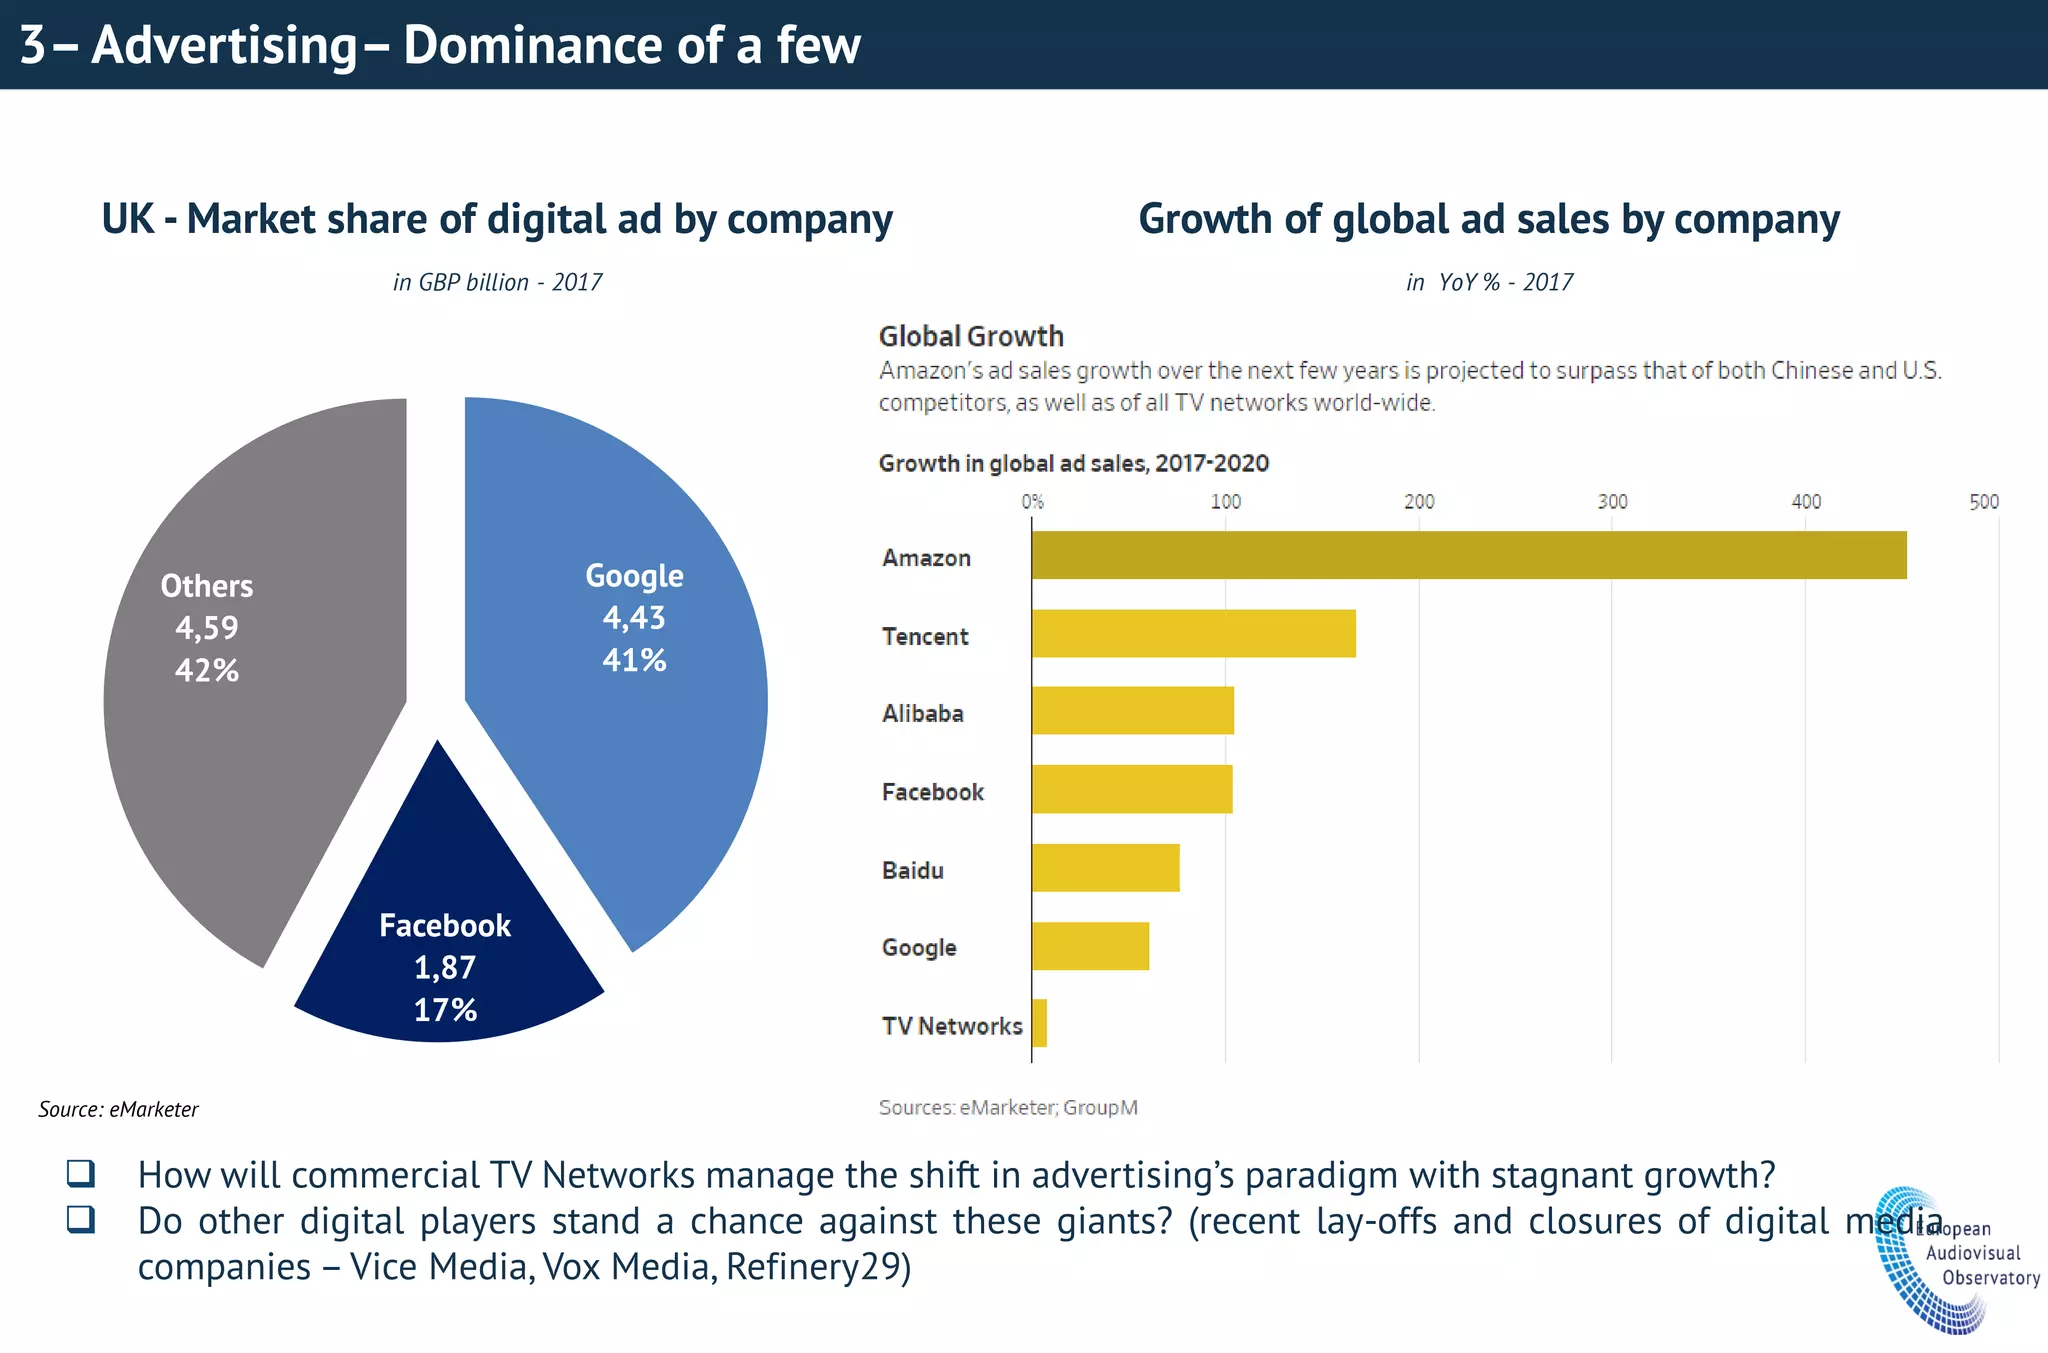
2 players who capture enormous amount of consumers’ time (attention) and data have
emerged as winners – Google and Facebook. Global market share (excl. China) of digital
advertising in 2017 of 84% [and 58% in the UK] (GroupM)
Amazon, who has consumer data and purchase history, making a play also on the ad market
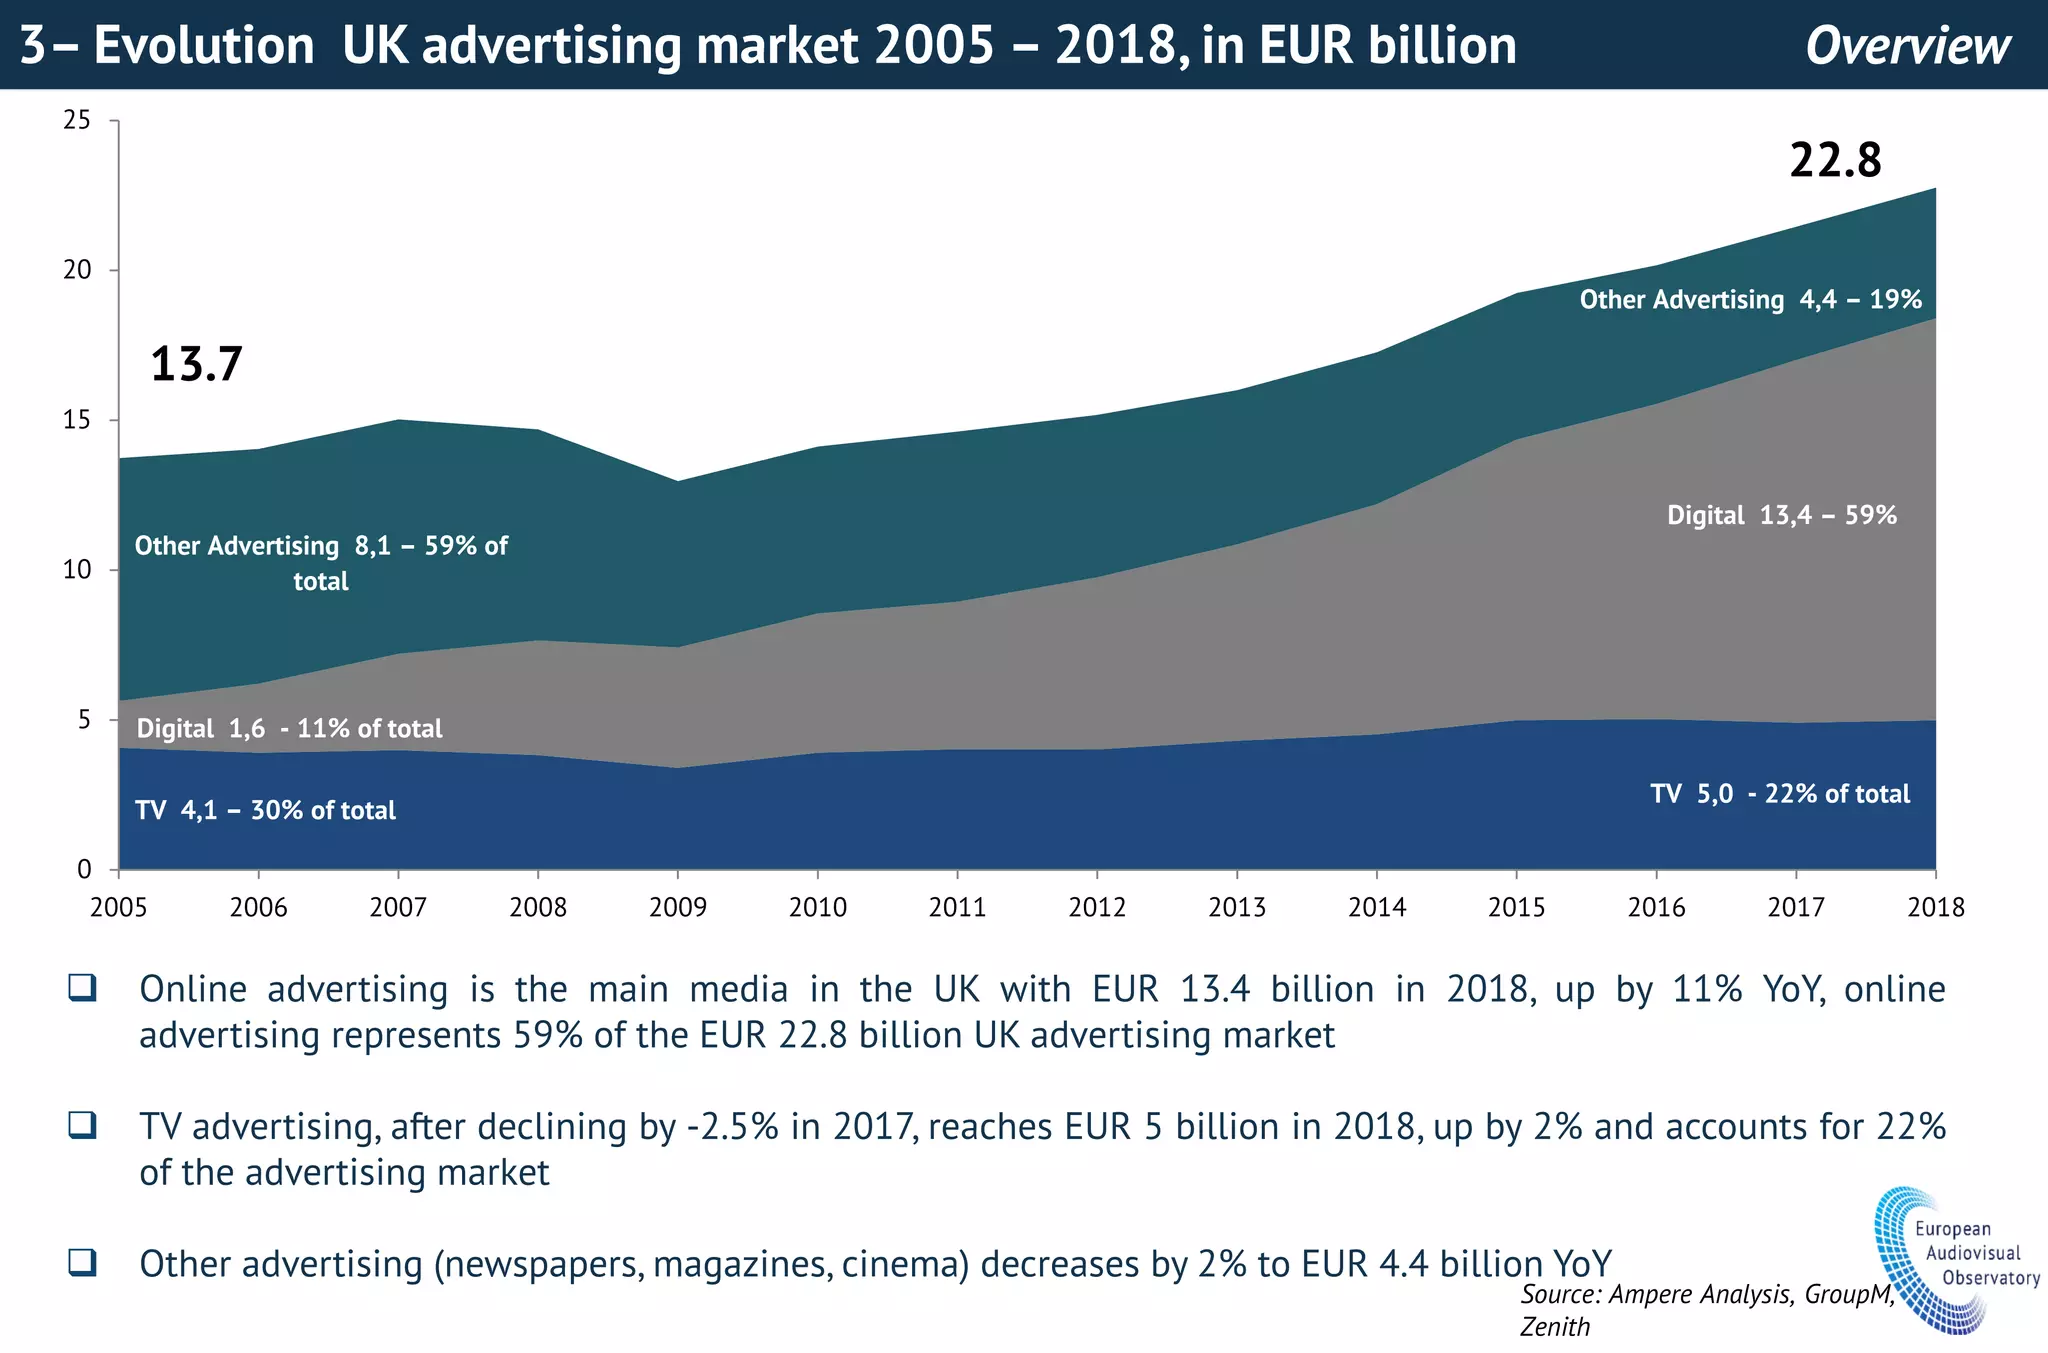
In turn, commercial broadcasters, such as ITV, are trying to find other revenue sources as TV
advertising is only forecasted to grow moderately and linear viewing time is decreasing -
setting up of advanced TV targeting systems
Advertiser-funded VOD (AVOD), although still young, grows fast– globally already at USD
23.8 billion in 2017 and accounting for 5.2% of global adspend
Amazon exploring launch of AVOD service & YouTube’s originals set to become available
through ad-supported viewing in a shift in strategy](https://image.slidesharecdn.com/focus2018-london04-12-2018-faangssession-181213145306/75/Faangs-session-FAANGs-ain-t-what-they-used-to-be-18-2048.jpg)


The document discusses the evolving landscape of media and OTT distribution, focusing on FAANG companies (Facebook, Amazon, Apple, Netflix, Google) and their significant impacts on traditional media players. It highlights the rapid growth of SVOD services in the UK and EU, indicating a shift in consumer preference towards access rather than ownership of content, alongside rising competition and advertising trends dominated by a few tech giants. Traditional media players face challenges in adapting to this new environment, emphasizing the need for mergers, alliances, and innovative strategies to remain relevant.


