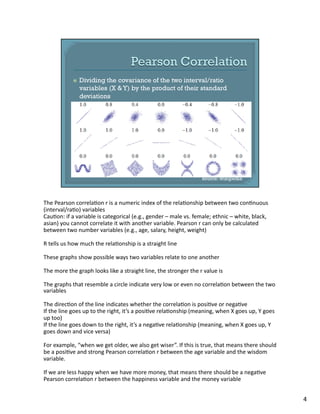
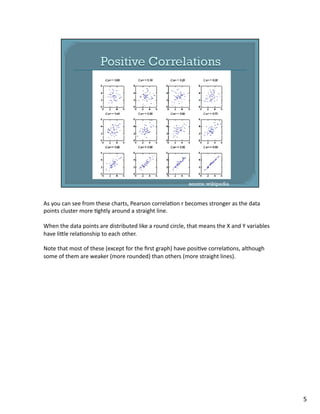
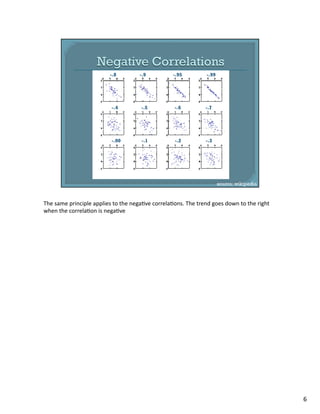
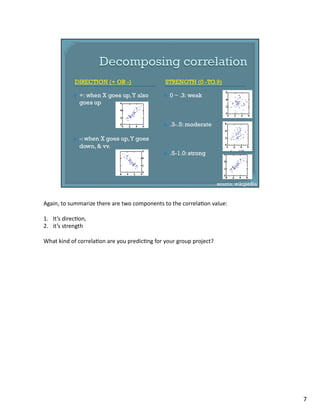
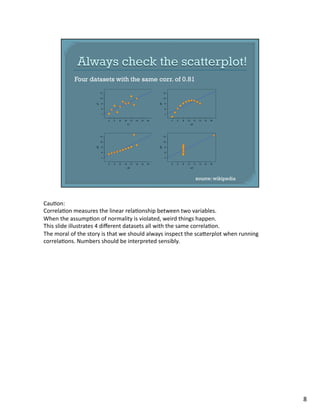
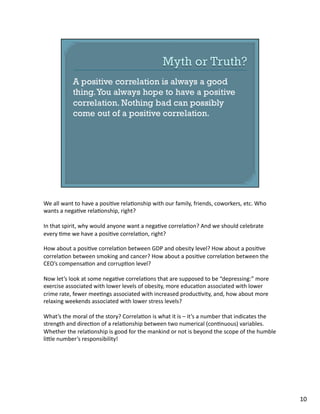
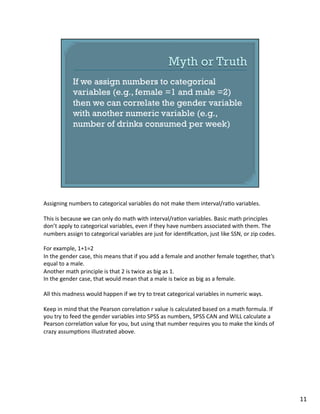
This document discusses the Pearson correlation coefficient (r), which measures the strength and direction of the linear relationship between two continuous variables. r ranges from -1 to 1, where -1 is a perfect negative correlation, 0 is no correlation, and 1 is a perfect positive correlation. Stronger correlations are indicated by data points clustered more tightly around a straight line, while weaker or no correlations are shown by data points distributed circularly. However, correlation does not necessarily imply causation, and positive or negative correlations may or may not be desirable depending on the variables involved.