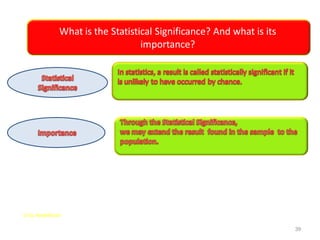
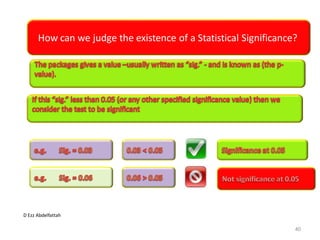
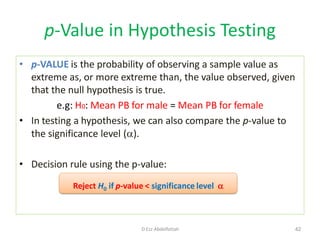
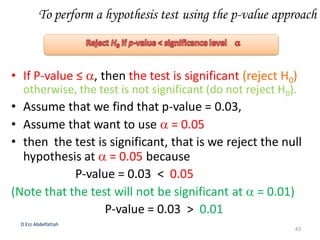
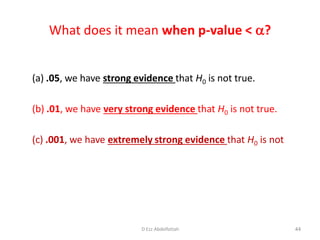
‫الرحيم‬ ‫الرحمن‬ ‫هللا‬ ‫بسم‬
‫أمرى‬ ‫لى‬ ‫ويسر‬ ‫صدري‬ ‫لي‬ ‫اشرح‬ ‫رب‬
‫قولي‬ ‫يفقهوا‬ ‫لسانى‬ ‫من‬ ‫عقدة‬ ‫واحلل‬
2D Ezz Abdelfattah
D Ezz Abdelfattah
Why do we need Statistics?
3
D Ezz Abdelfattah
Understanding &
defining the problem
What to measure?
& how to measure?
Collection & Editing
Constructingtables,
Graphs, Estimation,
Looking for patterns,
Testing Hypotheses,
Predicting,…
Interpretation, New
ideas & Solving the
problem
What is the Steps for Scientific Research?
Dr Ezz H. Abdelfattah
4
Previously
discussed
problem
1st time
(new)
problem
Dr Ezz H. Abdelfattah
What is the mean value of ...?
What is the percentage of …?
What is the your opinion regarding…?
Is the mean value of ... Equals …?
Is the percentage of …Equals …?
There is a relation between … and …?
There is a difference between … and …?
We Answer Using:
Estimation
Likert Scale
We Answer Using:
Testing Hypotheses
Sampling techniques
Dr Ezz H. Abdelfattah
Sampling techniques
Dr Ezz H. Abdelfattah
Conservative law
2
1







E
n
Sample Size
n is the required size of the sample
E is the maximum allowable error
For example if E=0.05 then:
Sample Size for Estimating the Population
Mean(µ)
2





 

E
Z
n

Sample Size
n is the required size of the sample
E is the maximum allowable error
For example if E=0.05 and  =1.1, then with
95% Confidence, we have:
is the population standard deviation
Z is the standard Normal value (e.g. = 1.96 at confidence 95%)
Sample Size for Estimating the Population
Proportion() 2
)1( 






E
Z
ppn
Sample Size
n is the required size of the sample
E is the maximum allowable error
For example if E=0.05 and p =0.30 then with
95% Confidence, we have:
P is the sample proportion
Z is the standard Normal value (e.g. = 1.96 at confidence 95%)
D Ezz Abdelfattah
What is biostatistics?
Biostatistics provides a framework for the analysis of
data.
Through the application of statistic principles to the
biologic sciences, biostatisticians are able to
methodically distinguish between true differences
among observations and random variations caused by
chance alone.
11
D Ezz Abdelfattah
How is biostatistics useful?
From an application standpoint, knowledge of
biostatistics and epidemiology permits one to make
valid conclusions (information) from data sets.
Associations between risk factors and disease are
determined with this information and, ultimately, are
used to reduce illness and injury.
12
D Ezz Abdelfattah
What is the main subjects of Biostatistics?
13
Independent, Dependent, Confounder and intermediate Variables
D Ezz Abdelfattah
What is the different Types of Variables?
14
D Ezz Abdelfattah
What is the measurement levels?
15
D Ezz Abdelfattah
Why is the measurement levels important?
AppropriateStatistical measurement or test is based on measurementlevel
16
D Ezz Abdelfattah
What is the difference between a and a ?
A sample is a subgroup of the population. Used to study
the population
A population consists of all subjects (human or
otherwise) that are being studied.
17
D Ezz Abdelfattah
What is the difference between
a and a ?
A statistic is a characteristic or measure obtained by
using the data values from a sample.
A parameter is a characteristic or measure obtained by
using the data values from a specific population
18
D Ezz Abdelfattah
What is the difference between
and Statistics?
19
How can the Inferential Statistics draw a picture” about what
we don’t have?
Dr Ezz H. Abdelfattah
Population Sample
Inferential
statistics
Decision
Descriptive
statistics
20D Ezz Abdelfattah
How can the Inferential Statistics draw a picture” about what
we don’t have?
Dr Ezz H. Abdelfattah 21D Ezz Abdelfattah
D Ezz Abdelfattah
What is the tools of Descriptive Statistics?
22
D Ezz Abdelfattah
What is the main parts of Inferential Statistics?
23
D Ezz Abdelfattah
What is the difference between
and ?
24
D Ezz Abdelfattah
What is the difference between and ?
25
D Ezz Abdelfattah
Comparative Studies
gather past data from selected cases and controls
to determine differences, if any, in exposure to a
suspected risk factor. These are commonly
referred to as case–control studies
Retrospective studies
Prospective Studies
enroll group or groups of subjects and follow
them over certain periods of time.
examples include occupational mortality studies
and clinical trials
What is the difference between Retrospective and Prospective
studies?
26
D Ezz Abdelfattah
What is the different types of ?
27
D Ezz Abdelfattah
What is the difference between types of ?
28
D Ezz Abdelfattah
What is the appropriate test used in the ?
29
D Ezz Abdelfattah
What is the Analysis of ?
30
The cohort study design focuses on a particular exposure rather
than a particular disease as in case–control studies.
Basic survival analysis and Cox’s proportional hazards
regression—were developed to deal with survival data resulting
from prospective or cohort studies.
Survival analysis, which was developed to deal with data
resulting from prospective studies, is also focused on the
occurrence of an event, such as death or relapse of a disease,
after some initial treatment—a binary outcome.
D Ezz Abdelfattah
What is the Analysis of ?
31
The basic difference with the logistic regression analysis is that:
For survival data, studies have staggered entry, and subjects are
followed for varying lengths of time; they do not have the same
probability for the event to occur.
Second, each member of the cohort belongs to one of three types
of termination:
1. Subjects still alive on the analysis date
2. Subjects who died on a known date within the study period
3. Subjects who are lost to follow-up after a certain date (This is
known as Censoring).
In prospective studies, the important feature is not only the
outcome event, such as death, but the time to that event, the
survival time.
D Ezz Abdelfattah
What is Kaplan-Meier is used for?
32
The Kaplan-Meier procedure is a method of estimating time-to-
event models in the presence of censored cases.
Example. Does a new treatment for
AIDS have any therapeutic benefit in
extending life? We could conduct a
study using two groups of AIDS
patients, one receiving traditional
therapy and the other receiving the
experimental treatment. Constructing a
Kaplan-Meier model from the data
would allow us to compare overall
survival rates between the two groups
to determine whether the experimental
treatment is an improvement over the
traditional therapy. We can also plot
the survival or hazard functions and
compare them visually for more
detailed information.
D Ezz Abdelfattah
What is Cox’s regression is used for?
33
Cox Regression builds a predictive model for time-to-event data.
The model produces a survival function that predicts the
probability that the event of interest has occurred at a given time t
for given values of the predictor variables.
The shape of the survival function and the regression coefficients for the
predictors are estimated from observed subjects; the model can then be
applied to new cases that have measurements for the predictor variables.
Example. Do men and women have different risks of developing lung cancer based
on cigarette smoking? By constructing a Cox Regression model, with cigarette usage
(cigarettes smoked per day) and gender entered as covariates, we can test
hypotheses regarding the effects of gender and cigarette usage on time-to-onset for
lung cancer.
D Ezz Abdelfattah
What is ROC is used for?
34
ROC Curves procedure is a useful way to evaluate the performance
of classification schemes in which there is one variable with two
categories by which subjects are classified.
Example. It is in a researcher interest to correctly classify pregnant women into those
women who will and will give vaginal delivery, so special methods are developed for
making these decisions. ROC curves can be used to evaluate how well these methods
perform.
D Ezz Abdelfattah
Example on ?
35
D Ezz Abdelfattah
Example on ?
36
D Ezz Abdelfattah
Example on ?
37
D Ezz Abdelfattah
What is the Phases of the ?
38
D Ezz Abdelfattah
What is the Statistical Significance? And what is its
importance?
39
D Ezz Abdelfattah
How can we judge the existence of a Statistical Significance?
40
How do we take a decision
(the P value)
D Ezz Abdelfattah
Answering a Statistical Question
41
p-Value in Hypothesis Testing
• p-VALUE is the probability of observing a sample value as
extreme as, or more extreme than, the value observed, given
that the null hypothesis is true.
e.g: H0: Mean PB for male = Mean PB for female
• In testing a hypothesis, we can also compare the p-value to
the significance level ().
• Decision rule using the p-value:
Reject H0 if p-value < significance level 
42D Ezz Abdelfattah
To perform a hypothesis test using the p-value approach
• If P-value ≤ , then the test is significant (reject H0)
otherwise, the test is not significant (do not reject H0).
• Assume that we find that p-value = 0.03,
• Assume that want to use  = 0.05
• then the test is significant, that is we reject the null
hypothesis at  = 0.05 because
P-value = 0.03 < 0.05
(Note that the test will not be significant at  = 0.01)
P-value = 0.03 > 0.01
D Ezz Abdelfattah
43
What does it mean when p-value < ?
(a) .05, we have strong evidence that H0 is not true.
(b) .01, we have very strong evidence that H0 is not true.
(c) .001, we have extremely strong evidence that H0 is not true.
44D Ezz Abdelfattah
D Ezz Abdelfattah 45
Answering a Statistical Question
D Ezz Abdelfattah 46
Answering a Statistical Question
D Ezz Abdelfattah 47
D Ezz Abdelfattah 48
Answering a Statistical Question
D Ezz Abdelfattah 49
Answering a Statistical Question
D Ezz Abdelfattah 50
D Ezz Abdelfattah 51
Answering a Statistical Question
Reference Book
D Ezz Abdelfattah 52
53D Ezz Abdelfattah

Ezz eazy biostatistics for crash course

  • 1.
    ‫الرحيم‬ ‫الرحمن‬ ‫هللا‬‫بسم‬ ‫أمرى‬ ‫لى‬ ‫ويسر‬ ‫صدري‬ ‫لي‬ ‫اشرح‬ ‫رب‬ ‫قولي‬ ‫يفقهوا‬ ‫لسانى‬ ‫من‬ ‫عقدة‬ ‫واحلل‬
  • 2.
  • 3.
    D Ezz Abdelfattah Whydo we need Statistics? 3
  • 4.
    D Ezz Abdelfattah Understanding& defining the problem What to measure? & how to measure? Collection & Editing Constructingtables, Graphs, Estimation, Looking for patterns, Testing Hypotheses, Predicting,… Interpretation, New ideas & Solving the problem What is the Steps for Scientific Research? Dr Ezz H. Abdelfattah 4
  • 5.
    Previously discussed problem 1st time (new) problem Dr EzzH. Abdelfattah What is the mean value of ...? What is the percentage of …? What is the your opinion regarding…? Is the mean value of ... Equals …? Is the percentage of …Equals …? There is a relation between … and …? There is a difference between … and …? We Answer Using: Estimation Likert Scale We Answer Using: Testing Hypotheses
  • 6.
  • 7.
  • 8.
    Conservative law 2 1        E n Sample Size nis the required size of the sample E is the maximum allowable error For example if E=0.05 then:
  • 9.
    Sample Size forEstimating the Population Mean(µ) 2         E Z n  Sample Size n is the required size of the sample E is the maximum allowable error For example if E=0.05 and  =1.1, then with 95% Confidence, we have: is the population standard deviation Z is the standard Normal value (e.g. = 1.96 at confidence 95%)
  • 10.
    Sample Size forEstimating the Population Proportion() 2 )1(        E Z ppn Sample Size n is the required size of the sample E is the maximum allowable error For example if E=0.05 and p =0.30 then with 95% Confidence, we have: P is the sample proportion Z is the standard Normal value (e.g. = 1.96 at confidence 95%)
  • 11.
    D Ezz Abdelfattah Whatis biostatistics? Biostatistics provides a framework for the analysis of data. Through the application of statistic principles to the biologic sciences, biostatisticians are able to methodically distinguish between true differences among observations and random variations caused by chance alone. 11
  • 12.
    D Ezz Abdelfattah Howis biostatistics useful? From an application standpoint, knowledge of biostatistics and epidemiology permits one to make valid conclusions (information) from data sets. Associations between risk factors and disease are determined with this information and, ultimately, are used to reduce illness and injury. 12
  • 13.
    D Ezz Abdelfattah Whatis the main subjects of Biostatistics? 13
  • 14.
    Independent, Dependent, Confounderand intermediate Variables D Ezz Abdelfattah What is the different Types of Variables? 14
  • 15.
    D Ezz Abdelfattah Whatis the measurement levels? 15
  • 16.
    D Ezz Abdelfattah Whyis the measurement levels important? AppropriateStatistical measurement or test is based on measurementlevel 16
  • 17.
    D Ezz Abdelfattah Whatis the difference between a and a ? A sample is a subgroup of the population. Used to study the population A population consists of all subjects (human or otherwise) that are being studied. 17
  • 18.
    D Ezz Abdelfattah Whatis the difference between a and a ? A statistic is a characteristic or measure obtained by using the data values from a sample. A parameter is a characteristic or measure obtained by using the data values from a specific population 18
  • 19.
    D Ezz Abdelfattah Whatis the difference between and Statistics? 19
  • 20.
    How can theInferential Statistics draw a picture” about what we don’t have? Dr Ezz H. Abdelfattah Population Sample Inferential statistics Decision Descriptive statistics 20D Ezz Abdelfattah
  • 21.
    How can theInferential Statistics draw a picture” about what we don’t have? Dr Ezz H. Abdelfattah 21D Ezz Abdelfattah
  • 22.
    D Ezz Abdelfattah Whatis the tools of Descriptive Statistics? 22
  • 23.
    D Ezz Abdelfattah Whatis the main parts of Inferential Statistics? 23
  • 24.
    D Ezz Abdelfattah Whatis the difference between and ? 24
  • 25.
    D Ezz Abdelfattah Whatis the difference between and ? 25
  • 26.
    D Ezz Abdelfattah ComparativeStudies gather past data from selected cases and controls to determine differences, if any, in exposure to a suspected risk factor. These are commonly referred to as case–control studies Retrospective studies Prospective Studies enroll group or groups of subjects and follow them over certain periods of time. examples include occupational mortality studies and clinical trials What is the difference between Retrospective and Prospective studies? 26
  • 27.
    D Ezz Abdelfattah Whatis the different types of ? 27
  • 28.
    D Ezz Abdelfattah Whatis the difference between types of ? 28
  • 29.
    D Ezz Abdelfattah Whatis the appropriate test used in the ? 29
  • 30.
    D Ezz Abdelfattah Whatis the Analysis of ? 30 The cohort study design focuses on a particular exposure rather than a particular disease as in case–control studies. Basic survival analysis and Cox’s proportional hazards regression—were developed to deal with survival data resulting from prospective or cohort studies. Survival analysis, which was developed to deal with data resulting from prospective studies, is also focused on the occurrence of an event, such as death or relapse of a disease, after some initial treatment—a binary outcome.
  • 31.
    D Ezz Abdelfattah Whatis the Analysis of ? 31 The basic difference with the logistic regression analysis is that: For survival data, studies have staggered entry, and subjects are followed for varying lengths of time; they do not have the same probability for the event to occur. Second, each member of the cohort belongs to one of three types of termination: 1. Subjects still alive on the analysis date 2. Subjects who died on a known date within the study period 3. Subjects who are lost to follow-up after a certain date (This is known as Censoring). In prospective studies, the important feature is not only the outcome event, such as death, but the time to that event, the survival time.
  • 32.
    D Ezz Abdelfattah Whatis Kaplan-Meier is used for? 32 The Kaplan-Meier procedure is a method of estimating time-to- event models in the presence of censored cases. Example. Does a new treatment for AIDS have any therapeutic benefit in extending life? We could conduct a study using two groups of AIDS patients, one receiving traditional therapy and the other receiving the experimental treatment. Constructing a Kaplan-Meier model from the data would allow us to compare overall survival rates between the two groups to determine whether the experimental treatment is an improvement over the traditional therapy. We can also plot the survival or hazard functions and compare them visually for more detailed information.
  • 33.
    D Ezz Abdelfattah Whatis Cox’s regression is used for? 33 Cox Regression builds a predictive model for time-to-event data. The model produces a survival function that predicts the probability that the event of interest has occurred at a given time t for given values of the predictor variables. The shape of the survival function and the regression coefficients for the predictors are estimated from observed subjects; the model can then be applied to new cases that have measurements for the predictor variables. Example. Do men and women have different risks of developing lung cancer based on cigarette smoking? By constructing a Cox Regression model, with cigarette usage (cigarettes smoked per day) and gender entered as covariates, we can test hypotheses regarding the effects of gender and cigarette usage on time-to-onset for lung cancer.
  • 34.
    D Ezz Abdelfattah Whatis ROC is used for? 34 ROC Curves procedure is a useful way to evaluate the performance of classification schemes in which there is one variable with two categories by which subjects are classified. Example. It is in a researcher interest to correctly classify pregnant women into those women who will and will give vaginal delivery, so special methods are developed for making these decisions. ROC curves can be used to evaluate how well these methods perform.
  • 35.
  • 36.
  • 37.
  • 38.
    D Ezz Abdelfattah Whatis the Phases of the ? 38
  • 39.
    D Ezz Abdelfattah Whatis the Statistical Significance? And what is its importance? 39
  • 40.
    D Ezz Abdelfattah Howcan we judge the existence of a Statistical Significance? 40
  • 41.
    How do wetake a decision (the P value) D Ezz Abdelfattah Answering a Statistical Question 41
  • 42.
    p-Value in HypothesisTesting • p-VALUE is the probability of observing a sample value as extreme as, or more extreme than, the value observed, given that the null hypothesis is true. e.g: H0: Mean PB for male = Mean PB for female • In testing a hypothesis, we can also compare the p-value to the significance level (). • Decision rule using the p-value: Reject H0 if p-value < significance level  42D Ezz Abdelfattah
  • 43.
    To perform ahypothesis test using the p-value approach • If P-value ≤ , then the test is significant (reject H0) otherwise, the test is not significant (do not reject H0). • Assume that we find that p-value = 0.03, • Assume that want to use  = 0.05 • then the test is significant, that is we reject the null hypothesis at  = 0.05 because P-value = 0.03 < 0.05 (Note that the test will not be significant at  = 0.01) P-value = 0.03 > 0.01 D Ezz Abdelfattah 43
  • 44.
    What does itmean when p-value < ? (a) .05, we have strong evidence that H0 is not true. (b) .01, we have very strong evidence that H0 is not true. (c) .001, we have extremely strong evidence that H0 is not true. 44D Ezz Abdelfattah
  • 45.
    D Ezz Abdelfattah45 Answering a Statistical Question
  • 46.
    D Ezz Abdelfattah46 Answering a Statistical Question
  • 47.
  • 48.
    D Ezz Abdelfattah48 Answering a Statistical Question
  • 49.
    D Ezz Abdelfattah49 Answering a Statistical Question
  • 50.
  • 51.
    D Ezz Abdelfattah51 Answering a Statistical Question
  • 52.
    Reference Book D EzzAbdelfattah 52
  • 53.