ExxonMobil announced its estimated first quarter 2006 results. Net income increased 7% to $8.4 billion compared to the first quarter of 2005. Earnings excluding special items were $8.4 billion, up 14% from the first quarter of 2005. Capital and exploration expenditures increased 41% to $4.8 billion compared to the first quarter of 2005. Production increased 5% on an oil-equivalent basis from the first quarter of 2005.
Motor Oil announced yesterday amc FY’12 results, which came in below consensus’ estimates across-the-board on higher-than-expected inventory losses and financial expenses.
Motor Oil announced yesterday amc FY’12 results, which came in below consensus’ estimates across-the-board on higher-than-expected inventory losses and financial expenses.
The secret way to sell pi coins effortlessly.DOT TECH
Well as we all know pi isn't launched yet. But you can still sell your pi coins effortlessly because some whales in China are interested in holding massive pi coins. And they are willing to pay good money for it. If you are interested in selling I will leave a contact for you. Just telegram this number below. I sold about 3000 pi coins to him and he paid me immediately.
Telegram: @Pi_vendor_247
when will pi network coin be available on crypto exchange.DOT TECH
There is no set date for when Pi coins will enter the market.
However, the developers are working hard to get them released as soon as possible.
Once they are available, users will be able to exchange other cryptocurrencies for Pi coins on designated exchanges.
But for now the only way to sell your pi coins is through verified pi vendor.
Here is the telegram contact of my personal pi vendor
@Pi_vendor_247
how to sell pi coins at high rate quickly.DOT TECH
Where can I sell my pi coins at a high rate.
Pi is not launched yet on any exchange. But one can easily sell his or her pi coins to investors who want to hold pi till mainnet launch.
This means crypto whales want to hold pi. And you can get a good rate for selling pi to them. I will leave the telegram contact of my personal pi vendor below.
A vendor is someone who buys from a miner and resell it to a holder or crypto whale.
Here is the telegram contact of my vendor:
@Pi_vendor_247
Falcon stands out as a top-tier P2P Invoice Discounting platform in India, bridging esteemed blue-chip companies and eager investors. Our goal is to transform the investment landscape in India by establishing a comprehensive destination for borrowers and investors with diverse profiles and needs, all while minimizing risk. What sets Falcon apart is the elimination of intermediaries such as commercial banks and depository institutions, allowing investors to enjoy higher yields.
how to sell pi coins in South Korea profitably.DOT TECH
Yes. You can sell your pi network coins in South Korea or any other country, by finding a verified pi merchant
What is a verified pi merchant?
Since pi network is not launched yet on any exchange, the only way you can sell pi coins is by selling to a verified pi merchant, and this is because pi network is not launched yet on any exchange and no pre-sale or ico offerings Is done on pi.
Since there is no pre-sale, the only way exchanges can get pi is by buying from miners. So a pi merchant facilitates these transactions by acting as a bridge for both transactions.
How can i find a pi vendor/merchant?
Well for those who haven't traded with a pi merchant or who don't already have one. I will leave the telegram id of my personal pi merchant who i trade pi with.
Tele gram: @Pi_vendor_247
#pi #sell #nigeria #pinetwork #picoins #sellpi #Nigerian #tradepi #pinetworkcoins #sellmypi
USDA Loans in California: A Comprehensive Overview.pptxmarketing367770
USDA Loans in California: A Comprehensive Overview
If you're dreaming of owning a home in California's rural or suburban areas, a USDA loan might be the perfect solution. The U.S. Department of Agriculture (USDA) offers these loans to help low-to-moderate-income individuals and families achieve homeownership.
Key Features of USDA Loans:
Zero Down Payment: USDA loans require no down payment, making homeownership more accessible.
Competitive Interest Rates: These loans often come with lower interest rates compared to conventional loans.
Flexible Credit Requirements: USDA loans have more lenient credit score requirements, helping those with less-than-perfect credit.
Guaranteed Loan Program: The USDA guarantees a portion of the loan, reducing risk for lenders and expanding borrowing options.
Eligibility Criteria:
Location: The property must be located in a USDA-designated rural or suburban area. Many areas in California qualify.
Income Limits: Applicants must meet income guidelines, which vary by region and household size.
Primary Residence: The home must be used as the borrower's primary residence.
Application Process:
Find a USDA-Approved Lender: Not all lenders offer USDA loans, so it's essential to choose one approved by the USDA.
Pre-Qualification: Determine your eligibility and the amount you can borrow.
Property Search: Look for properties in eligible rural or suburban areas.
Loan Application: Submit your application, including financial and personal information.
Processing and Approval: The lender and USDA will review your application. If approved, you can proceed to closing.
USDA loans are an excellent option for those looking to buy a home in California's rural and suburban areas. With no down payment and flexible requirements, these loans make homeownership more attainable for many families. Explore your eligibility today and take the first step toward owning your dream home.
US Economic Outlook - Being Decided - M Capital Group August 2021.pdfpchutichetpong
The U.S. economy is continuing its impressive recovery from the COVID-19 pandemic and not slowing down despite re-occurring bumps. The U.S. savings rate reached its highest ever recorded level at 34% in April 2020 and Americans seem ready to spend. The sectors that had been hurt the most by the pandemic specifically reduced consumer spending, like retail, leisure, hospitality, and travel, are now experiencing massive growth in revenue and job openings.
Could this growth lead to a “Roaring Twenties”? As quickly as the U.S. economy contracted, experiencing a 9.1% drop in economic output relative to the business cycle in Q2 2020, the largest in recorded history, it has rebounded beyond expectations. This surprising growth seems to be fueled by the U.S. government’s aggressive fiscal and monetary policies, and an increase in consumer spending as mobility restrictions are lifted. Unemployment rates between June 2020 and June 2021 decreased by 5.2%, while the demand for labor is increasing, coupled with increasing wages to incentivize Americans to rejoin the labor force. Schools and businesses are expected to fully reopen soon. In parallel, vaccination rates across the country and the world continue to rise, with full vaccination rates of 50% and 14.8% respectively.
However, it is not completely smooth sailing from here. According to M Capital Group, the main risks that threaten the continued growth of the U.S. economy are inflation, unsettled trade relations, and another wave of Covid-19 mutations that could shut down the world again. Have we learned from the past year of COVID-19 and adapted our economy accordingly?
“In order for the U.S. economy to continue growing, whether there is another wave or not, the U.S. needs to focus on diversifying supply chains, supporting business investment, and maintaining consumer spending,” says Grace Feeley, a research analyst at M Capital Group.
While the economic indicators are positive, the risks are coming closer to manifesting and threatening such growth. The new variants spreading throughout the world, Delta, Lambda, and Gamma, are vaccine-resistant and muddy the predictions made about the economy and health of the country. These variants bring back the feeling of uncertainty that has wreaked havoc not only on the stock market but the mindset of people around the world. MCG provides unique insight on how to mitigate these risks to possibly ensure a bright economic future.
The European Unemployment Puzzle: implications from population agingGRAPE
We study the link between the evolving age structure of the working population and unemployment. We build a large new Keynesian OLG model with a realistic age structure, labor market frictions, sticky prices, and aggregate shocks. Once calibrated to the European economy, we quantify the extent to which demographic changes over the last three decades have contributed to the decline of the unemployment rate. Our findings yield important implications for the future evolution of unemployment given the anticipated further aging of the working population in Europe. We also quantify the implications for optimal monetary policy: lowering inflation volatility becomes less costly in terms of GDP and unemployment volatility, which hints that optimal monetary policy may be more hawkish in an aging society. Finally, our results also propose a partial reversal of the European-US unemployment puzzle due to the fact that the share of young workers is expected to remain robust in the US.
how can i use my minded pi coins I need some funds.DOT TECH
If you are interested in selling your pi coins, i have a verified pi merchant, who buys pi coins and resell them to exchanges looking forward to hold till mainnet launch.
Because the core team has announced that pi network will not be doing any pre-sale. The only way exchanges like huobi, bitmart and hotbit can get pi is by buying from miners.
Now a merchant stands in between these exchanges and the miners. As a link to make transactions smooth. Because right now in the enclosed mainnet you can't sell pi coins your self. You need the help of a merchant,
i will leave the telegram contact of my personal pi merchant below. 👇 I and my friends has traded more than 3000pi coins with him successfully.
@Pi_vendor_247
how can I sell pi coins after successfully completing KYCDOT TECH
Pi coins is not launched yet in any exchange 💱 this means it's not swappable, the current pi displaying on coin market cap is the iou version of pi. And you can learn all about that on my previous post.
RIGHT NOW THE ONLY WAY you can sell pi coins is through verified pi merchants. A pi merchant is someone who buys pi coins and resell them to exchanges and crypto whales. Looking forward to hold massive quantities of pi coins before the mainnet launch.
This is because pi network is not doing any pre-sale or ico offerings, the only way to get my coins is from buying from miners. So a merchant facilitates the transactions between the miners and these exchanges holding pi.
I and my friends has sold more than 6000 pi coins successfully with this method. I will be happy to share the contact of my personal pi merchant. The one i trade with, if you have your own merchant you can trade with them. For those who are new.
Message: @Pi_vendor_247 on telegram.
I wouldn't advise you selling all percentage of the pi coins. Leave at least a before so its a win win during open mainnet. Have a nice day pioneers ♥️
#kyc #mainnet #picoins #pi #sellpi #piwallet
#pinetwork
Latino Buying Power - May 2024 Presentation for Latino CaucusDanay Escanaverino
Unlock the potential of Latino Buying Power with this in-depth SlideShare presentation. Explore how the Latino consumer market is transforming the American economy, driven by their significant buying power, entrepreneurial contributions, and growing influence across various sectors.
**Key Sections Covered:**
1. **Economic Impact:** Understand the profound economic impact of Latino consumers on the U.S. economy. Discover how their increasing purchasing power is fueling growth in key industries and contributing to national economic prosperity.
2. **Buying Power:** Dive into detailed analyses of Latino buying power, including its growth trends, key drivers, and projections for the future. Learn how this influential group’s spending habits are shaping market dynamics and creating opportunities for businesses.
3. **Entrepreneurial Contributions:** Explore the entrepreneurial spirit within the Latino community. Examine how Latino-owned businesses are thriving and contributing to job creation, innovation, and economic diversification.
4. **Workforce Statistics:** Gain insights into the role of Latino workers in the American labor market. Review statistics on employment rates, occupational distribution, and the economic contributions of Latino professionals across various industries.
5. **Media Consumption:** Understand the media consumption habits of Latino audiences. Discover their preferences for digital platforms, television, radio, and social media. Learn how these consumption patterns are influencing advertising strategies and media content.
6. **Education:** Examine the educational achievements and challenges within the Latino community. Review statistics on enrollment, graduation rates, and fields of study. Understand the implications of education on economic mobility and workforce readiness.
7. **Home Ownership:** Explore trends in Latino home ownership. Understand the factors driving home buying decisions, the challenges faced by Latino homeowners, and the impact of home ownership on community stability and economic growth.
This SlideShare provides valuable insights for marketers, business owners, policymakers, and anyone interested in the economic influence of the Latino community. By understanding the various facets of Latino buying power, you can effectively engage with this dynamic and growing market segment.
Equip yourself with the knowledge to leverage Latino buying power, tap into their entrepreneurial spirit, and connect with their unique cultural and consumer preferences. Drive your business success by embracing the economic potential of Latino consumers.
**Keywords:** Latino buying power, economic impact, entrepreneurial contributions, workforce statistics, media consumption, education, home ownership, Latino market, Hispanic buying power, Latino purchasing power.
If you are looking for a pi coin investor. Then look no further because I have the right one he is a pi vendor (he buy and resell to whales in China). I met him on a crypto conference and ever since I and my friends have sold more than 10k pi coins to him And he bought all and still want more. I will drop his telegram handle below just send him a message.
@Pi_vendor_247
1. News Release
Exxon Mobil Corporation
5959 Las Colinas Boulevard
Irving, TX 75039
972 444 1107 Telephone
972 444 1138 Facsimile
FOR IMMEDIATE RELEASE
THURSDAY, APRIL 27, 2006
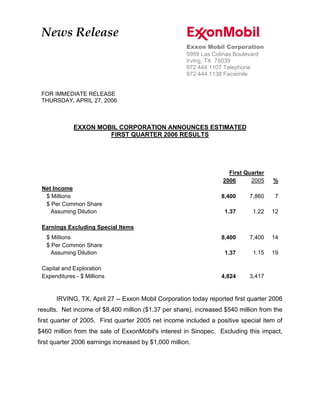
EXXON MOBIL CORPORATION ANNOUNCES ESTIMATED
FIRST QUARTER 2006 RESULTS
First Quarter
2005
2006 %
Net Income
$ Millions 7,860 7
8,400
$ Per Common Share
Assuming Dilution 1.22 12
1.37
Earnings Excluding Special Items
$ Millions 7,400 14
8,400
$ Per Common Share
Assuming Dilution 1.15 19
1.37
Capital and Exploration
Expenditures - $ Millions 3,417
4,824
IRVING, TX, April 27 -- Exxon Mobil Corporation today reported first quarter 2006
results. Net income of $8,400 million ($1.37 per share), increased $540 million from the
first quarter of 2005. First quarter 2005 net income included a positive special item of
$460 million from the sale of ExxonMobil's interest in Sinopec. Excluding this impact,
first quarter 2006 earnings increased by $1,000 million.
2. EXXONMOBIL'S CHAIRMAN REX W. TILLERSON COMMENTED:
quot;ExxonMobil's first quarter earnings excluding special items, were $8,400 million, up 14%
from first quarter 2005. Higher crude oil and natural gas realizations and improved
marketing margins were partly offset by lower chemical margins. Net income for the first
quarter was up 7% from 2005.
ExxonMobil continued its active investment program in the first quarter, spending
$4.8 billion on capital and exploration projects, an increase of 41% or $1.4 billion versus
2005. In the first quarter of 2006, the results of our continuing long term investment
program contributed to a 5% increase in production.
The Corporation distributed a total of $7.0 billion to shareholders in the first quarter
through dividends of $2.0 billion and share purchases to reduce shares outstanding of
$5.0 billion, an increase of 67% versus the first quarter of 2005. As a consequence of the
continued strengthening of our financial position, share purchases to reduce shares
outstanding will be increased to $6.0 billion in the second quarter.quot;
FIRST QUARTER HIGHLIGHTS
• Earnings excluding special items were $8,400 million, an increase of 14% or
$1,000 million from the first quarter of 2005. First quarter 2006 earnings were impacted by
litigation and tax items.
• Net income was up 7%. There were no special items in first quarter 2006. First quarter
2005 net income included a positive special item of $460 million from the sale of
ExxonMobil's interest in Sinopec.
• Cash flow from operations and asset sales was approximately $15.0 billion, including
asset sales of $0.4 billion.
• Earnings per share excluding special items were $1.37, an increase of 19%, reflecting
strong earnings and the reduction in the number of shares outstanding.
• ExxonMobil signed agreements with Abu Dhabi National Oil Company (ADNOC) for a 28%
undivided interest in the Upper Zakum Oil Field. Upper Zakum is one of the world's
largest oil fields with potential for substantial production growth. ExxonMobil, with ADNOC
and other non-operating joint venture parties will provide support in pursuing the objective
of increasing production by about 50% to a target of 750,000 (gross) barrels per day.
• ExxonMobil signed a Joint Operating Agreement (JOA) with P.T. Pertamina for the Cepu
Contract Area located in East and Central Java, Indonesia. The Banyu Urip discovery on
the Cepu Contract Area is estimated to contain more than 250 million barrels of oil (gross).
At peak production, the field is expected to produce up to 165,000 barrels of oil per day
(gross). The Area has potential for additional exploration and development opportunities.
-2-
3. First Quarter 2006 vs. First Quarter 2005
Upstream earnings were $6,383 million, up $1,329 million from the first quarter of 2005.
Earnings from U.S. Upstream operations were $1,280 million, $73 million lower than the
first quarter of 2005. The combination of a litigation item and higher tax expenses
reduced results by over 4 cents per share. Non-U.S. Upstream earnings were
$5,103 million, up $1,402 million from 2005. Higher realizations were partly offset by
negative foreign exchange impacts.
On an oil-equivalent basis, production increased by 5% from the first quarter of 2005.
Excluding the impact of divestments and entitlements, production increased 7%.
Liquids production of 2,696 kbd (thousands of barrels per day) was 152 kbd higher.
Higher production from projects in West Africa and increased volumes in Abu Dhabi
were partly offset by mature field decline, and the impact of entitlements and
divestments. Excluding entitlement and divestment effects, liquids production increased
by 10%.
First quarter natural gas production was 11,199 mcfd (millions of cubic feet per day)
compared with 10,785 mcfd last year. Higher volumes from projects in Qatar and
increased European demand were partly offset by the impact of mature field decline.
Downstream earnings excluding special items, were $1,271 million, up $128 million
from the first quarter 2005, primarily due to higher marketing margins, improved refining
operations and positive foreign exchange effects. Petroleum product sales were
7,865 kbd, 364 kbd lower than last year's first quarter, primarily due to lower refining
throughput and divestments.
U.S. Downstream earnings were $679 million, up $34 million. Non-U.S. Downstream
earnings of $592 million were $94 million higher than the first quarter of 2005.
-3-
4. Chemical earnings excluding special items were $949 million, down $333 million from
the record quarter a year ago primarily due to reduced margins. Prime product sales of
6,916 kt (thousands of metric tons) were down 22 kt from last year's first quarter.
Corporate and financing expenses were $203 million, up $124 million mainly due to tax
items.
During the first quarter of 2006, Exxon Mobil Corporation purchased 99 million shares of
its common stock for the treasury at a gross cost of $6.0 billion. These purchases
included $5.0 billion to reduce the number of shares outstanding and the balance to
offset shares issued in conjunction with the company benefits plans and programs.
Shares outstanding were reduced from 6,133 million at the end of the fourth quarter to
6,050 million at the end of the first quarter. Purchases may be made in both the open
market and through negotiated transactions, and may be increased, decreased or
discontinued at any time without prior notice.
-4-
5. ExxonMobil will discuss financial and operating results and other matters on a
webcast at 10 a.m. central time on April 27, 2006. To listen to the event live or in
archive, go to our website at www.exxonmobil.com.
Statements in this release relating to future plans, projections, events, or conditions are forward-
looking statements. Actual results, including project plans, resource recoveries, timing, and
capacities, could differ materially due to changes in long-term oil or gas prices or other market
conditions affecting the oil and gas industry; political events or disturbances; reservoir
performance; the outcome of commercial negotiations; potential liability resulting from pending
or future litigation; wars and acts of terrorism or sabotage; changes in technical or operating
conditions; and other factors discussed under the heading quot;Factors Affecting Future Resultsquot; on
our website and in Item 1A of ExxonMobil's 2005 Form 10-K. We assume no duty to update
these statements as of any future date.
Consistent with previous practice this press release includes both net income and earnings
excluding special items. Earnings that exclude special items are a non-GAAP financial measure
and are included to help facilitate comparisons of base business performance across periods. A
reconciliation to net income is shown in Attachment II. The release also includes cash flow from
operations and asset sales. Because of the regular nature of our asset management and
divestment program, we believe it is useful for investors to consider sales proceeds together
with cash provided by operating activities when evaluating cash available for investment in the
business and financing activities. Calculation of this cash flow is shown in Attachment II.
Further information on ExxonMobil's frequently used financial and operating measures is
contained on pages 28 and 29 in the 2005 Form 10-K and is also available through the Investor
Information section of our website at www.exxonmobil.com.
-5-
6. Attachment I
EXXON MOBIL CORPORATION
FIRST QUARTER 2006
(millions of dollars, unless noted)
First Quarter
2005
2006
Earnings / Earnings Per Share
Total revenues and other income1 82,051
88,980
1
Total costs and other deductions 69,148
73,521
Income before income taxes 12,903
15,459
Income taxes 5,043
7,059
Net income (U.S. GAAP) 7,860
8,400
Net income per common share (dollars) 1.23
1.38
Net income per common share
- assuming dilution (dollars) 1.22
1.37
Other Financial Data
Dividends on common stock
Total 1,728
1,957
Per common share (dollars) 0.27
0.32
Millions of common shares outstanding
At March 31 6,366
6,050
Average - assuming dilution 6,421
6,126
Shareholders' equity at March 31 103,698
112,463
Capital employed at March 31 114,171
122,286
Income taxes 5,043
7,059
Excise taxes 7,238
7,664
All other taxes 10,944
11,049
Total taxes 23,225
25,772
ExxonMobil's share of income taxes
of equity companies 493
521
1
2005 includes $7,160 million for purchases/sales contracts with the same counterparty. These transactions
are reported on a net basis in 2006.
-6-
7. Attachment II
EXXON MOBIL CORPORATION
FIRST QUARTER 2006
(millions of dollars)
First Quarter
2005
2006
Net Income (U.S. GAAP)
Upstream
United States 1,353
1,280
Non-U.S. 3,701
5,103
Downstream
United States 645
679
Non-U.S. 808
592
Chemical
United States 492
329
Non-U.S. 940
620
Corporate and financing (79)
(203)
Corporate total 7,860
8,400
Special Items
Upstream
United States 0
0
Non-U.S. 0
0
Downstream
United States 0
0
Non-U.S. 310
0
Chemical
United States 0
0
Non-U.S. 150
0
Corporate and financing 0
0
Corporate total 460
0
Earnings Excluding Special Items
Upstream
United States 1,353
1,280
Non-U.S. 3,701
5,103
Downstream
United States 645
679
Non-U.S. 498
592
Chemical
United States 492
329
Non-U.S. 790
620
Corporate and financing (79)
(203)
Corporate total 7,400
8,400
Cash flow from operations and asset sales (billions of dollars)
Net cash provided by operating activities
(U.S. GAAP) 13.0
14.6
Sales of subsidiaries, investments and
property, plant and equipment 1.8
0.4
Cash flow from operations and asset sales 14.8
15.0
-7-
8. Attachment III
EXXON MOBIL CORPORATION
FIRST QUARTER 2006
First Quarter
2005
2006
Net production of crude oil
and natural gas liquids,
thousands of barrels daily (kbd)
United States 540
440
Canada 358
332
Europe 575
563
Africa 596
741
Asia Pacific/Middle East 329
467
Russia/Caspian 95
114
Other 51
39
Worldwide 2,544
2,696
Natural gas production available for sale,
millions of cubic feet daily (mcfd)
United States 1,897
1,707
Canada 923
882
Europe 5,767
5,977
Asia Pacific/Middle East 2,036
2,462
Russia/Caspian 74
82
Other 88
89
Worldwide 10,785
11,199
Oil-equivalent production (koebd)1 4,341
4,562
1
Gas converted to oil-equivalent at 6 million cubic feet = 1 thousand barrels
-8-
9. Attachment IV
EXXON MOBIL CORPORATION
FIRST QUARTER 2006
First Quarter
2005
2006
Petroleum product sales (kbd)1
United States 2,870
2,714
Canada 620
591
Europe 2,055
2,101
Asia Pacific 1,844
1,735
Other 840
724
Worldwide 8,229
7,865
Gasolines, naphthas 3,144
3,008
Heating oils, kerosene, diesel 2,690
2,601
Aviation fuels 691
655
Heavy fuels 718
689
Specialty products 986
912
Total 8,229
7,865
Refinery throughput (kbd)
United States 1,860
1,716
Canada 481
486
Europe 1,566
1,645
Asia Pacific 1,533
1,465
Other 309
236
Worldwide 5,749
5,548
Chemical prime product sales,
thousands of metric tons (kt)
United States 2,838
2,620
Non-U.S. 4,100
4,296
Worldwide 6,938
6,916
1
Petroleum product sales include 689 kbd for first quarter 2006 and 735 kbd for first quarter 2005 for
purchases/sales contracts with the same counterparty.
-9-
10. Attachment V
EXXON MOBIL CORPORATION
FIRST QUARTER 2006
(millions of dollars)
First Quarter
2005
2006
Capital and Exploration Expenditures
Upstream
United States 441
548
Non-U.S. 2,371
3,539
Total 2,812
4,087
Downstream
United States 148
162
Non-U.S. 304
419
Total 452
581
Chemical
United States 55
63
Non-U.S. 93
81
Total 148
144
Other 5
12
Worldwide 3,417
4,824
Exploration expenses charged to income
included above
Consolidated affiliates
United States 21
63
Non-U.S. 147
214
Equity companies - ExxonMobil share
United States 0
0
Non-U.S. 5
3
Worldwide 173
280
-10-
11. Attachment VI
EXXON MOBIL CORPORATION
NET INCOME
$ Millions $ Per Common Share
2002
First Quarter 2,090 0.30
Second Quarter 2,640 0.40
Third Quarter 2,640 0.39
Fourth Quarter 4,090 0.60
Year 11,460 1.69
2003
First Quarter 7,040 1.05
Second Quarter 4,170 0.63
Third Quarter 3,650 0.55
Fourth Quarter 6,650 1.01
Year 21,510 3.24
2004
First Quarter 5,440 0.83
Second Quarter 5,790 0.89
Third Quarter 5,680 0.88
Fourth Quarter 8,420 1.31
Year 25,330 3.91
2005
First Quarter 7,860 1.23
Second Quarter 7,640 1.21
Third Quarter 9,920 1.60
Fourth Quarter 10,710 1.72
Year 36,130 5.76
2006
First Quarter 8,400 1.38
-11-