Download to read offline


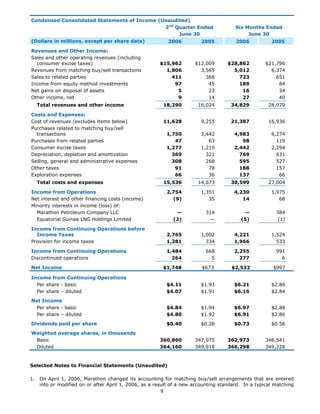
Marathon Oil Corporation reported strong financial results for the second quarter of 2006, with net income of $1.748 billion compared to $673 million in the second quarter of 2005. Earnings were boosted by higher oil and gas prices and sales volumes. The company invested over $9 billion in projects over the past 18 months. Marathon completed the sale of its Russian business and continues to advance major projects globally. Upstream income increased due to higher commodity prices and volumes, particularly in Libya and Equatorial Guinea.


