Download to read offline
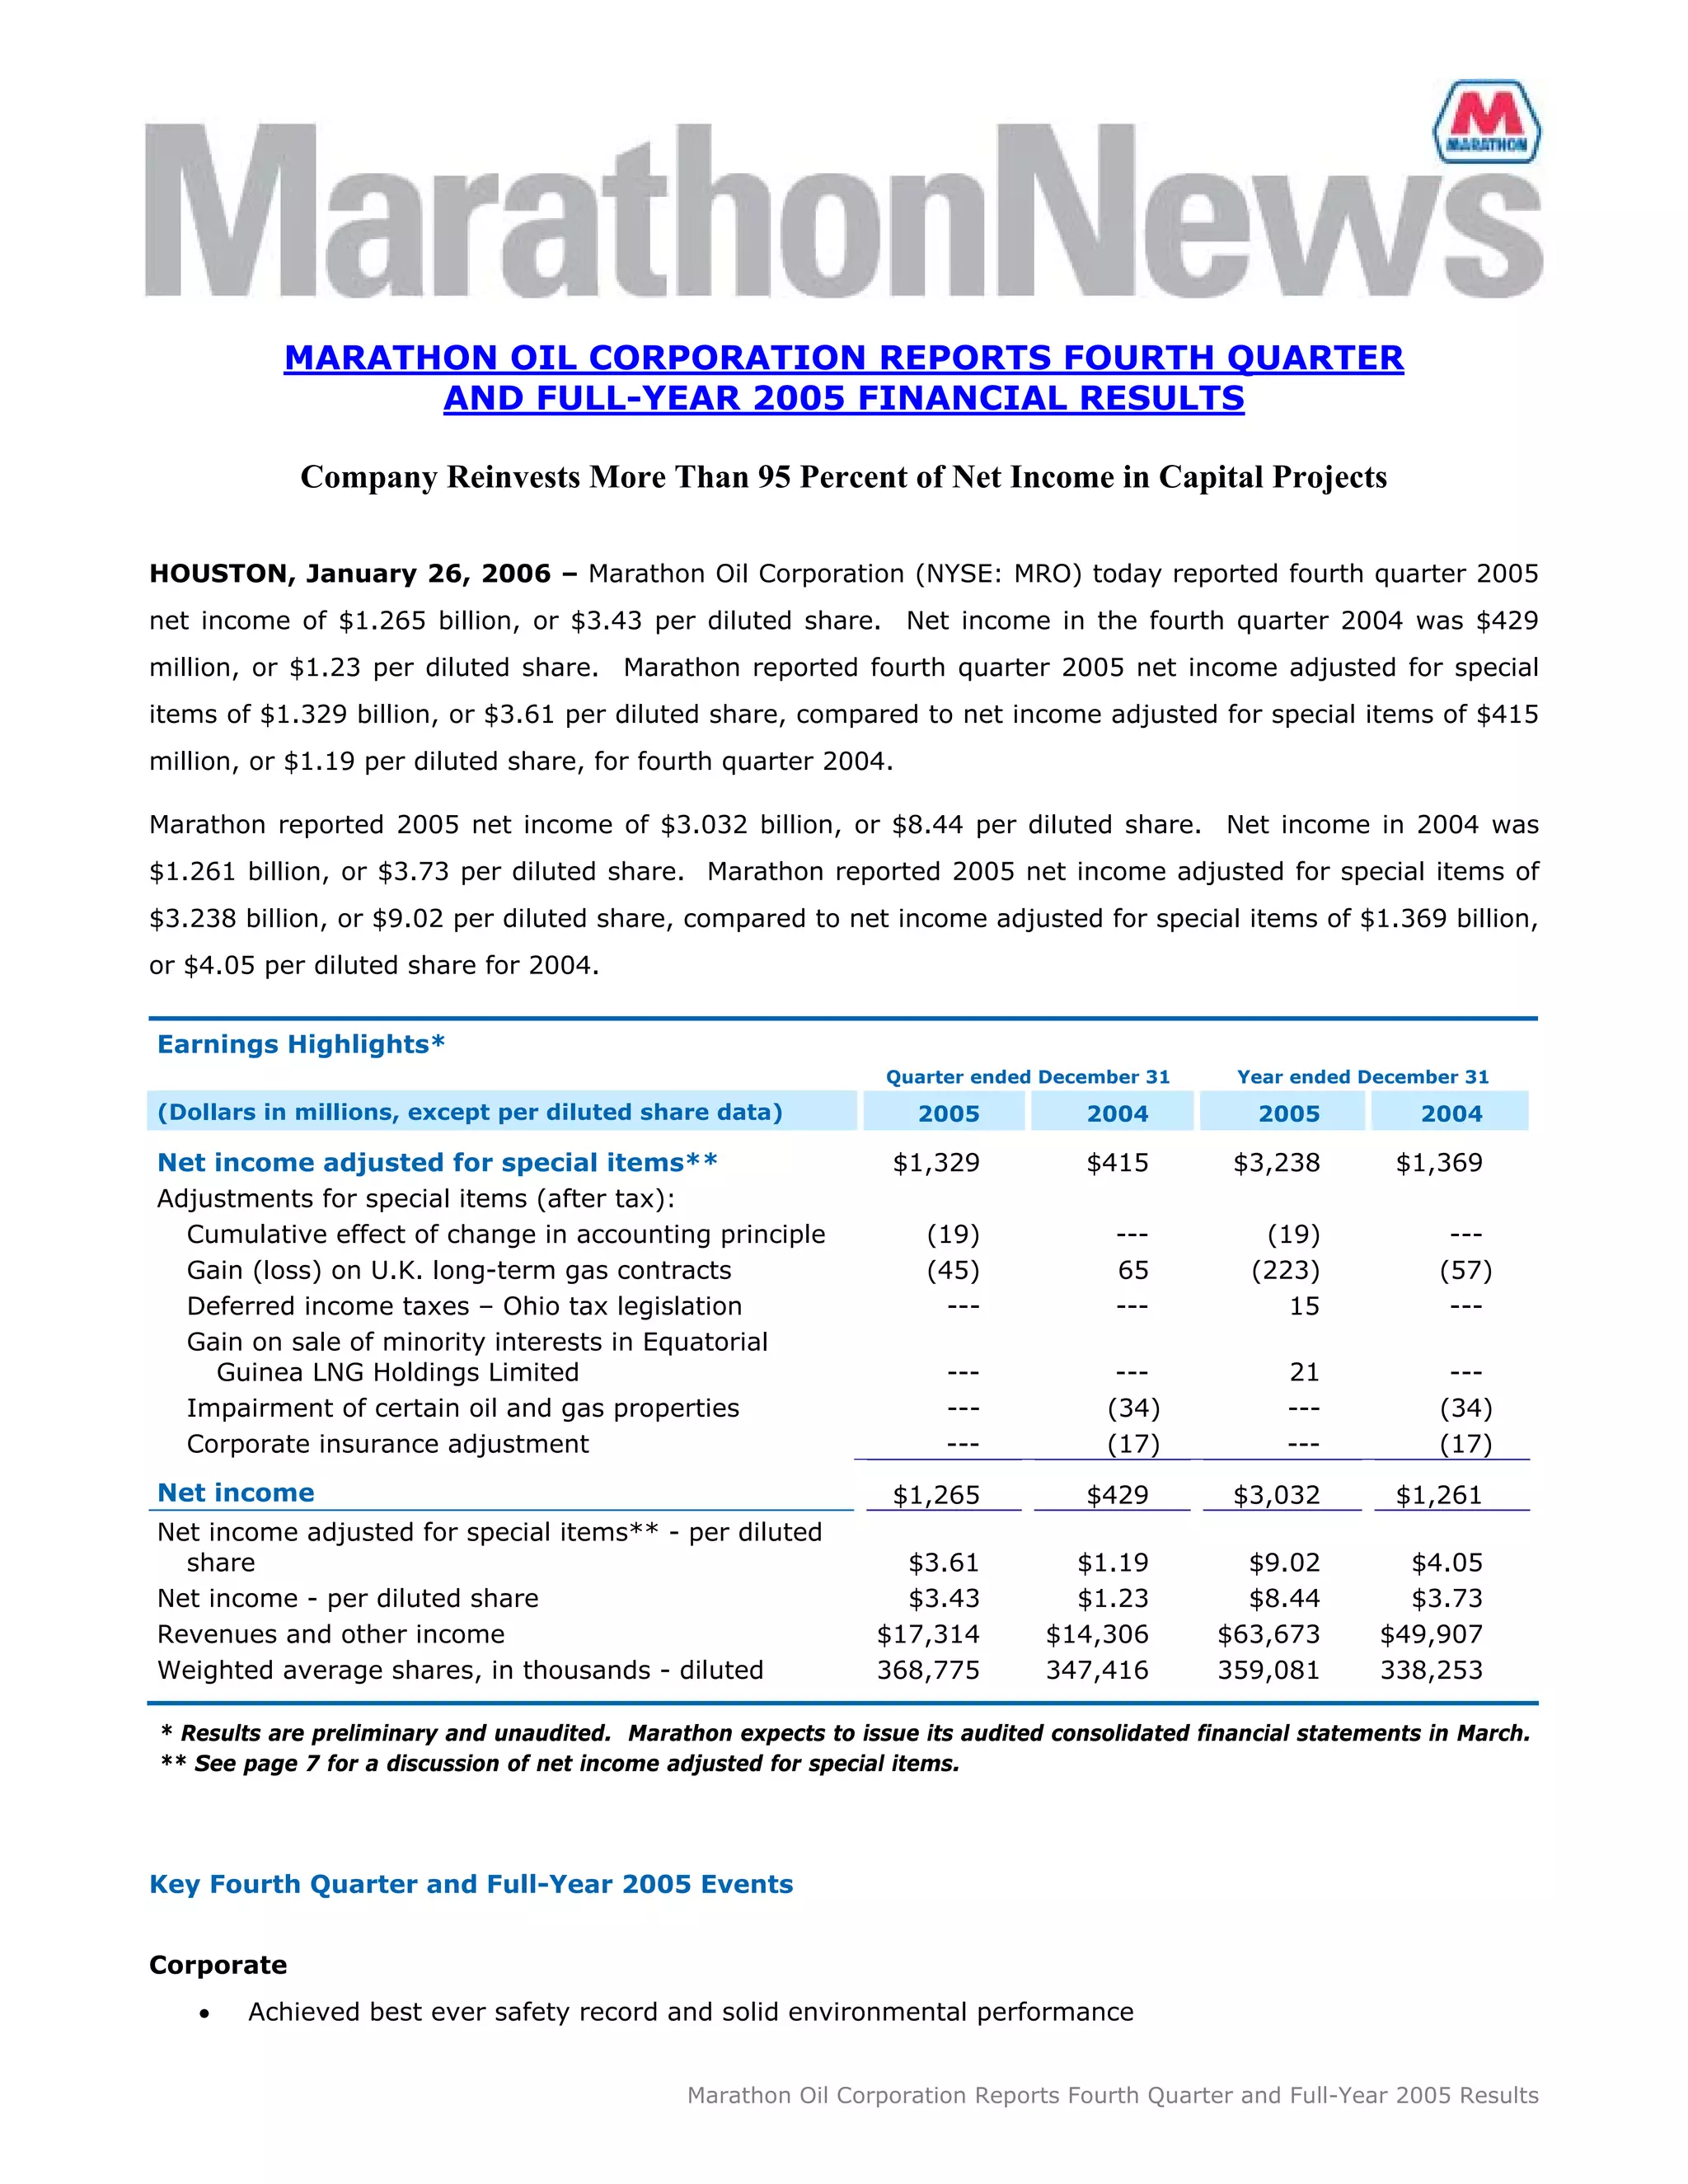
Marathon Oil Corporation reported strong financial results for the fourth quarter and full year of 2005. Net income for Q4 2005 was $1.265 billion, up significantly from $429 million in Q4 2004. For the full year, net income was $3.032 billion compared to $1.261 billion in 2004. The company reinvested over 95% of its net income back into capital projects. Key events and achievements in 2005 included acquiring full ownership of its downstream business, progress on major projects like the Equatorial Guinea LNG expansion, and setting a new safety record.


