SlideShare a Scribd company logo
Clear Channel Reports Year-End and
                           Fourth Quarter 2002 Results
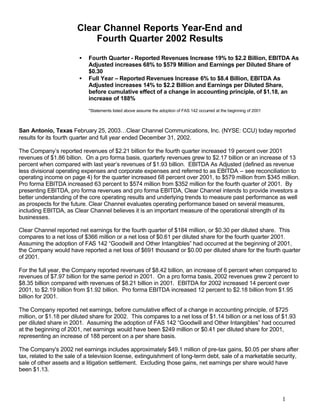
                        •   Fourth Quarter - Reported Revenues Increase 19% to $2.2 Billion, EBITDA As
                            Adjusted increases 68% to $579 Million and Earnings per Diluted Share of
                            $0.30
                        •   Full Year – Reported Revenues Increase 6% to $8.4 Billion, EBITDA As
                            Adjusted increases 14% to $2.2 Billion and Earnings per Diluted Share,
                            before cumulative effect of a change in accounting principle, of $1.18, an
                            increase of 188%

                            *Statements listed above assume the adoption of FAS 142 occurred at the beginning of 2001


San Antonio, Texas February 25, 2003…Clear Channel Communications, Inc. (NYSE: CCU) today reported
results for its fourth quarter and full year ended December 31, 2002.

The Company’s reported revenues of $2.21 billion for the fourth quarter increased 19 percent over 2001
revenues of $1.86 billion. On a pro forma basis, quarterly revenues grew to $2.17 billion or an increase of 13
percent when compared with last year’s revenues of $1.93 billion. EBITDA As Adjusted (defined as revenue
less divisional operating expenses and corporate expenses and referred to as EBITDA – see reconciliation to
operating income on page 4) for the quarter increased 68 percent over 2001, to $579 million from $345 million.
Pro forma EBITDA increased 63 percent to $574 million from $352 million for the fourth quarter of 2001. By
presenting EBITDA, pro forma revenues and pro forma EBITDA, Clear Channel intends to provide investors a
better understanding of the core operating results and underlying trends to measure past performance as well
as prospects for the future. Clear Channel evaluates operating performance based on several measures,
including EBITDA, as Clear Channel believes it is an important measure of the operational strength of its
businesses.

Clear Channel reported net earnings for the fourth quarter of $184 million, or $0.30 per diluted share. This
compares to a net loss of $366 million or a net loss of $0.61 per diluted share for the fourth quarter 2001.
Assuming the adoption of FAS 142 “Goodwill and Other Intangibles” had occurred at the beginning of 2001,
the Company would have reported a net loss of $691 thousand or $0.00 per diluted share for the fourth quarter
of 2001.

For the full year, the Company reported revenues of $8.42 billion, an increase of 6 percent when compared to
revenues of $7.97 billion for the same period in 2001. On a pro forma basis, 2002 revenues grew 2 percent to
$8.35 billion compared with revenues of $8.21 billion in 2001. EBITDA for 2002 increased 14 percent over
2001, to $2.19 billion from $1.92 billion. Pro forma EBITDA increased 12 percent to $2.18 billion from $1.95
billion for 2001.

The Company reported net earnings, before cumulative effect of a change in accounting principle, of $725
million, or $1.18 per diluted share for 2002. This compares to a net loss of $1.14 billion or a net loss of $1.93
per diluted share in 2001. Assuming the adoption of FAS 142 “Goodwill and Other Intangibles” had occurred
at the beginning of 2001, net earnings would have been $249 million or $0.41 per diluted share for 2001,
representing an increase of 188 percent on a per share basis.

The Company's 2002 net earnings includes approximately $49.1 million of pre-tax gains, $0.05 per share after
tax, related to the sale of a television license, extinguishment of long-term debt, sale of a marketable security,
sale of other assets and a litigation settlement. Excluding those gains, net earnings per share would have
been $1.13.


                                                                                                                        1
For 2002, cash flow from operating activities was $1.75 billion, cash flow used in investing activities was $627
million and cash flow used in financing activities was $1.11 billion for a net increase in cash of $15 million.
Free cash flow (defined as EBITDA less interest expense, adjusted current taxes and non-revenue producing
capital expenditures – see reconciliation of cash flow from operating activities to free cash flow on page 4)
increased 54 percent to $1.25 billion or $1.99 per diluted share, compared to $812 million or $1.34 per diluted
share for 2001. Clear Channel believes free cash flow is an important measure of the financial strength of its
businesses. By presenting free cash flow, Clear Channel intends to provide investors a better understanding
of the Company’s ability to pay down debt, invest in its businesses and provide a return to shareholders.

Lowry Mays, Chairman and Chief Executive Officer of Clear Channel said, “I am very proud of the financial
results that we delivered to our shareholders this year, despite a challenging industry and economic
environment. We are also proud of the value we have created not just for our investors but for our listeners
and advertisers/customers over the past thirty years. We could not have achieved that success, and created
that value, if we were not acutely sensitive to the needs of the listeners and communities we serve, and if we
did not do a quality job of meeting those needs year in and year out.”

Mr. Mays added, “Clear Channel was founded on integrity and strong values 30 years ago and those same
values guide us today. We are determined to deliver superior value to our customers, patrons and listeners.
We believe that operational and financial excellence and outstanding service to our advertisers, customers and
communities are the standards by which we should be judged, and we encourage and nourish those core
values.”

Mr. Mark Mays, President and Chief Operating Officer said, “One of Clear Channel’s biggest strengths has
always been our ability to develop an outstanding team. We have a talented, deep, dedicated group of people
who guide each of our businesses in the local markets. We are very proud of the many individual employees
in each of our individual markets who work hard to build their businesses. Their efforts in tailoring the vast
resources of Clear Channel to best serve the specific needs of their local marketplaces is the key to our
success. Our success is evidence of their skill, dedication, commitment and determination as they fulfill their
commitment to their communities. We are very proud of the results. We are very proud of the Clear Channel
family; they work hard every day to deliver quality to the customers, consumers and communities we serve.”

Segment Operating Results

RADIO: For the fourth quarter of 2002, revenues increased 10 percent to $979 million and EBITDA increased
43 percent to $428 million over the same period in 2001. On a pro forma basis, revenues for the fourth quarter
of 2002 increased 9 percent and EBITDA increased 42 percent when compared to the fourth quarter of 2001.
For the full year of 2002, Clear Channel Radio revenues increased 8 percent to $3.72 billion and EBITDA
increased 18 percent to $1.59 billion, when compared to the same period in 2001. On a pro forma basis,
revenues for the full year 2002 increased 6 percent and EBITDA increased 17 percent when compared to
2001.

OUTDOOR: For the fourth quarter of 2002, revenues increased 17 percent and EBITDA increased 44 percent
over the same period in 2001. On a pro forma basis, revenues for the fourth quarter of 2002 increased 5
percent and EBITDA increased 31 percent when compared to the fourth quarter of 2001. For the full year of
2002, Clear Channel Outdoor revenues increased 6 percent to $1.86 billion and EBITDA decreased 4 percent
to $506 million, when compared to the same period in 2001. On a pro forma basis, revenues for the full year
2002 decreased 3 percent and EBITDA decreased 10 percent when compared to 2001.

ENTERTAINMENT: For the fourth quarter of 2002, revenues increased 28 percent to $562 million and
EBITDA increased from a negative $18 million in 2001 to a positive $12 million in 2002. On a pro forma basis,
revenues for the fourth quarter of 2002 increased 26 percent and EBITDA increased from a negative $21
million in 2001 to a positive $11 million in 2002. For the full year of 2002, Clear Channel Entertainment
revenues declined 1 percent to $2.45 billion and EBITDA increased 5 percent to $158 million, when compared
to the same period in 2001. On a pro forma basis, revenues for the full year 2002 decreased 4 percent and
EBITDA increased 2 percent when compared to 2001.

                                                                                                          2
Operating Results
(in $000s)


Below are the consolidated reported and pro forma results for the fourth quarter of 2002 versus 2001.

                                                                   4th Quarter
      Revenue
                                                 Reported                                Pro forma (a)
                                   2002                      % Change          2002           2001                      % Change
                                                   2001
                                    $979,015                      9.9%          $979,015       $902,601                       8.5%
      Radio                                         $890,625
                                     538,299                     17.3%           512,871        488,609                       5.0%
      Outdoor                                        458,965
                                     562,499         439,409     28.0%           549,936        437,029                      25.8%
      Entertainment
                                     166,280           109,064          52.5%             166,280           135,574            22.6%
      Other
                                     (36,360)          (35,917)           1.2%            (36,360)          (35,917)             1.2%
      Eliminations
                                  $2,209,733       $1,862,146           18.7%          $2,171,742       $1,927,896             12.6%
      Consolidated

                                                                           4th Quarter
     EBITDA
                                                   Reported                                          Pro forma (a)
                                   2002                            % Change              2002            2001           % Change
                                                    2001
                                    $428,201                            43.2%             $428,201        $300,863           42.3%
     Radio                                           $299,130
                                     155,001                            43.9%              151,243          115,088          31.4%
     Outdoor                                          107,723
                                       12,209         (18,307)                   *          11,106          (21,114)                  *
     Entertainment
                                       37,310             2,758       1,252.8%              37,310             6,921           439.1%
     Other
                                     (53,813)          (46,602)           15.5%           (53,813)          (49,472)             8.8%
     Corporate
                                    $578,908          $344,702            67.9%          $574,047          $352,286             62.9%
     Consolidated

  (a) Includes adjustments to the prior period (2001) for all acquisitions for the same time frame as actually owned in the current
      period (2002). The 2002 pro forma include an adjustment for foreign exchange to present results in 2001 constant dollars.
      Divestitures are excluded from both 2001 and 2002.
  (*) Not meaningful


Below are the consolidated reported and pro forma results for the full year of 2002 versus 2001.

                                                                      Full Year
      Revenue
                                                 Reported                                  Pro forma (b)
                                   2002                       % Change          2002            2001                    % Change
                                                   2001
                                  $3,717,243                       7.6%         $3,717,243     $3,497,376                     6.3%
      Radio                                       $3,455,553
                                    1,859,643                      6.4%          1,814,546       1,860,266                   (2.5%)
      Outdoor                                       1,748,031
                                   2,447,302        2,477,640     (1.2%)         2,418,971       2,511,146                     (3.7%)
      Entertainment
                                     528,374           423,651          24.7%             528,374           480,752              9.9%
      Other
                                    (131,507)        (134,872)          (2.5%)           (131,507)        (134,872)            (2.5%)
      Eliminations
                                  $8,421,055        $7,970,003            5.7%         $8,347,627       $8,214,668               1.6%
      Consolidated


                                                                                                                          3
Full Year
   EBITDA
                                                        Reported                                                 Pro forma (b)
                                      2002                          % Change          2002                        2001         % Change
                                                         2001
                                      $1,591,104                        17.8%         $1,591,104                  $1,358,137         17.2%
   Radio                                                 $1,350,834
                                         505,551                        (4.1%)           499,229                     555,054       (10.1%)
   Outdoor                                                  527,350
                                          157,648           150,531      4.7%            153,984                       151,127                 1.9%
   Entertainment
                                          113,991               74,582       52.8%                 113,991              77,514              47.1%
   Other
                                        (176,370)           (187,434)        (5.9%)               (176,370)         (193,607)               (8.9%)
   Corporate
                                      $2,191,924          $1,915,863         14.4%            $2,181,938          $1,948,225                12.0%
   Consolidated

   (b) Includes adjustments to the prior period (2001) for all acquisitions for the same time frame as actually owned in the current
       period (2002). The 2002 pro forma include an adjustment for foreign exchange to present results in 2001 constant dollars.
       Divestitures are excluded from both 2001 and 2002.


Consolidated
Reconciliation of EBITDA to Operating Income
(in $000s)                               Three Months Ended December 31                                                Full Year
                                              2002                2001                                           2002                2001
EBITDA                                       $578,908           $344,702                                      $2,191,924         $1,915,863
Less:
   Non-cash compensation expense                1,217               2,146                                          5,436                    17,077
   Depreciation and amortization              171,584             651,108                                        620,766                 2,562,480
Operating income                             $406,107          ($308,552)                                     $1,565,722                ($663,694)

Free Cash Flow
(in $000s, except per share data)

                                                    Three Months Ended December 31                                          Full Year
                                                        2002               2001                               2002                       2001
EBITDA                                             $578,908          $344,702                             $2,191,924                $1,915,863
Interest Expense                                    (106,134)         (131,394)                             (432,786)                 (560,077)
Current Tax Benefit (Expense) (c)                     (70,024)          92,224                              (205,216)                 (125,658)
Non-Revenue Producing Capital
Expenditures                                        (129,211)               (141,700)                           (305,731)               (417,900)
  Total Free Cash Flow                              $273,539                $163,832                          $1,248,191                $812,228
  Total Free Cash Flow Per Share                        $0.43                   $0.27                              $1.99                   $1.34
  Weighted-Average Shares Outstanding (d)            629,294                 602,546                             627,440                 605,439

   (c) Current tax benefit (expense) reflects adjustments for non-routine deferred tax items of ($151,960) and ($56,073) for the fourth
       quarter and full year of 2002, and ($68,295) for both the fourth quarter and full year of 2001, respectively.
   (d) The 2001 amounts include an additional 4,733 shares and 13,474 shares for the three months and twelve months ended
       December 31, 2001, used to calculate both adjusted earnings per share giving effect to FAS 142 and free cash flow per share.

Reconciliation of Cash Flow From Operating Activities to
Free Cash Flow
(in $000s)                                      Three Months Ended December 31                                     Full Year
                                                       2002           2001                                   2002            2001
Net cash provided by operating activities       $493,864         $255,454                                $1,747,694       $609,587

 Non-Routine Deferred Tax Items                              (151,960)                (68,295)              (56,073)               (68,295)
 Changes in Operating Assets and Liabilities                   52,403                128,033               (129,879)               696,190
 Non-Revenue Producing Capital Expenditures                  (129,211)              (141,700)              (305,731)              (417,900)
 Other                                                          8,443                   (9,660)               (7,820)                (7,354)
Free Cash Flow                                              $273,539                $163,832             $1,248,191              $812,228


                                                                                                                                    4
Selected Balance Sheet Information
(in $000s)
                                                                              December 31,     December 31,
                                                                                  2002             2001
          Cash and Cash Equivalents                                                 $170,086        $154,744
          Total Current Assets                                                    $2,123,495      $1,941,299
          Net Property, Plant and Equipment                                       $4,242,812      $3,956,749
          Total Assets                                                           $27,672,153     $47,603,142
          Current Liabilities (excluding current portion of long-term debt)       $1,614,107      $1,444,636
          Long-Term Debt (including current portion of long-term debt)            $8,778,622      $9,482,934
          Shareholders’ Equity                                                   $14,210,092     $29,736,063


Capital Expenditures
(in $000s)

Capital expenditures for the fourth quarter and full year 2002 were:

                                                                              Three Months       Full Year
                                                                                 Ended            Ended
                                                                              December 31      December 31
          Recurring                                                                  $38,295        $116,315
          Non-recurring projects                                                      90,916          189,416
          Revenue producing                                                           80,904          242,914
            Total capital expenditures                                              $210,115        $548,645

The Company defines recurring capital expenditures as those expenditures that are required each year. Non-
recurring projects are expenditures arising primarily from the integration of newly acquired entities. Revenue
producing is discretionary capital investment for new revenue streams.

Liquidity and Financial Position

At December 31, 2002, Clear Channel had long-term debt of:

(In $ Millions)
Bank Credit Facilities                                            $2,152.3
Public Notes                                                       5,655.9
Convertible Notes                                                    769.7
Other Debt                                                           200.7
  Total                                                           $8,778.6

Leverage, defined as debt(e), net of cash, divided by the trailing 12-month pro forma EBITDA(f), was 3.9x at
December 31, 2002.


         As defined by Clear Channel’s credit facilities, debt is long-term debt of $8,778.6 plus letters of credit
   (e)
         and guarantees of third party debt of $241.3 million; plus deferred purchase consideration of $34.2
         million included in other long-term liabilities; less fair value of interest rate swaps of $119.8 million; and,
         less purchase accounting premiums of $86.7 million.
         As defined by Clear Channel’s credit facilities, pro forma EBITDA is the trailing twelve-month EBITDA
   (f)
         adjusted to include EBITDA of any assets acquired in the trailing twelve-month period.


                                                                                                                 5
In January 2003, Clear Channel issued $300 million of 4 5/8% Senior Notes due 2008 and $500 million of 5
¾% Senior Notes due 2013. The proceeds of the issuance were used to pay down the Company’s bank credit
facilities and to finance the redemption of AMFM Operating, Inc.’s 8.125% Senior Subordinated Notes due
2007 and 8.75% Senior Subordinated Notes due 2007. The AMFM notes were redeemed pursuant to call
provisions in the indentures.

Clear Channel has three domestic bank credit facilities with $2.56 billion available at February 25, 2003. The
Company currently has approximately $1.25 billion of public debt maturing in 2003 in addition to other
indebtedness, including notes and convertible notes, maturing in later years. The Company intends to utilize
the existing capacity under its bank facilities and other available funds to redeem or repurchase any or all of
such debt through open market purchases, privately negotiated transactions, or other means.

Guidance

The Company believes that, based on the current economic and advertising environment, 1st Quarter 2003
EBITDA will be in the range of $370-390 million.

Conference Call

Our year-end and 4th quarter 2002 earnings conference call will be held today at 9:00 a.m. Eastern Time. The
dial-in number is 801-303-7416 and a pass code is not required. Please call 10 minutes prior to the beginning
of the call to ensure that you are connected before the start of the presentation. The teleconference will also
be available via a live audio cast on the Company’s website, located at http://www.clearchannel.com. A replay
of the call will be available for 72 hours after the conference call. The replay number is 402-220-1490 and the
pass code 1026. The audio cast will also be archived on the Company’s website and will be available
beginning 24 hours after the call for a period of one week.


About Clear Channel Worldwide

Visit our website at http://www.clearchannel.com.

Clear Channel Worldwide, headquartered in San Antonio, Texas, is a global leader in the out-of-home
advertising and entertainment industries with radio and television stations, outdoor advertising displays, and
live entertainment productions and venues throughout the US and in 65 countries around the world.

For further information contact:
Investors
Randy Palmer
Vice President of Investor Relations
(210) 832-3315

Media
Diane Warren
Vice President of Communications
(210) 832-3509

The numbers contained within this release are unaudited. Certain statements in this release constitute “forward-looking
statements” within the meaning of the Private Securities Litigation Reform Act of 1995. Such forward-looking statements
involve known and unknown risks, uncertainties and other factors which may cause the actual results, performance or
achievements of the Company to be materially different from any future results, performance or achievements expressed or
implied by such forward-looking statements. The words or phrases “guidance,” “expect,” “anticipate,” “estimates” and
“forecast” and similar words or expressions are intended to identify such forward-looking statements. In addition, any
statements that refer to expectations or other characterizations of future events or circumstances are forward-looking
statements. Various risks that could cause future results to differ from those expressed by the forward-looking statements
included in this release include, but are not limited to: changes in economic conditions in the U.S. and in other countries in
which Clear Channel currently does business (both general and relative to the advertising and entertainment industries);

                                                                                                                       6
fluctuations in interest rates; changes in industry conditions; changes in operating performance; shifts in population and
other demographics; changes in the level of competition for advertising dollars; fluctuations in operating costs; technological
changes and innovations; changes in labor conditions; changes in governmental regulations and policies and actions of
regulatory bodies; fluctuations in exchange rates and currency values; changes in tax rates; changes in capital expenditure
requirements and access to capital markets. Other key risks are described in the Clear Channel Communications’ reports
filed with the U.S. Securities and Exchange Commission. Except as otherwise stated in this news announcement, Clear
Channel Communications does not undertake any obligation to publicly update or revise any forward-looking statements
because of new information, future events or otherwise.


                                                                                                                      7
FINANCIAL HIGHLIGHTS
                                           Clear Channel Communications, Inc. and Subsidiaries
                                                                 Unaudited
                                               (In thousands of dollars, except per share data)


                                                                    Three months ended                             Twelve months ended
                                                                       December 31,                                   December 31,
                                                                                                    %                                                  %
                                                                    2002             2001          Change            2002               2001         Change

Revenue                                                       $2,209,733        $1,862,146            19%        $8,421,055         $7,970,003             6%
Divisional operating expenses                                  1,577,012         1,470,842                        6,052,761          5,866,706
Operating cash flow                                              632,721           391,304            62%         2,368,294          2,103,297            13%
Corporate expenses                                                53,813            46,602                          176,370            187,434
EBITDA as adjusted (1)                                           578,908           344,702            68%         2,191,924          1,915,863           14%

Non-cash compensation expense                                         1,217           2,146                           5,436             17,077
Depreciation and amortization                                       171,584         651,108                         620,766          2,562,480
Operating Income                                                    406,107        (308,552)                      1,565,722           (663,694)

Interest expense                                        106,134                     131,394                          432,786            560,077
Gain (loss) on sale of assets related to mergers            -                      (156,316)                           3,991           (213,706)
Gain (loss) on marketable securities                      4,012                      (3,692)                          (3,096)            25,820
Equity in earnings (loss) of nonconsolidated affiliates 10,309                       (1,226)                          26,928             10,393
Other income (expense) - net                             (5,145)                    171,316                           57,430            152,267
Income (loss) before income taxes and cumulative
   effect of a change in accounting principle                       309,149        (429,864)                      1,218,189         (1,248,997)

Income tax benefit (expense):
   Current                                       81,936                             160,519                         (149,143)           (57,363)
   Deferred                                    (207,141)                            (96,254)                        (344,223)           162,334
Income before cumulative effect of a change in
   accounting principle (FAS 142)              $183,944                           ($365,599)                       $724,823         #########


Income before cumulative effect of a change in
   accounting principle per share:
   Basic:                                                             $0.30           ($0.61)                           $1.20             ($1.93)

   Diluted:                                                           $0.30           ($0.61)                           $1.18             ($1.93)
   Net income per share adjusted for adoption of FAS 142 (2):
   Basic                                               $0.30                           $0.00         N/A                $1.20              $0.42        186%
   Diluted                                             $0.30                           $0.00         N/A                $1.18              $0.41        188%


   Free cash flow (3)                                           $273,539           $163,832           67%        $1,248,191           $812,228            54%
   Free cash flow per share                                        $0.43              $0.27           59%             $1.99              $1.34            49%


   Weighted Average Shares Outstanding - Diluted (4) 629,294                        597,813                          627,440            591,965

(1) Defined as cash flow from operations less corporate expenses.
(2) Adjusted to present the impact of FAS 142 on net income per share as if FAS 142 had been in effect for the three months and the year ended December 31, 2001.
(3) Defined as EBITDA as adjusted less interest expense, tax expense and non-revenue producing capital expenditures.
(4) The 2001 amounts do not include an additional 4,733 shares and 13,474 shares for the three months and the year ended December 31, 2001 used to calculate
       both adjusted earnings per share as required by FAS 142 and free cash flow per share.

More Related Content

What's hot

news corp 4th Qtr - FY04 - June 30, 2004
news corp 4th Qtr - FY04 - June 30, 2004 news corp 4th Qtr - FY04 - June 30, 2004
news corp 4th Qtr - FY04 - June 30, 2004 finance9
 
walt disney Quarter 2004 3rd
walt disney  Quarter 2004 3rdwalt disney  Quarter 2004 3rd
walt disney Quarter 2004 3rdfinance7
 
clearchannel 38
clearchannel 38clearchannel 38
clearchannel 38finance31
 
walt disney Quarter2002 2nd
walt disney  Quarter2002 2ndwalt disney  Quarter2002 2nd
walt disney Quarter2002 2ndfinance7
 
clearchannel 24
clearchannel 24clearchannel 24
clearchannel 24finance31
 
clearchannel 266
clearchannel 266clearchannel 266
clearchannel 266finance31
 
walt disney Quarter2001 4th
walt disney  Quarter2001 4thwalt disney  Quarter2001 4th
walt disney Quarter2001 4thfinance7
 
clearchannel 290
clearchannel 290clearchannel 290
clearchannel 290finance31
 
clearchannel 39
clearchannel 39clearchannel 39
clearchannel 39finance31
 
walt disney Quarter 2003 4th
walt disney  Quarter 2003 4thwalt disney  Quarter 2003 4th
walt disney Quarter 2003 4thfinance7
 
walt disney Quarter 2003 1st
walt disney  Quarter 2003 1stwalt disney  Quarter 2003 1st
walt disney Quarter 2003 1stfinance7
 
walt disney Quarter2001 2nd
walt disney  Quarter2001 2ndwalt disney  Quarter2001 2nd
walt disney Quarter2001 2ndfinance7
 
walt disney Quarter2002 3rd
walt disney  Quarter2002 3rdwalt disney  Quarter2002 3rd
walt disney Quarter2002 3rdfinance7
 
walt disney Quarter 2004 1st
walt disney  Quarter 2004 1stwalt disney  Quarter 2004 1st
walt disney Quarter 2004 1stfinance7
 
walt disney Quarter 2003 3rd
walt disney  Quarter 2003 3rdwalt disney  Quarter 2003 3rd
walt disney Quarter 2003 3rdfinance7
 
1 q16 earnings-presentation-final
1 q16 earnings-presentation-final1 q16 earnings-presentation-final
1 q16 earnings-presentation-final
investorswci
 
2006/110301f
2006/110301f2006/110301f
2006/110301ffinance21
 
walt disney Quarter 2005 3rd
walt disney  Quarter 2005 3rdwalt disney  Quarter 2005 3rd
walt disney Quarter 2005 3rdfinance7
 
4Q 2015 Earnings Presentation
4Q 2015 Earnings Presentation4Q 2015 Earnings Presentation
4Q 2015 Earnings Presentation
irbgcpartners
 
Duke Energy 4Q/05_CIN
Duke Energy 4Q/05_CINDuke Energy 4Q/05_CIN
Duke Energy 4Q/05_CINfinance21
 

What's hot (20)

news corp 4th Qtr - FY04 - June 30, 2004
news corp 4th Qtr - FY04 - June 30, 2004 news corp 4th Qtr - FY04 - June 30, 2004
news corp 4th Qtr - FY04 - June 30, 2004
 
walt disney Quarter 2004 3rd
walt disney  Quarter 2004 3rdwalt disney  Quarter 2004 3rd
walt disney Quarter 2004 3rd
 
clearchannel 38
clearchannel 38clearchannel 38
clearchannel 38
 
walt disney Quarter2002 2nd
walt disney  Quarter2002 2ndwalt disney  Quarter2002 2nd
walt disney Quarter2002 2nd
 
clearchannel 24
clearchannel 24clearchannel 24
clearchannel 24
 
clearchannel 266
clearchannel 266clearchannel 266
clearchannel 266
 
walt disney Quarter2001 4th
walt disney  Quarter2001 4thwalt disney  Quarter2001 4th
walt disney Quarter2001 4th
 
clearchannel 290
clearchannel 290clearchannel 290
clearchannel 290
 
clearchannel 39
clearchannel 39clearchannel 39
clearchannel 39
 
walt disney Quarter 2003 4th
walt disney  Quarter 2003 4thwalt disney  Quarter 2003 4th
walt disney Quarter 2003 4th
 
walt disney Quarter 2003 1st
walt disney  Quarter 2003 1stwalt disney  Quarter 2003 1st
walt disney Quarter 2003 1st
 
walt disney Quarter2001 2nd
walt disney  Quarter2001 2ndwalt disney  Quarter2001 2nd
walt disney Quarter2001 2nd
 
walt disney Quarter2002 3rd
walt disney  Quarter2002 3rdwalt disney  Quarter2002 3rd
walt disney Quarter2002 3rd
 
walt disney Quarter 2004 1st
walt disney  Quarter 2004 1stwalt disney  Quarter 2004 1st
walt disney Quarter 2004 1st
 
walt disney Quarter 2003 3rd
walt disney  Quarter 2003 3rdwalt disney  Quarter 2003 3rd
walt disney Quarter 2003 3rd
 
1 q16 earnings-presentation-final
1 q16 earnings-presentation-final1 q16 earnings-presentation-final
1 q16 earnings-presentation-final
 
2006/110301f
2006/110301f2006/110301f
2006/110301f
 
walt disney Quarter 2005 3rd
walt disney  Quarter 2005 3rdwalt disney  Quarter 2005 3rd
walt disney Quarter 2005 3rd
 
4Q 2015 Earnings Presentation
4Q 2015 Earnings Presentation4Q 2015 Earnings Presentation
4Q 2015 Earnings Presentation
 
Duke Energy 4Q/05_CIN
Duke Energy 4Q/05_CINDuke Energy 4Q/05_CIN
Duke Energy 4Q/05_CIN
 

Similar to clearchannel 32

Press Release 4 Q02 Tele Celular Sul En
Press Release 4 Q02   Tele Celular Sul EnPress Release 4 Q02   Tele Celular Sul En
Press Release 4 Q02 Tele Celular Sul EnTIM RI
 
aon 4Q 2008_Earnings Release Final
aon  4Q 2008_Earnings Release Finalaon  4Q 2008_Earnings Release Final
aon 4Q 2008_Earnings Release Finalfinance27
 
raytheonQ4 Earnings Release
raytheonQ4 Earnings ReleaseraytheonQ4 Earnings Release
raytheonQ4 Earnings Releasefinance12
 
dover 4Q05_Release
dover 4Q05_Releasedover 4Q05_Release
dover 4Q05_Releasefinance30
 
clearchannel 35
clearchannel 35clearchannel 35
clearchannel 35finance31
 
qwest communications Q_4Q07_ER
qwest communications Q_4Q07_ERqwest communications Q_4Q07_ER
qwest communications Q_4Q07_ERfinance19
 
clearchannel 23
clearchannel 23clearchannel 23
clearchannel 23finance31
 
air products & chemicals fy 08 q2 earnings
air products & chemicals fy 08 q2 earningsair products & chemicals fy 08 q2 earnings
air products & chemicals fy 08 q2 earningsfinance26
 
morgan stanley Earnings Archive 2001 1st
morgan stanley Earnings Archive 2001 1st morgan stanley Earnings Archive 2001 1st
morgan stanley Earnings Archive 2001 1st finance2
 
raytheon Q4 Earnings Presentation
raytheon Q4 Earnings Presentationraytheon Q4 Earnings Presentation
raytheon Q4 Earnings Presentationfinance12
 
Q1 2009 Earning Report of Baldor Electric Company
Q1 2009 Earning Report of Baldor Electric Company Q1 2009 Earning Report of Baldor Electric Company
Q1 2009 Earning Report of Baldor Electric Company earningreport earningreport
 
Invacare Corporation Fourth Quarter & Full year 2019 results
Invacare Corporation Fourth Quarter & Full year 2019 resultsInvacare Corporation Fourth Quarter & Full year 2019 results
Invacare Corporation Fourth Quarter & Full year 2019 results
rperezfont
 
bnsf 4Q 2002 Investors Report
bnsf 4Q 2002 Investors Reportbnsf 4Q 2002 Investors Report
bnsf 4Q 2002 Investors Reportfinance16
 
air products & chemicals Q4 FY 08 earnings
air products & chemicals Q4 FY 08 earningsair products & chemicals Q4 FY 08 earnings
air products & chemicals Q4 FY 08 earningsfinance26
 
Q4 2006 Earnings Release
	Q4 2006 Earnings Release	Q4 2006 Earnings Release
Q4 2006 Earnings Releasefinance7
 
goodrich 1Q08slides
goodrich  1Q08slidesgoodrich  1Q08slides
goodrich 1Q08slidesfinance44
 

Similar to clearchannel 32 (20)

CBS 4q 02
CBS 4q 02CBS 4q 02
CBS 4q 02
 
Press Release 4 Q02 Tele Celular Sul En
Press Release 4 Q02   Tele Celular Sul EnPress Release 4 Q02   Tele Celular Sul En
Press Release 4 Q02 Tele Celular Sul En
 
aon 4Q 2008_Earnings Release Final
aon  4Q 2008_Earnings Release Finalaon  4Q 2008_Earnings Release Final
aon 4Q 2008_Earnings Release Final
 
raytheonQ4 Earnings Release
raytheonQ4 Earnings ReleaseraytheonQ4 Earnings Release
raytheonQ4 Earnings Release
 
dover 4Q05_Release
dover 4Q05_Releasedover 4Q05_Release
dover 4Q05_Release
 
Q3 2009 Earning Report of Accenture
Q3 2009 Earning Report of AccentureQ3 2009 Earning Report of Accenture
Q3 2009 Earning Report of Accenture
 
Release 2Q00
Release 2Q00Release 2Q00
Release 2Q00
 
clearchannel 35
clearchannel 35clearchannel 35
clearchannel 35
 
qwest communications Q_4Q07_ER
qwest communications Q_4Q07_ERqwest communications Q_4Q07_ER
qwest communications Q_4Q07_ER
 
clearchannel 23
clearchannel 23clearchannel 23
clearchannel 23
 
air products & chemicals fy 08 q2 earnings
air products & chemicals fy 08 q2 earningsair products & chemicals fy 08 q2 earnings
air products & chemicals fy 08 q2 earnings
 
CBS qr2q 02
CBS qr2q 02CBS qr2q 02
CBS qr2q 02
 
morgan stanley Earnings Archive 2001 1st
morgan stanley Earnings Archive 2001 1st morgan stanley Earnings Archive 2001 1st
morgan stanley Earnings Archive 2001 1st
 
raytheon Q4 Earnings Presentation
raytheon Q4 Earnings Presentationraytheon Q4 Earnings Presentation
raytheon Q4 Earnings Presentation
 
Q1 2009 Earning Report of Baldor Electric Company
Q1 2009 Earning Report of Baldor Electric Company Q1 2009 Earning Report of Baldor Electric Company
Q1 2009 Earning Report of Baldor Electric Company
 
Invacare Corporation Fourth Quarter & Full year 2019 results
Invacare Corporation Fourth Quarter & Full year 2019 resultsInvacare Corporation Fourth Quarter & Full year 2019 results
Invacare Corporation Fourth Quarter & Full year 2019 results
 
bnsf 4Q 2002 Investors Report
bnsf 4Q 2002 Investors Reportbnsf 4Q 2002 Investors Report
bnsf 4Q 2002 Investors Report
 
air products & chemicals Q4 FY 08 earnings
air products & chemicals Q4 FY 08 earningsair products & chemicals Q4 FY 08 earnings
air products & chemicals Q4 FY 08 earnings
 
Q4 2006 Earnings Release
	Q4 2006 Earnings Release	Q4 2006 Earnings Release
Q4 2006 Earnings Release
 
goodrich 1Q08slides
goodrich  1Q08slidesgoodrich  1Q08slides
goodrich 1Q08slides
 

More from finance31

western resources AReport
western resources AReportwestern resources AReport
western resources AReportfinance31
 
western resources a_ar2006final
western resources a_ar2006finalwestern resources a_ar2006final
western resources a_ar2006finalfinance31
 
western resources _ar2007
western resources _ar2007western resources _ar2007
western resources _ar2007finance31
 
c.h. robinson worldwide_ar07a
c.h. robinson worldwide_ar07ac.h. robinson worldwide_ar07a
c.h. robinson worldwide_ar07afinance31
 
c.h. robinson worldwide10K_2007
c.h. robinson worldwide10K_2007c.h. robinson worldwide10K_2007
c.h. robinson worldwide10K_2007finance31
 
c.h. robinson worldwideproxy_2008
c.h. robinson worldwideproxy_2008c.h. robinson worldwideproxy_2008
c.h. robinson worldwideproxy_2008finance31
 
KBHOME_q103_10q
KBHOME_q103_10qKBHOME_q103_10q
KBHOME_q103_10qfinance31
 
KBHOME_DRSBOOKLET_2005Version
KBHOME_DRSBOOKLET_2005VersionKBHOME_DRSBOOKLET_2005Version
KBHOME_DRSBOOKLET_2005Versionfinance31
 
KBHOME_letter
KBHOME_letterKBHOME_letter
KBHOME_letterfinance31
 
KB_Home_Milestones_0808
KB_Home_Milestones_0808KB_Home_Milestones_0808
KB_Home_Milestones_0808finance31
 
KBHOME_q103_10q
KBHOME_q103_10qKBHOME_q103_10q
KBHOME_q103_10qfinance31
 
KBHOME_q203_10q
KBHOME_q203_10qKBHOME_q203_10q
KBHOME_q203_10qfinance31
 
KBHOME_q203_10q
KBHOME_q203_10qKBHOME_q203_10q
KBHOME_q203_10qfinance31
 
KBHOME_q303_10q
KBHOME_q303_10qKBHOME_q303_10q
KBHOME_q303_10qfinance31
 
KBHOME_q303_10q
KBHOME_q303_10qKBHOME_q303_10q
KBHOME_q303_10qfinance31
 
KBHOME_q20410q
KBHOME_q20410qKBHOME_q20410q
KBHOME_q20410qfinance31
 

More from finance31 (20)

western resources AReport
western resources AReportwestern resources AReport
western resources AReport
 
western resources a_ar2006final
western resources a_ar2006finalwestern resources a_ar2006final
western resources a_ar2006final
 
western resources _ar2007
western resources _ar2007western resources _ar2007
western resources _ar2007
 
c.h. robinson worldwide_ar07a
c.h. robinson worldwide_ar07ac.h. robinson worldwide_ar07a
c.h. robinson worldwide_ar07a
 
c.h. robinson worldwide10K_2007
c.h. robinson worldwide10K_2007c.h. robinson worldwide10K_2007
c.h. robinson worldwide10K_2007
 
c.h. robinson worldwideproxy_2008
c.h. robinson worldwideproxy_2008c.h. robinson worldwideproxy_2008
c.h. robinson worldwideproxy_2008
 
chrw ar07a
chrw ar07achrw ar07a
chrw ar07a
 
chrw ar07a
chrw ar07achrw ar07a
chrw ar07a
 
KBHOME_q103_10q
KBHOME_q103_10qKBHOME_q103_10q
KBHOME_q103_10q
 
KBHOME_DRSBOOKLET_2005Version
KBHOME_DRSBOOKLET_2005VersionKBHOME_DRSBOOKLET_2005Version
KBHOME_DRSBOOKLET_2005Version
 
KBHOME_letter
KBHOME_letterKBHOME_letter
KBHOME_letter
 
KB_Home_Milestones_0808
KB_Home_Milestones_0808KB_Home_Milestones_0808
KB_Home_Milestones_0808
 
KBHOME_q103_10q
KBHOME_q103_10qKBHOME_q103_10q
KBHOME_q103_10q
 
KBHOME_q203_10q
KBHOME_q203_10qKBHOME_q203_10q
KBHOME_q203_10q
 
KBHOME_q203_10q
KBHOME_q203_10qKBHOME_q203_10q
KBHOME_q203_10q
 
KBHOME_q303_10q
KBHOME_q303_10qKBHOME_q303_10q
KBHOME_q303_10q
 
KBHOME_q303_10q
KBHOME_q303_10qKBHOME_q303_10q
KBHOME_q303_10q
 
KB10Q
KB10QKB10Q
KB10Q
 
KBHOME_q20410q
KBHOME_q20410qKBHOME_q20410q
KBHOME_q20410q
 
KB10Q
KB10QKB10Q
KB10Q
 

Recently uploaded

Exploring Abhay Bhutada’s Views After Poonawalla Fincorp’s Collaboration With...
Exploring Abhay Bhutada’s Views After Poonawalla Fincorp’s Collaboration With...Exploring Abhay Bhutada’s Views After Poonawalla Fincorp’s Collaboration With...
Exploring Abhay Bhutada’s Views After Poonawalla Fincorp’s Collaboration With...
beulahfernandes8
 
how to sell pi coins effectively (from 50 - 100k pi)
how to sell pi coins effectively (from 50 - 100k  pi)how to sell pi coins effectively (from 50 - 100k  pi)
how to sell pi coins effectively (from 50 - 100k pi)
DOT TECH
 
how to sell pi coins on Bitmart crypto exchange
how to sell pi coins on Bitmart crypto exchangehow to sell pi coins on Bitmart crypto exchange
how to sell pi coins on Bitmart crypto exchange
DOT TECH
 
Commercial Bank Economic Capsule - May 2024
Commercial Bank Economic Capsule - May 2024Commercial Bank Economic Capsule - May 2024
Commercial Bank Economic Capsule - May 2024
Commercial Bank of Ceylon PLC
 
managementaccountingunitiv-230422140105-dd17d80b.ppt
managementaccountingunitiv-230422140105-dd17d80b.pptmanagementaccountingunitiv-230422140105-dd17d80b.ppt
managementaccountingunitiv-230422140105-dd17d80b.ppt
SuseelaPalanimuthu
 
Poonawalla Fincorp and IndusInd Bank Introduce New Co-Branded Credit Card
Poonawalla Fincorp and IndusInd Bank Introduce New Co-Branded Credit CardPoonawalla Fincorp and IndusInd Bank Introduce New Co-Branded Credit Card
Poonawalla Fincorp and IndusInd Bank Introduce New Co-Branded Credit Card
nickysharmasucks
 
USDA Loans in California: A Comprehensive Overview.pptx
USDA Loans in California: A Comprehensive Overview.pptxUSDA Loans in California: A Comprehensive Overview.pptx
USDA Loans in California: A Comprehensive Overview.pptx
marketing367770
 
innovative-invoice-discounting-platforms-in-india-empowering-retail-investors...
innovative-invoice-discounting-platforms-in-india-empowering-retail-investors...innovative-invoice-discounting-platforms-in-india-empowering-retail-investors...
innovative-invoice-discounting-platforms-in-india-empowering-retail-investors...
Falcon Invoice Discounting
 
how to sell pi coins at high rate quickly.
how to sell pi coins at high rate quickly.how to sell pi coins at high rate quickly.
how to sell pi coins at high rate quickly.
DOT TECH
 
Isios-2024-Professional-Independent-Trustee-Survey.pdf
Isios-2024-Professional-Independent-Trustee-Survey.pdfIsios-2024-Professional-Independent-Trustee-Survey.pdf
Isios-2024-Professional-Independent-Trustee-Survey.pdf
Henry Tapper
 
how to sell pi coins in all Africa Countries.
how to sell pi coins in all Africa Countries.how to sell pi coins in all Africa Countries.
how to sell pi coins in all Africa Countries.
DOT TECH
 
The WhatsPump Pseudonym Problem and the Hilarious Downfall of Artificial Enga...
The WhatsPump Pseudonym Problem and the Hilarious Downfall of Artificial Enga...The WhatsPump Pseudonym Problem and the Hilarious Downfall of Artificial Enga...
The WhatsPump Pseudonym Problem and the Hilarious Downfall of Artificial Enga...
muslimdavidovich670
 
how can I sell/buy bulk pi coins securely
how can I sell/buy bulk pi coins securelyhow can I sell/buy bulk pi coins securely
how can I sell/buy bulk pi coins securely
DOT TECH
 
655264371-checkpoint-science-past-papers-april-2023.pdf
655264371-checkpoint-science-past-papers-april-2023.pdf655264371-checkpoint-science-past-papers-april-2023.pdf
655264371-checkpoint-science-past-papers-april-2023.pdf
morearsh02
 
Summary of financial results for 1Q2024
Summary of financial  results for 1Q2024Summary of financial  results for 1Q2024
Summary of financial results for 1Q2024
InterCars
 
GeM ppt in railway for presentation on gem
GeM ppt in railway  for presentation on gemGeM ppt in railway  for presentation on gem
GeM ppt in railway for presentation on gem
CwierAsn
 
when will pi network coin be available on crypto exchange.
when will pi network coin be available on crypto exchange.when will pi network coin be available on crypto exchange.
when will pi network coin be available on crypto exchange.
DOT TECH
 
The secret way to sell pi coins effortlessly.
The secret way to sell pi coins effortlessly.The secret way to sell pi coins effortlessly.
The secret way to sell pi coins effortlessly.
DOT TECH
 
Intro_Economics_ GPresentation Week 4.pptx
Intro_Economics_ GPresentation Week 4.pptxIntro_Economics_ GPresentation Week 4.pptx
Intro_Economics_ GPresentation Week 4.pptx
shetivia
 
Which Crypto to Buy Today for Short-Term in May-June 2024.pdf
Which Crypto to Buy Today for Short-Term in May-June 2024.pdfWhich Crypto to Buy Today for Short-Term in May-June 2024.pdf
Which Crypto to Buy Today for Short-Term in May-June 2024.pdf
Kezex (KZX)
 

Recently uploaded (20)

Exploring Abhay Bhutada’s Views After Poonawalla Fincorp’s Collaboration With...
Exploring Abhay Bhutada’s Views After Poonawalla Fincorp’s Collaboration With...Exploring Abhay Bhutada’s Views After Poonawalla Fincorp’s Collaboration With...
Exploring Abhay Bhutada’s Views After Poonawalla Fincorp’s Collaboration With...
 
how to sell pi coins effectively (from 50 - 100k pi)
how to sell pi coins effectively (from 50 - 100k  pi)how to sell pi coins effectively (from 50 - 100k  pi)
how to sell pi coins effectively (from 50 - 100k pi)
 
how to sell pi coins on Bitmart crypto exchange
how to sell pi coins on Bitmart crypto exchangehow to sell pi coins on Bitmart crypto exchange
how to sell pi coins on Bitmart crypto exchange
 
Commercial Bank Economic Capsule - May 2024
Commercial Bank Economic Capsule - May 2024Commercial Bank Economic Capsule - May 2024
Commercial Bank Economic Capsule - May 2024
 
managementaccountingunitiv-230422140105-dd17d80b.ppt
managementaccountingunitiv-230422140105-dd17d80b.pptmanagementaccountingunitiv-230422140105-dd17d80b.ppt
managementaccountingunitiv-230422140105-dd17d80b.ppt
 
Poonawalla Fincorp and IndusInd Bank Introduce New Co-Branded Credit Card
Poonawalla Fincorp and IndusInd Bank Introduce New Co-Branded Credit CardPoonawalla Fincorp and IndusInd Bank Introduce New Co-Branded Credit Card
Poonawalla Fincorp and IndusInd Bank Introduce New Co-Branded Credit Card
 
USDA Loans in California: A Comprehensive Overview.pptx
USDA Loans in California: A Comprehensive Overview.pptxUSDA Loans in California: A Comprehensive Overview.pptx
USDA Loans in California: A Comprehensive Overview.pptx
 
innovative-invoice-discounting-platforms-in-india-empowering-retail-investors...
innovative-invoice-discounting-platforms-in-india-empowering-retail-investors...innovative-invoice-discounting-platforms-in-india-empowering-retail-investors...
innovative-invoice-discounting-platforms-in-india-empowering-retail-investors...
 
how to sell pi coins at high rate quickly.
how to sell pi coins at high rate quickly.how to sell pi coins at high rate quickly.
how to sell pi coins at high rate quickly.
 
Isios-2024-Professional-Independent-Trustee-Survey.pdf
Isios-2024-Professional-Independent-Trustee-Survey.pdfIsios-2024-Professional-Independent-Trustee-Survey.pdf
Isios-2024-Professional-Independent-Trustee-Survey.pdf
 
how to sell pi coins in all Africa Countries.
how to sell pi coins in all Africa Countries.how to sell pi coins in all Africa Countries.
how to sell pi coins in all Africa Countries.
 
The WhatsPump Pseudonym Problem and the Hilarious Downfall of Artificial Enga...
The WhatsPump Pseudonym Problem and the Hilarious Downfall of Artificial Enga...The WhatsPump Pseudonym Problem and the Hilarious Downfall of Artificial Enga...
The WhatsPump Pseudonym Problem and the Hilarious Downfall of Artificial Enga...
 
how can I sell/buy bulk pi coins securely
how can I sell/buy bulk pi coins securelyhow can I sell/buy bulk pi coins securely
how can I sell/buy bulk pi coins securely
 
655264371-checkpoint-science-past-papers-april-2023.pdf
655264371-checkpoint-science-past-papers-april-2023.pdf655264371-checkpoint-science-past-papers-april-2023.pdf
655264371-checkpoint-science-past-papers-april-2023.pdf
 
Summary of financial results for 1Q2024
Summary of financial  results for 1Q2024Summary of financial  results for 1Q2024
Summary of financial results for 1Q2024
 
GeM ppt in railway for presentation on gem
GeM ppt in railway  for presentation on gemGeM ppt in railway  for presentation on gem
GeM ppt in railway for presentation on gem
 
when will pi network coin be available on crypto exchange.
when will pi network coin be available on crypto exchange.when will pi network coin be available on crypto exchange.
when will pi network coin be available on crypto exchange.
 
The secret way to sell pi coins effortlessly.
The secret way to sell pi coins effortlessly.The secret way to sell pi coins effortlessly.
The secret way to sell pi coins effortlessly.
 
Intro_Economics_ GPresentation Week 4.pptx
Intro_Economics_ GPresentation Week 4.pptxIntro_Economics_ GPresentation Week 4.pptx
Intro_Economics_ GPresentation Week 4.pptx
 
Which Crypto to Buy Today for Short-Term in May-June 2024.pdf
Which Crypto to Buy Today for Short-Term in May-June 2024.pdfWhich Crypto to Buy Today for Short-Term in May-June 2024.pdf
Which Crypto to Buy Today for Short-Term in May-June 2024.pdf
 

clearchannel 32

  • 1. Clear Channel Reports Year-End and Fourth Quarter 2002 Results • Fourth Quarter - Reported Revenues Increase 19% to $2.2 Billion, EBITDA As Adjusted increases 68% to $579 Million and Earnings per Diluted Share of $0.30 • Full Year – Reported Revenues Increase 6% to $8.4 Billion, EBITDA As Adjusted increases 14% to $2.2 Billion and Earnings per Diluted Share, before cumulative effect of a change in accounting principle, of $1.18, an increase of 188% *Statements listed above assume the adoption of FAS 142 occurred at the beginning of 2001 San Antonio, Texas February 25, 2003…Clear Channel Communications, Inc. (NYSE: CCU) today reported results for its fourth quarter and full year ended December 31, 2002. The Company’s reported revenues of $2.21 billion for the fourth quarter increased 19 percent over 2001 revenues of $1.86 billion. On a pro forma basis, quarterly revenues grew to $2.17 billion or an increase of 13 percent when compared with last year’s revenues of $1.93 billion. EBITDA As Adjusted (defined as revenue less divisional operating expenses and corporate expenses and referred to as EBITDA – see reconciliation to operating income on page 4) for the quarter increased 68 percent over 2001, to $579 million from $345 million. Pro forma EBITDA increased 63 percent to $574 million from $352 million for the fourth quarter of 2001. By presenting EBITDA, pro forma revenues and pro forma EBITDA, Clear Channel intends to provide investors a better understanding of the core operating results and underlying trends to measure past performance as well as prospects for the future. Clear Channel evaluates operating performance based on several measures, including EBITDA, as Clear Channel believes it is an important measure of the operational strength of its businesses. Clear Channel reported net earnings for the fourth quarter of $184 million, or $0.30 per diluted share. This compares to a net loss of $366 million or a net loss of $0.61 per diluted share for the fourth quarter 2001. Assuming the adoption of FAS 142 “Goodwill and Other Intangibles” had occurred at the beginning of 2001, the Company would have reported a net loss of $691 thousand or $0.00 per diluted share for the fourth quarter of 2001. For the full year, the Company reported revenues of $8.42 billion, an increase of 6 percent when compared to revenues of $7.97 billion for the same period in 2001. On a pro forma basis, 2002 revenues grew 2 percent to $8.35 billion compared with revenues of $8.21 billion in 2001. EBITDA for 2002 increased 14 percent over 2001, to $2.19 billion from $1.92 billion. Pro forma EBITDA increased 12 percent to $2.18 billion from $1.95 billion for 2001. The Company reported net earnings, before cumulative effect of a change in accounting principle, of $725 million, or $1.18 per diluted share for 2002. This compares to a net loss of $1.14 billion or a net loss of $1.93 per diluted share in 2001. Assuming the adoption of FAS 142 “Goodwill and Other Intangibles” had occurred at the beginning of 2001, net earnings would have been $249 million or $0.41 per diluted share for 2001, representing an increase of 188 percent on a per share basis. The Company's 2002 net earnings includes approximately $49.1 million of pre-tax gains, $0.05 per share after tax, related to the sale of a television license, extinguishment of long-term debt, sale of a marketable security, sale of other assets and a litigation settlement. Excluding those gains, net earnings per share would have been $1.13. 1
  • 2. For 2002, cash flow from operating activities was $1.75 billion, cash flow used in investing activities was $627 million and cash flow used in financing activities was $1.11 billion for a net increase in cash of $15 million. Free cash flow (defined as EBITDA less interest expense, adjusted current taxes and non-revenue producing capital expenditures – see reconciliation of cash flow from operating activities to free cash flow on page 4) increased 54 percent to $1.25 billion or $1.99 per diluted share, compared to $812 million or $1.34 per diluted share for 2001. Clear Channel believes free cash flow is an important measure of the financial strength of its businesses. By presenting free cash flow, Clear Channel intends to provide investors a better understanding of the Company’s ability to pay down debt, invest in its businesses and provide a return to shareholders. Lowry Mays, Chairman and Chief Executive Officer of Clear Channel said, “I am very proud of the financial results that we delivered to our shareholders this year, despite a challenging industry and economic environment. We are also proud of the value we have created not just for our investors but for our listeners and advertisers/customers over the past thirty years. We could not have achieved that success, and created that value, if we were not acutely sensitive to the needs of the listeners and communities we serve, and if we did not do a quality job of meeting those needs year in and year out.” Mr. Mays added, “Clear Channel was founded on integrity and strong values 30 years ago and those same values guide us today. We are determined to deliver superior value to our customers, patrons and listeners. We believe that operational and financial excellence and outstanding service to our advertisers, customers and communities are the standards by which we should be judged, and we encourage and nourish those core values.” Mr. Mark Mays, President and Chief Operating Officer said, “One of Clear Channel’s biggest strengths has always been our ability to develop an outstanding team. We have a talented, deep, dedicated group of people who guide each of our businesses in the local markets. We are very proud of the many individual employees in each of our individual markets who work hard to build their businesses. Their efforts in tailoring the vast resources of Clear Channel to best serve the specific needs of their local marketplaces is the key to our success. Our success is evidence of their skill, dedication, commitment and determination as they fulfill their commitment to their communities. We are very proud of the results. We are very proud of the Clear Channel family; they work hard every day to deliver quality to the customers, consumers and communities we serve.” Segment Operating Results RADIO: For the fourth quarter of 2002, revenues increased 10 percent to $979 million and EBITDA increased 43 percent to $428 million over the same period in 2001. On a pro forma basis, revenues for the fourth quarter of 2002 increased 9 percent and EBITDA increased 42 percent when compared to the fourth quarter of 2001. For the full year of 2002, Clear Channel Radio revenues increased 8 percent to $3.72 billion and EBITDA increased 18 percent to $1.59 billion, when compared to the same period in 2001. On a pro forma basis, revenues for the full year 2002 increased 6 percent and EBITDA increased 17 percent when compared to 2001. OUTDOOR: For the fourth quarter of 2002, revenues increased 17 percent and EBITDA increased 44 percent over the same period in 2001. On a pro forma basis, revenues for the fourth quarter of 2002 increased 5 percent and EBITDA increased 31 percent when compared to the fourth quarter of 2001. For the full year of 2002, Clear Channel Outdoor revenues increased 6 percent to $1.86 billion and EBITDA decreased 4 percent to $506 million, when compared to the same period in 2001. On a pro forma basis, revenues for the full year 2002 decreased 3 percent and EBITDA decreased 10 percent when compared to 2001. ENTERTAINMENT: For the fourth quarter of 2002, revenues increased 28 percent to $562 million and EBITDA increased from a negative $18 million in 2001 to a positive $12 million in 2002. On a pro forma basis, revenues for the fourth quarter of 2002 increased 26 percent and EBITDA increased from a negative $21 million in 2001 to a positive $11 million in 2002. For the full year of 2002, Clear Channel Entertainment revenues declined 1 percent to $2.45 billion and EBITDA increased 5 percent to $158 million, when compared to the same period in 2001. On a pro forma basis, revenues for the full year 2002 decreased 4 percent and EBITDA increased 2 percent when compared to 2001. 2
  • 3. Operating Results (in $000s) Below are the consolidated reported and pro forma results for the fourth quarter of 2002 versus 2001. 4th Quarter Revenue Reported Pro forma (a) 2002 % Change 2002 2001 % Change 2001 $979,015 9.9% $979,015 $902,601 8.5% Radio $890,625 538,299 17.3% 512,871 488,609 5.0% Outdoor 458,965 562,499 439,409 28.0% 549,936 437,029 25.8% Entertainment 166,280 109,064 52.5% 166,280 135,574 22.6% Other (36,360) (35,917) 1.2% (36,360) (35,917) 1.2% Eliminations $2,209,733 $1,862,146 18.7% $2,171,742 $1,927,896 12.6% Consolidated 4th Quarter EBITDA Reported Pro forma (a) 2002 % Change 2002 2001 % Change 2001 $428,201 43.2% $428,201 $300,863 42.3% Radio $299,130 155,001 43.9% 151,243 115,088 31.4% Outdoor 107,723 12,209 (18,307) * 11,106 (21,114) * Entertainment 37,310 2,758 1,252.8% 37,310 6,921 439.1% Other (53,813) (46,602) 15.5% (53,813) (49,472) 8.8% Corporate $578,908 $344,702 67.9% $574,047 $352,286 62.9% Consolidated (a) Includes adjustments to the prior period (2001) for all acquisitions for the same time frame as actually owned in the current period (2002). The 2002 pro forma include an adjustment for foreign exchange to present results in 2001 constant dollars. Divestitures are excluded from both 2001 and 2002. (*) Not meaningful Below are the consolidated reported and pro forma results for the full year of 2002 versus 2001. Full Year Revenue Reported Pro forma (b) 2002 % Change 2002 2001 % Change 2001 $3,717,243 7.6% $3,717,243 $3,497,376 6.3% Radio $3,455,553 1,859,643 6.4% 1,814,546 1,860,266 (2.5%) Outdoor 1,748,031 2,447,302 2,477,640 (1.2%) 2,418,971 2,511,146 (3.7%) Entertainment 528,374 423,651 24.7% 528,374 480,752 9.9% Other (131,507) (134,872) (2.5%) (131,507) (134,872) (2.5%) Eliminations $8,421,055 $7,970,003 5.7% $8,347,627 $8,214,668 1.6% Consolidated 3
  • 4. Full Year EBITDA Reported Pro forma (b) 2002 % Change 2002 2001 % Change 2001 $1,591,104 17.8% $1,591,104 $1,358,137 17.2% Radio $1,350,834 505,551 (4.1%) 499,229 555,054 (10.1%) Outdoor 527,350 157,648 150,531 4.7% 153,984 151,127 1.9% Entertainment 113,991 74,582 52.8% 113,991 77,514 47.1% Other (176,370) (187,434) (5.9%) (176,370) (193,607) (8.9%) Corporate $2,191,924 $1,915,863 14.4% $2,181,938 $1,948,225 12.0% Consolidated (b) Includes adjustments to the prior period (2001) for all acquisitions for the same time frame as actually owned in the current period (2002). The 2002 pro forma include an adjustment for foreign exchange to present results in 2001 constant dollars. Divestitures are excluded from both 2001 and 2002. Consolidated Reconciliation of EBITDA to Operating Income (in $000s) Three Months Ended December 31 Full Year 2002 2001 2002 2001 EBITDA $578,908 $344,702 $2,191,924 $1,915,863 Less: Non-cash compensation expense 1,217 2,146 5,436 17,077 Depreciation and amortization 171,584 651,108 620,766 2,562,480 Operating income $406,107 ($308,552) $1,565,722 ($663,694) Free Cash Flow (in $000s, except per share data) Three Months Ended December 31 Full Year 2002 2001 2002 2001 EBITDA $578,908 $344,702 $2,191,924 $1,915,863 Interest Expense (106,134) (131,394) (432,786) (560,077) Current Tax Benefit (Expense) (c) (70,024) 92,224 (205,216) (125,658) Non-Revenue Producing Capital Expenditures (129,211) (141,700) (305,731) (417,900) Total Free Cash Flow $273,539 $163,832 $1,248,191 $812,228 Total Free Cash Flow Per Share $0.43 $0.27 $1.99 $1.34 Weighted-Average Shares Outstanding (d) 629,294 602,546 627,440 605,439 (c) Current tax benefit (expense) reflects adjustments for non-routine deferred tax items of ($151,960) and ($56,073) for the fourth quarter and full year of 2002, and ($68,295) for both the fourth quarter and full year of 2001, respectively. (d) The 2001 amounts include an additional 4,733 shares and 13,474 shares for the three months and twelve months ended December 31, 2001, used to calculate both adjusted earnings per share giving effect to FAS 142 and free cash flow per share. Reconciliation of Cash Flow From Operating Activities to Free Cash Flow (in $000s) Three Months Ended December 31 Full Year 2002 2001 2002 2001 Net cash provided by operating activities $493,864 $255,454 $1,747,694 $609,587 Non-Routine Deferred Tax Items (151,960) (68,295) (56,073) (68,295) Changes in Operating Assets and Liabilities 52,403 128,033 (129,879) 696,190 Non-Revenue Producing Capital Expenditures (129,211) (141,700) (305,731) (417,900) Other 8,443 (9,660) (7,820) (7,354) Free Cash Flow $273,539 $163,832 $1,248,191 $812,228 4
  • 5. Selected Balance Sheet Information (in $000s) December 31, December 31, 2002 2001 Cash and Cash Equivalents $170,086 $154,744 Total Current Assets $2,123,495 $1,941,299 Net Property, Plant and Equipment $4,242,812 $3,956,749 Total Assets $27,672,153 $47,603,142 Current Liabilities (excluding current portion of long-term debt) $1,614,107 $1,444,636 Long-Term Debt (including current portion of long-term debt) $8,778,622 $9,482,934 Shareholders’ Equity $14,210,092 $29,736,063 Capital Expenditures (in $000s) Capital expenditures for the fourth quarter and full year 2002 were: Three Months Full Year Ended Ended December 31 December 31 Recurring $38,295 $116,315 Non-recurring projects 90,916 189,416 Revenue producing 80,904 242,914 Total capital expenditures $210,115 $548,645 The Company defines recurring capital expenditures as those expenditures that are required each year. Non- recurring projects are expenditures arising primarily from the integration of newly acquired entities. Revenue producing is discretionary capital investment for new revenue streams. Liquidity and Financial Position At December 31, 2002, Clear Channel had long-term debt of: (In $ Millions) Bank Credit Facilities $2,152.3 Public Notes 5,655.9 Convertible Notes 769.7 Other Debt 200.7 Total $8,778.6 Leverage, defined as debt(e), net of cash, divided by the trailing 12-month pro forma EBITDA(f), was 3.9x at December 31, 2002. As defined by Clear Channel’s credit facilities, debt is long-term debt of $8,778.6 plus letters of credit (e) and guarantees of third party debt of $241.3 million; plus deferred purchase consideration of $34.2 million included in other long-term liabilities; less fair value of interest rate swaps of $119.8 million; and, less purchase accounting premiums of $86.7 million. As defined by Clear Channel’s credit facilities, pro forma EBITDA is the trailing twelve-month EBITDA (f) adjusted to include EBITDA of any assets acquired in the trailing twelve-month period. 5
  • 6. In January 2003, Clear Channel issued $300 million of 4 5/8% Senior Notes due 2008 and $500 million of 5 ¾% Senior Notes due 2013. The proceeds of the issuance were used to pay down the Company’s bank credit facilities and to finance the redemption of AMFM Operating, Inc.’s 8.125% Senior Subordinated Notes due 2007 and 8.75% Senior Subordinated Notes due 2007. The AMFM notes were redeemed pursuant to call provisions in the indentures. Clear Channel has three domestic bank credit facilities with $2.56 billion available at February 25, 2003. The Company currently has approximately $1.25 billion of public debt maturing in 2003 in addition to other indebtedness, including notes and convertible notes, maturing in later years. The Company intends to utilize the existing capacity under its bank facilities and other available funds to redeem or repurchase any or all of such debt through open market purchases, privately negotiated transactions, or other means. Guidance The Company believes that, based on the current economic and advertising environment, 1st Quarter 2003 EBITDA will be in the range of $370-390 million. Conference Call Our year-end and 4th quarter 2002 earnings conference call will be held today at 9:00 a.m. Eastern Time. The dial-in number is 801-303-7416 and a pass code is not required. Please call 10 minutes prior to the beginning of the call to ensure that you are connected before the start of the presentation. The teleconference will also be available via a live audio cast on the Company’s website, located at http://www.clearchannel.com. A replay of the call will be available for 72 hours after the conference call. The replay number is 402-220-1490 and the pass code 1026. The audio cast will also be archived on the Company’s website and will be available beginning 24 hours after the call for a period of one week. About Clear Channel Worldwide Visit our website at http://www.clearchannel.com. Clear Channel Worldwide, headquartered in San Antonio, Texas, is a global leader in the out-of-home advertising and entertainment industries with radio and television stations, outdoor advertising displays, and live entertainment productions and venues throughout the US and in 65 countries around the world. For further information contact: Investors Randy Palmer Vice President of Investor Relations (210) 832-3315 Media Diane Warren Vice President of Communications (210) 832-3509 The numbers contained within this release are unaudited. Certain statements in this release constitute “forward-looking statements” within the meaning of the Private Securities Litigation Reform Act of 1995. Such forward-looking statements involve known and unknown risks, uncertainties and other factors which may cause the actual results, performance or achievements of the Company to be materially different from any future results, performance or achievements expressed or implied by such forward-looking statements. The words or phrases “guidance,” “expect,” “anticipate,” “estimates” and “forecast” and similar words or expressions are intended to identify such forward-looking statements. In addition, any statements that refer to expectations or other characterizations of future events or circumstances are forward-looking statements. Various risks that could cause future results to differ from those expressed by the forward-looking statements included in this release include, but are not limited to: changes in economic conditions in the U.S. and in other countries in which Clear Channel currently does business (both general and relative to the advertising and entertainment industries); 6
  • 7. fluctuations in interest rates; changes in industry conditions; changes in operating performance; shifts in population and other demographics; changes in the level of competition for advertising dollars; fluctuations in operating costs; technological changes and innovations; changes in labor conditions; changes in governmental regulations and policies and actions of regulatory bodies; fluctuations in exchange rates and currency values; changes in tax rates; changes in capital expenditure requirements and access to capital markets. Other key risks are described in the Clear Channel Communications’ reports filed with the U.S. Securities and Exchange Commission. Except as otherwise stated in this news announcement, Clear Channel Communications does not undertake any obligation to publicly update or revise any forward-looking statements because of new information, future events or otherwise. 7
  • 8. FINANCIAL HIGHLIGHTS Clear Channel Communications, Inc. and Subsidiaries Unaudited (In thousands of dollars, except per share data) Three months ended Twelve months ended December 31, December 31, % % 2002 2001 Change 2002 2001 Change Revenue $2,209,733 $1,862,146 19% $8,421,055 $7,970,003 6% Divisional operating expenses 1,577,012 1,470,842 6,052,761 5,866,706 Operating cash flow 632,721 391,304 62% 2,368,294 2,103,297 13% Corporate expenses 53,813 46,602 176,370 187,434 EBITDA as adjusted (1) 578,908 344,702 68% 2,191,924 1,915,863 14% Non-cash compensation expense 1,217 2,146 5,436 17,077 Depreciation and amortization 171,584 651,108 620,766 2,562,480 Operating Income 406,107 (308,552) 1,565,722 (663,694) Interest expense 106,134 131,394 432,786 560,077 Gain (loss) on sale of assets related to mergers - (156,316) 3,991 (213,706) Gain (loss) on marketable securities 4,012 (3,692) (3,096) 25,820 Equity in earnings (loss) of nonconsolidated affiliates 10,309 (1,226) 26,928 10,393 Other income (expense) - net (5,145) 171,316 57,430 152,267 Income (loss) before income taxes and cumulative effect of a change in accounting principle 309,149 (429,864) 1,218,189 (1,248,997) Income tax benefit (expense): Current 81,936 160,519 (149,143) (57,363) Deferred (207,141) (96,254) (344,223) 162,334 Income before cumulative effect of a change in accounting principle (FAS 142) $183,944 ($365,599) $724,823 ######### Income before cumulative effect of a change in accounting principle per share: Basic: $0.30 ($0.61) $1.20 ($1.93) Diluted: $0.30 ($0.61) $1.18 ($1.93) Net income per share adjusted for adoption of FAS 142 (2): Basic $0.30 $0.00 N/A $1.20 $0.42 186% Diluted $0.30 $0.00 N/A $1.18 $0.41 188% Free cash flow (3) $273,539 $163,832 67% $1,248,191 $812,228 54% Free cash flow per share $0.43 $0.27 59% $1.99 $1.34 49% Weighted Average Shares Outstanding - Diluted (4) 629,294 597,813 627,440 591,965 (1) Defined as cash flow from operations less corporate expenses. (2) Adjusted to present the impact of FAS 142 on net income per share as if FAS 142 had been in effect for the three months and the year ended December 31, 2001. (3) Defined as EBITDA as adjusted less interest expense, tax expense and non-revenue producing capital expenditures. (4) The 2001 amounts do not include an additional 4,733 shares and 13,474 shares for the three months and the year ended December 31, 2001 used to calculate both adjusted earnings per share as required by FAS 142 and free cash flow per share.