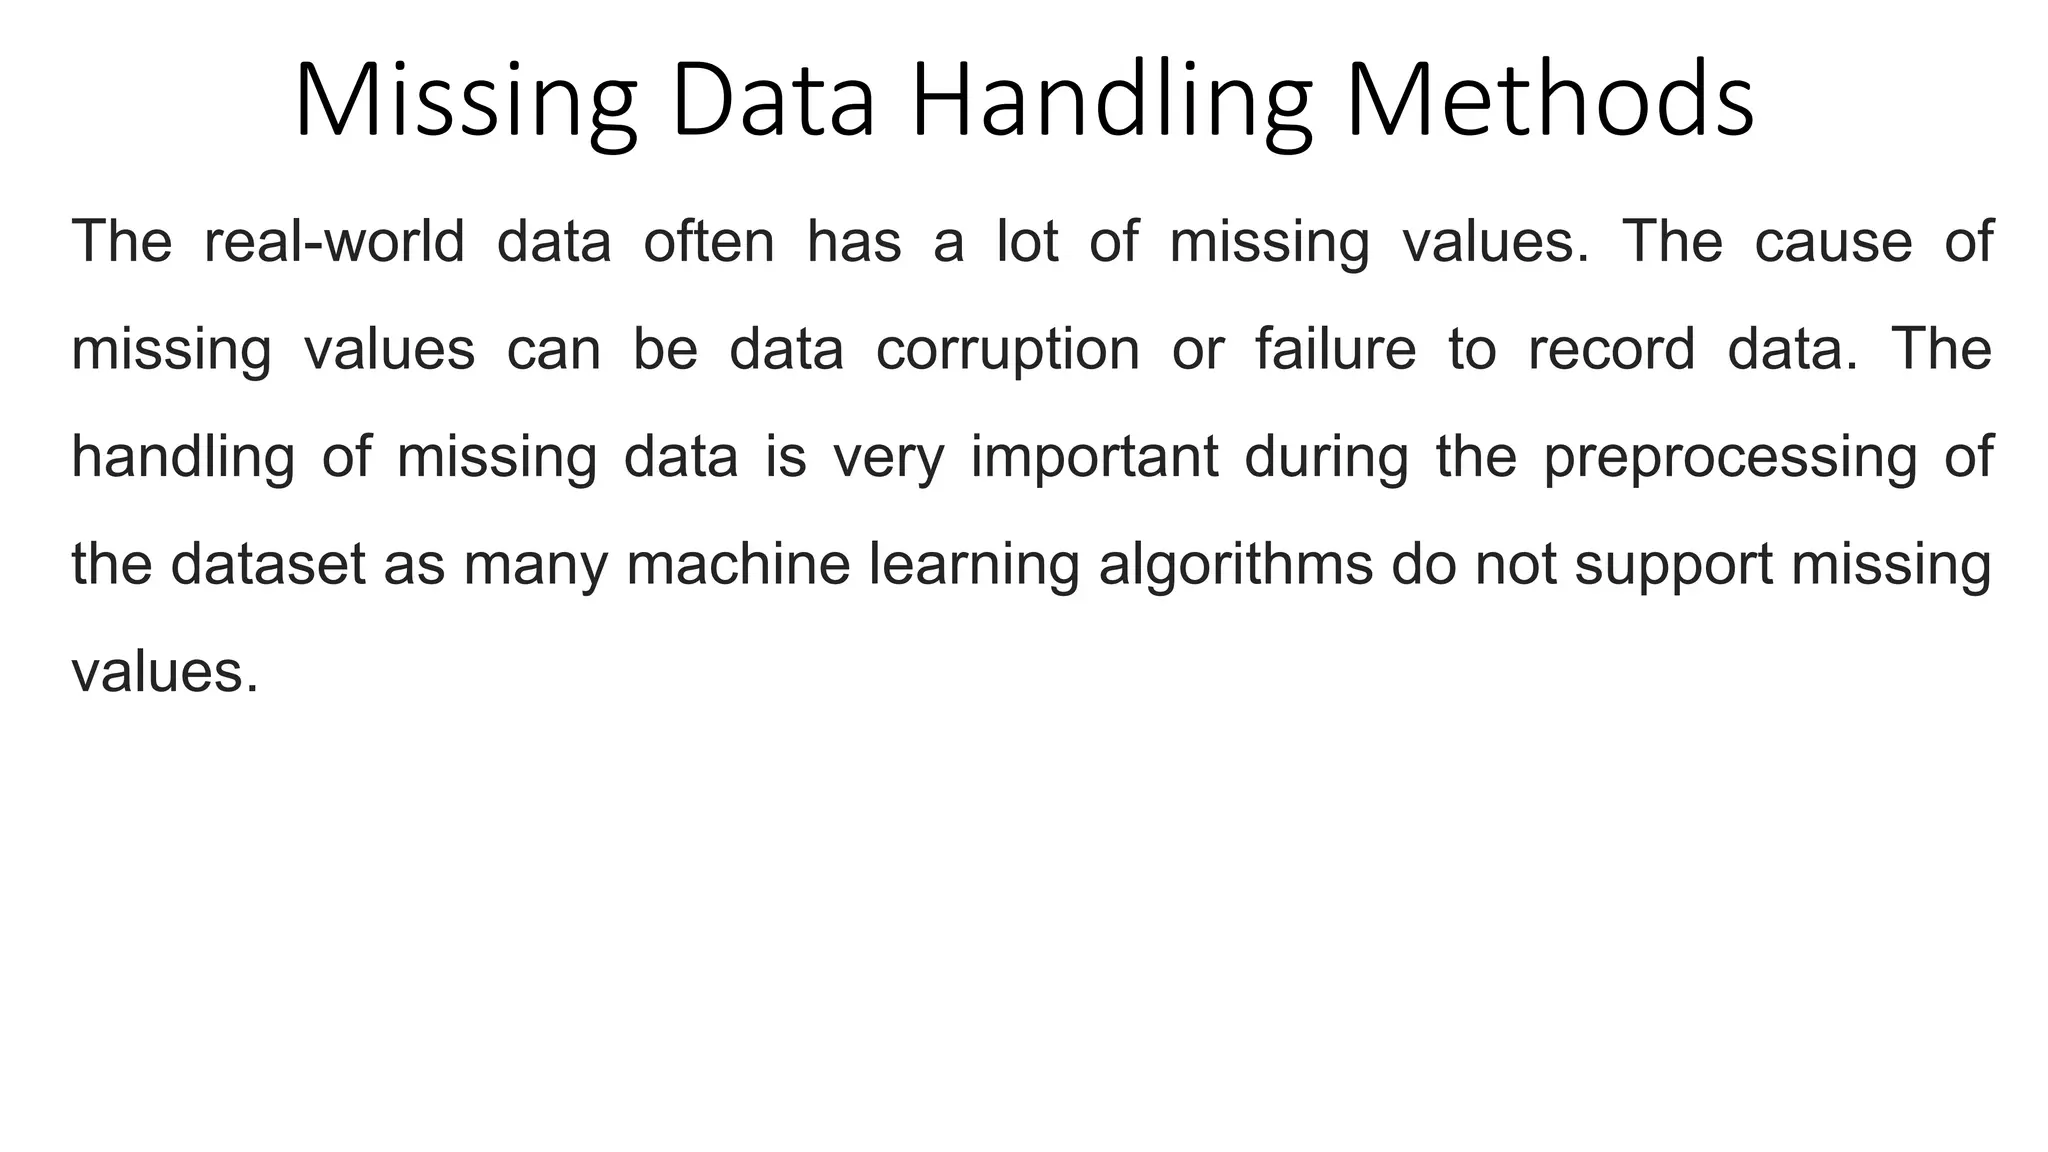
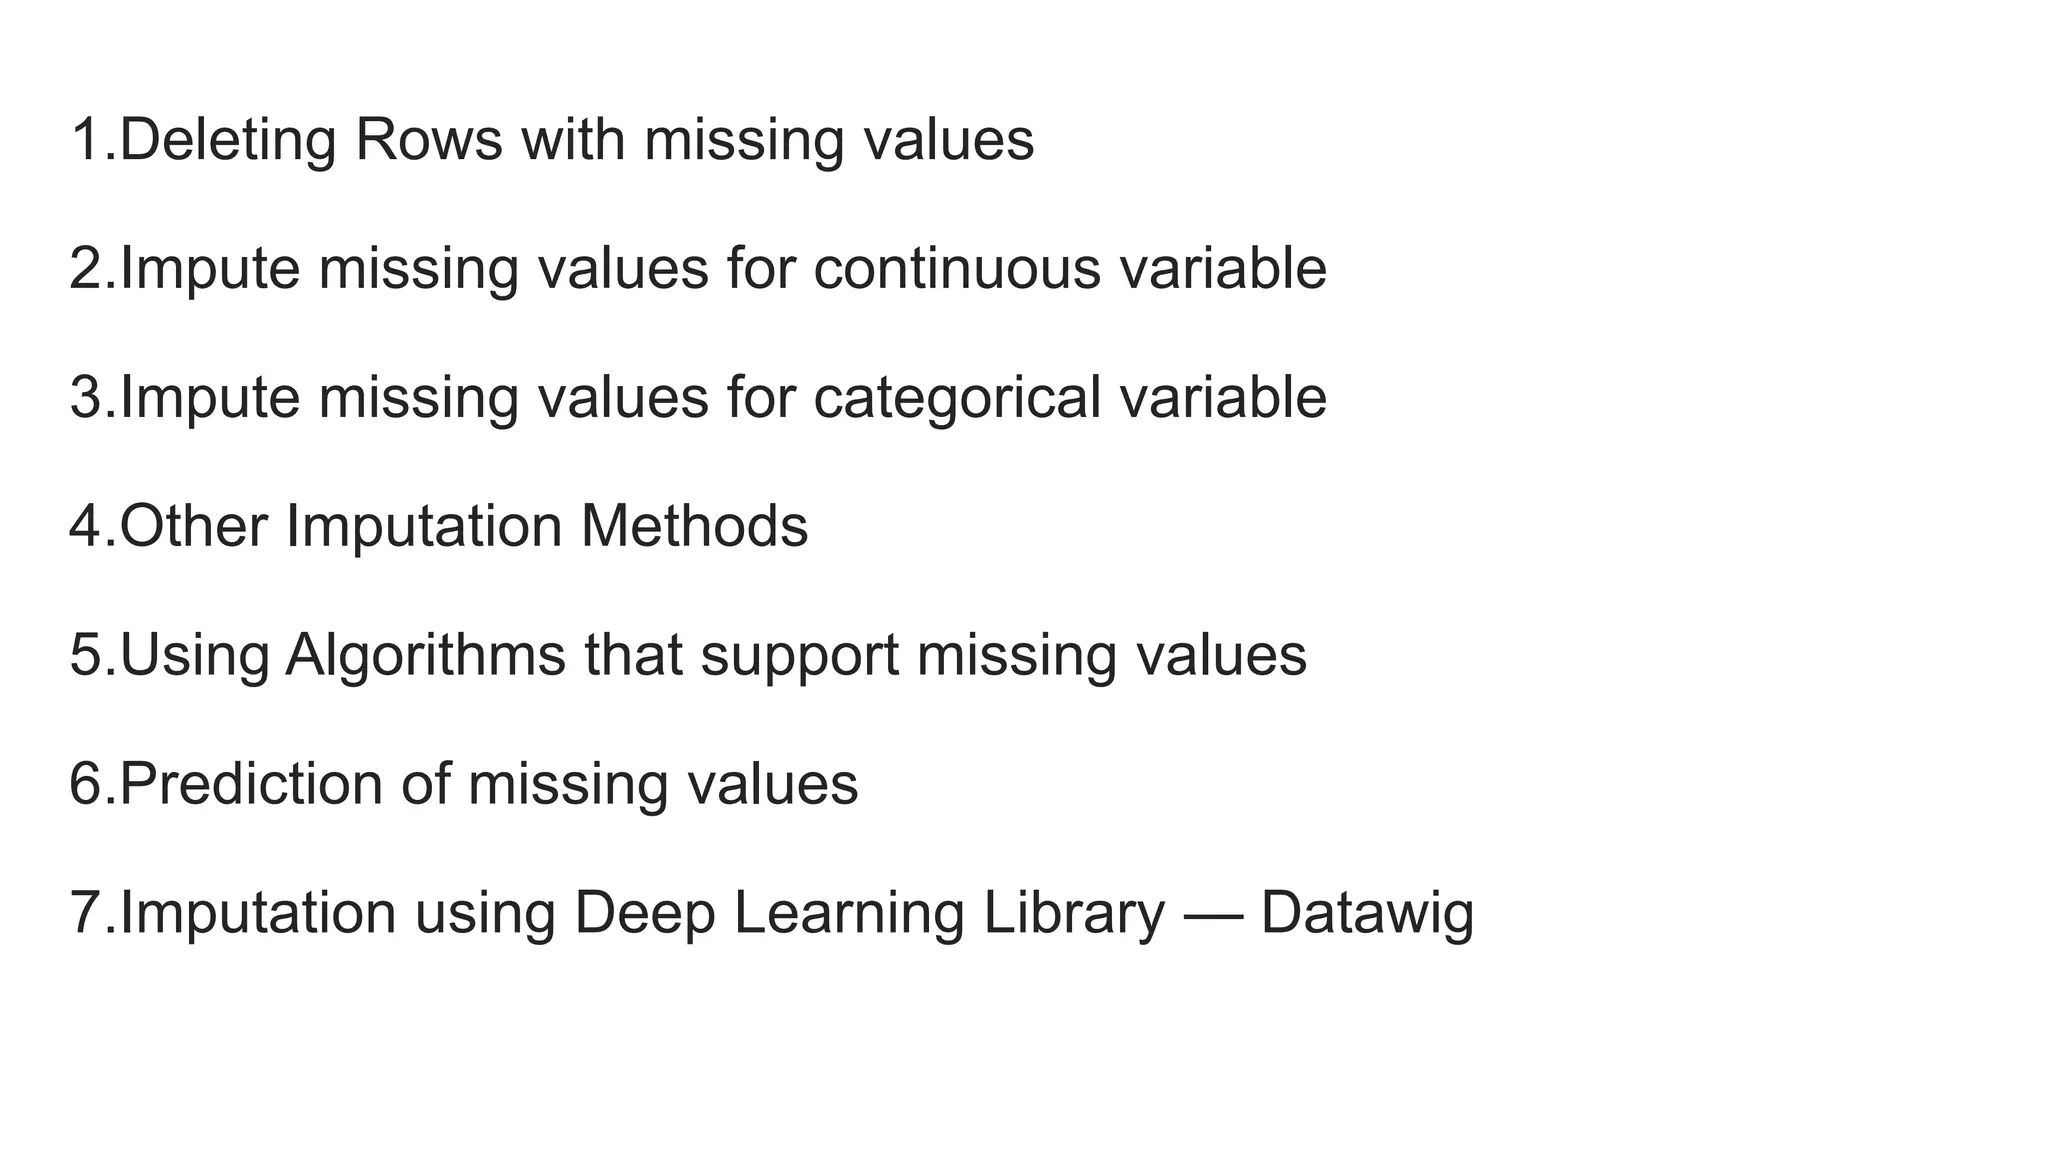
SlideShare a Scribd company logo
1 of 21
Unit 1: DATA PROCESSING AND STATESTICS
Basics of Data and its processing -Record Keeping , Statistics and data science ,
measurement scales , properties of data, Visualization, cleaning the data
Symbolic data analysis , Statistics-Basic Statistical Measures, Variance and
Standard Deviation, Visualizing Statistical Measures, Calculating Percentiles,
Quartiles and Box Plots, Missing data handling methods-Finding missing values,
dealing with missing values. Outliers- What are Outliers, Using Z-scores to Find
Outliers, Modified Z-score, Using IQR to Detect Outliers
Statistics & Data Science
Data science involves the collection, organization, analysis and visualization of large amounts
of data.
Statisticians, meanwhile, use mathematical models to quantify relationships between
variables and outcomes and make predictions based on those relationships.
Statisticians do not use computer science, algorithms or machine learning to the same degree
as computer scientists.
Data Science Statistics
Definition Is an interdisciplinary branch of
computer science used to gain valuable
information from a large data using
statistics, computers and technology.
Is a mathematical science for analysing
existing data pertaining to specific
problems, applying statistical tools to
this data, and presenting the results for
decision-making.
Concept 1. primary goal is to identify underlying
trends and patterns in a data for
decision making.
2. works well on both quantitative and
qualitative data
Key steps include
data mining
data pre-processing
Exploratory Data Analysis (EDA)
Model building and optimization
1. primary goal is to determine cause-
and-effect relationship in analysed
data, is a purely mathematical
approach.
2. works only on quantitative data
Key terms include
Mean
Median
Mode
Standard deviation (σ)
Variance (σ2)
Some important techniques include
regression, classification
Some important techniques
include probability
distribution, acceptance
sampling and statistical
quality control
Application
Areas
Can be applied in specialized areas
like computer vision, natural
language processing, disaster
management, recommender
systems and search engines, etc.
Can be applied in areas
where random variations
are observed in sampled
data like medical,
information technology,
economics, engineering,
finance, marketing,
accounting, and business,
etc.
Properties of Data
following are the properties of data:
1) amenability of use,
2) clarity,
3) accuracy, and
4) the quality
Amenability of use: From the dictionary meaning of data it is learnt
that data are facts used in deciding something. In short, data are
meant to be used as a base for arriving at definitive conclusions. They
are not required, if they are not amenable to use.
Clarity: This means data should necessarily' display so essential for
communicating the essence of the matter. Without clarity, the
meaning desired to be communicated will remain hidden.
Accuracy: Data should be real, complete and accurate. Accuracy is
thus, an essential property of data. Since data offer a basis for
deciding something, they must necessarily be accurate if valid
conclusions are to be drawn.
Essence: In social sciences, large quantities of data are collected
which cannot be presented, nor is it necessary to present them in
that form. They have to be compressed and refined. Data so refined
can present the essence or derived qualitative value, of the matter.
Data in sciences consist of observations made from scientific
experiments, these are all measured quantities. Data, thus, are
always the essence of the matter.
Outlier - Jupyter Notebook
Missing Data Handling Methods
The real-world data often has a lot of missing values. The cause of
missing values can be data corruption or failure to record data. The
handling of missing data is very important during the preprocessing of
the dataset as many machine learning algorithms do not support missing
values.
1.Deleting Rows with missing values
2.Impute missing values for continuous variable
3.Impute missing values for categorical variable
4.Other Imputation Methods
5.Using Algorithms that support missing values
6.Prediction of missing values
7.Imputation using Deep Learning Library — Datawig
Delete Rows with Missing Values:
Missing values can be handled by deleting the rows or columns having
null values. If columns have more than half of the rows as null then the
entire column can be dropped. The rows which are having one or more
columns values as null can also be dropped.
Replacing with an arbitrary value
If you can make an educated guess about the missing value, then you can
replace it with some arbitrary value using the following code. E.g., in the
following code, we are replacing the missing values of the ‘Dependents’
column with ‘0’.
IN:
#Replace the missing value with '0' using 'fiilna' method
train_df['Dependents'] = train_df['Dependents'].fillna(0)
train_df[‘Dependents'].isnull().sum()
OUT:
Replacing with the mean
Replacing with the mode
Replacing with the median
Replacing with the previous value – forward fill
Replacing with the next value – backward fill
How to Impute Missing Values for Categorical
Features?
There are two ways to impute missing values for categorical features as
follows:
Impute the Most Frequent Value :We will use ‘SimpleImputer’ in this
case, and as this is a non-numeric column, we can’t use mean or
median, but we can use the most frequent value and constant.
Impute the Value “Missing” : We can impute the value “missing,”
which treats it as a separate category.
Outliers
An outlier is an observation that lies an abnormal distance from other values in a
random sample from a population.
Outlier detection is a process used to identify and remove data points
from a dataset that differ from the rest of the data points In the dataset.
OR
Outlier detection is the process of identifying abnormal or abnormal-
looking data points in a dataset.
Types of outlier detection
There are two main types of outlier detection: descriptive and
prescriptive.
Descriptive outlier detection simply describes the outliers while
prescriptive outlier detection determines what action, if any,
needs to be taken based on the outlier.
Identifying Outliers using Z-Score
Z-Score is a measure of how many standard deviations a data point is
away from the mean.
data points with a Z-Score greater than a threshold are considered
outliers.
Definition of Z-Scores: Z-Scores are calculated by subtracting the
mean of the data set from a data point and dividing the result by the
standard deviation of the data set. The resulting value is a measure of
how many standard deviations a data point is away from the mean.
For example, let's say we have a dataset of test scores for a group of
students. The mean score is 75, and the standard deviation is 5. If a
student scored 85 on the test, we can calculate their Z-score as follows:
Z-score = (85 - 75) / 5 = 2
Outlier - Jupyter Notebook
modified z-score
However, z-scores can be affected by unusually large or small data values, which is
why a more robust way to detect outliers is to use a modified z-score, which is
calculated as:
Modified z-score = 0.6745(xi – x̃) / MAD
where:
•xi: A single data value
•x̃: The median of the dataset
•MAD: The median absolute deviation of the dataset
Identifying Outliers using IQR (Interquartile Range): The IQR is the range between
the first quartile (Q1) and the third quartile (Q3) of the data.
Outliers are often identified as values outside the range [Q1 - 1.5 * IQR, Q3 + 1.5 *
IQR]

More Related Content

Similar to Exploratory Data Analysis Unit 1 ppt presentation.pptx

Quant Data Analysis
Quant Data AnalysisQuant Data Analysis
Quant Data AnalysisSaad Chahine
 
Ch17 lab r_verdu103: Entry level statistics exercise (descriptives)
Ch17 lab r_verdu103: Entry level statistics exercise (descriptives)Ch17 lab r_verdu103: Entry level statistics exercise (descriptives)
Ch17 lab r_verdu103: Entry level statistics exercise (descriptives)Sherri Gunder
 
Unit 8 data analysis and interpretation
Unit 8 data analysis and interpretationUnit 8 data analysis and interpretation
Unit 8 data analysis and interpretationAsima shahzadi
 
MMW (Data Management)-Part 1 for ULO 2 (1).pptx
MMW (Data Management)-Part 1 for ULO 2 (1).pptxMMW (Data Management)-Part 1 for ULO 2 (1).pptx
MMW (Data Management)-Part 1 for ULO 2 (1).pptxPETTIROSETALISIC
 
Singular Value Decomposition (SVD).pptx
Singular Value Decomposition (SVD).pptxSingular Value Decomposition (SVD).pptx
Singular Value Decomposition (SVD).pptxrajalakshmi5921
 
EDAB Module 5 Singular Value Decomposition (SVD).pptx
EDAB Module 5 Singular Value Decomposition (SVD).pptxEDAB Module 5 Singular Value Decomposition (SVD).pptx
EDAB Module 5 Singular Value Decomposition (SVD).pptxrajalakshmi5921
 
Standard deviation
Standard deviationStandard deviation
Standard deviationM K
 
CHAPTER 11 LOGISTIC REGRESSION.pptx
CHAPTER 11 LOGISTIC REGRESSION.pptxCHAPTER 11 LOGISTIC REGRESSION.pptx
CHAPTER 11 LOGISTIC REGRESSION.pptxUmaDeviAnanth
 
Module 4: Model Selection and Evaluation
Module 4: Model Selection and EvaluationModule 4: Model Selection and Evaluation
Module 4: Model Selection and EvaluationSara Hooker
 
SELECTED DATA PREPARATION METHODS
SELECTED DATA PREPARATION METHODSSELECTED DATA PREPARATION METHODS
SELECTED DATA PREPARATION METHODSKAMIL MAJEED
 
IDS-Unit-II. bachelor of computer applicatio notes
IDS-Unit-II. bachelor of computer applicatio notesIDS-Unit-II. bachelor of computer applicatio notes
IDS-Unit-II. bachelor of computer applicatio notesAnkurTiwari813070
 
Research methodology-Research Report
Research methodology-Research ReportResearch methodology-Research Report
Research methodology-Research ReportDrMAlagupriyasafiq
 

Similar to Exploratory Data Analysis Unit 1 ppt presentation.pptx (20)

Quant Data Analysis
Quant Data AnalysisQuant Data Analysis
Quant Data Analysis
 
Ch17 lab r_verdu103: Entry level statistics exercise (descriptives)
Ch17 lab r_verdu103: Entry level statistics exercise (descriptives)Ch17 lab r_verdu103: Entry level statistics exercise (descriptives)
Ch17 lab r_verdu103: Entry level statistics exercise (descriptives)
 
Unit 8 data analysis and interpretation
Unit 8 data analysis and interpretationUnit 8 data analysis and interpretation
Unit 8 data analysis and interpretation
 
MMW (Data Management)-Part 1 for ULO 2 (1).pptx
MMW (Data Management)-Part 1 for ULO 2 (1).pptxMMW (Data Management)-Part 1 for ULO 2 (1).pptx
MMW (Data Management)-Part 1 for ULO 2 (1).pptx
 
Singular Value Decomposition (SVD).pptx
Singular Value Decomposition (SVD).pptxSingular Value Decomposition (SVD).pptx
Singular Value Decomposition (SVD).pptx
 
EDAB Module 5 Singular Value Decomposition (SVD).pptx
EDAB Module 5 Singular Value Decomposition (SVD).pptxEDAB Module 5 Singular Value Decomposition (SVD).pptx
EDAB Module 5 Singular Value Decomposition (SVD).pptx
 
Standard deviation
Standard deviationStandard deviation
Standard deviation
 
Data Science 1.pdf
Data Science 1.pdfData Science 1.pdf
Data Science 1.pdf
 
Krupa rm
Krupa rmKrupa rm
Krupa rm
 
Presentation of BRM.pptx
Presentation of BRM.pptxPresentation of BRM.pptx
Presentation of BRM.pptx
 
CHAPTER 11 LOGISTIC REGRESSION.pptx
CHAPTER 11 LOGISTIC REGRESSION.pptxCHAPTER 11 LOGISTIC REGRESSION.pptx
CHAPTER 11 LOGISTIC REGRESSION.pptx
 
Module 4: Model Selection and Evaluation
Module 4: Model Selection and EvaluationModule 4: Model Selection and Evaluation
Module 4: Model Selection and Evaluation
 
SELECTED DATA PREPARATION METHODS
SELECTED DATA PREPARATION METHODSSELECTED DATA PREPARATION METHODS
SELECTED DATA PREPARATION METHODS
 
IDS-Unit-II. bachelor of computer applicatio notes
IDS-Unit-II. bachelor of computer applicatio notesIDS-Unit-II. bachelor of computer applicatio notes
IDS-Unit-II. bachelor of computer applicatio notes
 
QQ Plot.pptx
QQ Plot.pptxQQ Plot.pptx
QQ Plot.pptx
 
ML-Unit-4.pdf
ML-Unit-4.pdfML-Unit-4.pdf
ML-Unit-4.pdf
 
Machine Learning.pptx
Machine Learning.pptxMachine Learning.pptx
Machine Learning.pptx
 
EDA-Unit 1.pdf
EDA-Unit 1.pdfEDA-Unit 1.pdf
EDA-Unit 1.pdf
 
PyGotham 2016
PyGotham 2016PyGotham 2016
PyGotham 2016
 
Research methodology-Research Report
Research methodology-Research ReportResearch methodology-Research Report
Research methodology-Research Report
 

Recently uploaded

Call for Papers - Educational Administration: Theory and Practice, E-ISSN: 21...
Call for Papers - Educational Administration: Theory and Practice, E-ISSN: 21...Call for Papers - Educational Administration: Theory and Practice, E-ISSN: 21...
Call for Papers - Educational Administration: Theory and Practice, E-ISSN: 21...Christo Ananth
 
High Profile Call Girls Nagpur Isha Call 7001035870 Meet With Nagpur Escorts
High Profile Call Girls Nagpur Isha Call 7001035870 Meet With Nagpur EscortsHigh Profile Call Girls Nagpur Isha Call 7001035870 Meet With Nagpur Escorts
High Profile Call Girls Nagpur Isha Call 7001035870 Meet With Nagpur Escortsranjana rawat
 
Sheet Pile Wall Design and Construction: A Practical Guide for Civil Engineer...
Sheet Pile Wall Design and Construction: A Practical Guide for Civil Engineer...Sheet Pile Wall Design and Construction: A Practical Guide for Civil Engineer...
Sheet Pile Wall Design and Construction: A Practical Guide for Civil Engineer...Dr.Costas Sachpazis
 
UNIT-II FMM-Flow Through Circular Conduits
UNIT-II FMM-Flow Through Circular ConduitsUNIT-II FMM-Flow Through Circular Conduits
UNIT-II FMM-Flow Through Circular Conduitsrknatarajan
 
CCS335 _ Neural Networks and Deep Learning Laboratory_Lab Complete Record
CCS335 _ Neural Networks and Deep Learning Laboratory_Lab Complete RecordCCS335 _ Neural Networks and Deep Learning Laboratory_Lab Complete Record
CCS335 _ Neural Networks and Deep Learning Laboratory_Lab Complete RecordAsst.prof M.Gokilavani
 
Booking open Available Pune Call Girls Koregaon Park 6297143586 Call Hot Ind...
Booking open Available Pune Call Girls Koregaon Park  6297143586 Call Hot Ind...Booking open Available Pune Call Girls Koregaon Park  6297143586 Call Hot Ind...
Booking open Available Pune Call Girls Koregaon Park 6297143586 Call Hot Ind...Call Girls in Nagpur High Profile
 
Java Programming :Event Handling(Types of Events)
Java Programming :Event Handling(Types of Events)Java Programming :Event Handling(Types of Events)
Java Programming :Event Handling(Types of Events)simmis5
 
Structural Analysis and Design of Foundations: A Comprehensive Handbook for S...
Structural Analysis and Design of Foundations: A Comprehensive Handbook for S...Structural Analysis and Design of Foundations: A Comprehensive Handbook for S...
Structural Analysis and Design of Foundations: A Comprehensive Handbook for S...Dr.Costas Sachpazis
 
Call Girls Service Nashik Vaishnavi 7001305949 Independent Escort Service Nashik
Call Girls Service Nashik Vaishnavi 7001305949 Independent Escort Service NashikCall Girls Service Nashik Vaishnavi 7001305949 Independent Escort Service Nashik
Call Girls Service Nashik Vaishnavi 7001305949 Independent Escort Service NashikCall Girls in Nagpur High Profile
 
Call Girls in Nagpur Suman Call 7001035870 Meet With Nagpur Escorts
Call Girls in Nagpur Suman Call 7001035870 Meet With Nagpur EscortsCall Girls in Nagpur Suman Call 7001035870 Meet With Nagpur Escorts
Call Girls in Nagpur Suman Call 7001035870 Meet With Nagpur EscortsCall Girls in Nagpur High Profile
 
AKTU Computer Networks notes --- Unit 3.pdf
AKTU Computer Networks notes ---  Unit 3.pdfAKTU Computer Networks notes ---  Unit 3.pdf
AKTU Computer Networks notes --- Unit 3.pdfankushspencer015
 
MANUFACTURING PROCESS-II UNIT-5 NC MACHINE TOOLS
MANUFACTURING PROCESS-II UNIT-5 NC MACHINE TOOLSMANUFACTURING PROCESS-II UNIT-5 NC MACHINE TOOLS
MANUFACTURING PROCESS-II UNIT-5 NC MACHINE TOOLSSIVASHANKAR N
 
Processing & Properties of Floor and Wall Tiles.pptx
Processing & Properties of Floor and Wall Tiles.pptxProcessing & Properties of Floor and Wall Tiles.pptx
Processing & Properties of Floor and Wall Tiles.pptxpranjaldaimarysona
 
UNIT-III FMM. DIMENSIONAL ANALYSIS
UNIT-III FMM.        DIMENSIONAL ANALYSISUNIT-III FMM.        DIMENSIONAL ANALYSIS
UNIT-III FMM. DIMENSIONAL ANALYSISrknatarajan
 
Call Girls Service Nagpur Tanvi Call 7001035870 Meet With Nagpur Escorts
Call Girls Service Nagpur Tanvi Call 7001035870 Meet With Nagpur EscortsCall Girls Service Nagpur Tanvi Call 7001035870 Meet With Nagpur Escorts
Call Girls Service Nagpur Tanvi Call 7001035870 Meet With Nagpur EscortsCall Girls in Nagpur High Profile
 
The Most Attractive Pune Call Girls Budhwar Peth 8250192130 Will You Miss Thi...
The Most Attractive Pune Call Girls Budhwar Peth 8250192130 Will You Miss Thi...The Most Attractive Pune Call Girls Budhwar Peth 8250192130 Will You Miss Thi...
The Most Attractive Pune Call Girls Budhwar Peth 8250192130 Will You Miss Thi...ranjana rawat
 
(PRIYA) Rajgurunagar Call Girls Just Call 7001035870 [ Cash on Delivery ] Pun...
(PRIYA) Rajgurunagar Call Girls Just Call 7001035870 [ Cash on Delivery ] Pun...(PRIYA) Rajgurunagar Call Girls Just Call 7001035870 [ Cash on Delivery ] Pun...
(PRIYA) Rajgurunagar Call Girls Just Call 7001035870 [ Cash on Delivery ] Pun...ranjana rawat
 
Coefficient of Thermal Expansion and their Importance.pptx
Coefficient of Thermal Expansion and their Importance.pptxCoefficient of Thermal Expansion and their Importance.pptx
Coefficient of Thermal Expansion and their Importance.pptxAsutosh Ranjan
 
MANUFACTURING PROCESS-II UNIT-1 THEORY OF METAL CUTTING
MANUFACTURING PROCESS-II UNIT-1 THEORY OF METAL CUTTINGMANUFACTURING PROCESS-II UNIT-1 THEORY OF METAL CUTTING
MANUFACTURING PROCESS-II UNIT-1 THEORY OF METAL CUTTINGSIVASHANKAR N
 
Introduction to Multiple Access Protocol.pptx
Introduction to Multiple Access Protocol.pptxIntroduction to Multiple Access Protocol.pptx
Introduction to Multiple Access Protocol.pptxupamatechverse
 

Recently uploaded (20)

Call for Papers - Educational Administration: Theory and Practice, E-ISSN: 21...
Call for Papers - Educational Administration: Theory and Practice, E-ISSN: 21...Call for Papers - Educational Administration: Theory and Practice, E-ISSN: 21...
Call for Papers - Educational Administration: Theory and Practice, E-ISSN: 21...
 
High Profile Call Girls Nagpur Isha Call 7001035870 Meet With Nagpur Escorts
High Profile Call Girls Nagpur Isha Call 7001035870 Meet With Nagpur EscortsHigh Profile Call Girls Nagpur Isha Call 7001035870 Meet With Nagpur Escorts
High Profile Call Girls Nagpur Isha Call 7001035870 Meet With Nagpur Escorts
 
Sheet Pile Wall Design and Construction: A Practical Guide for Civil Engineer...
Sheet Pile Wall Design and Construction: A Practical Guide for Civil Engineer...Sheet Pile Wall Design and Construction: A Practical Guide for Civil Engineer...
Sheet Pile Wall Design and Construction: A Practical Guide for Civil Engineer...
 
UNIT-II FMM-Flow Through Circular Conduits
UNIT-II FMM-Flow Through Circular ConduitsUNIT-II FMM-Flow Through Circular Conduits
UNIT-II FMM-Flow Through Circular Conduits
 
CCS335 _ Neural Networks and Deep Learning Laboratory_Lab Complete Record
CCS335 _ Neural Networks and Deep Learning Laboratory_Lab Complete RecordCCS335 _ Neural Networks and Deep Learning Laboratory_Lab Complete Record
CCS335 _ Neural Networks and Deep Learning Laboratory_Lab Complete Record
 
Booking open Available Pune Call Girls Koregaon Park 6297143586 Call Hot Ind...
Booking open Available Pune Call Girls Koregaon Park  6297143586 Call Hot Ind...Booking open Available Pune Call Girls Koregaon Park  6297143586 Call Hot Ind...
Booking open Available Pune Call Girls Koregaon Park 6297143586 Call Hot Ind...
 
Java Programming :Event Handling(Types of Events)
Java Programming :Event Handling(Types of Events)Java Programming :Event Handling(Types of Events)
Java Programming :Event Handling(Types of Events)
 
Structural Analysis and Design of Foundations: A Comprehensive Handbook for S...
Structural Analysis and Design of Foundations: A Comprehensive Handbook for S...Structural Analysis and Design of Foundations: A Comprehensive Handbook for S...
Structural Analysis and Design of Foundations: A Comprehensive Handbook for S...
 
Call Girls Service Nashik Vaishnavi 7001305949 Independent Escort Service Nashik
Call Girls Service Nashik Vaishnavi 7001305949 Independent Escort Service NashikCall Girls Service Nashik Vaishnavi 7001305949 Independent Escort Service Nashik
Call Girls Service Nashik Vaishnavi 7001305949 Independent Escort Service Nashik
 
Call Girls in Nagpur Suman Call 7001035870 Meet With Nagpur Escorts
Call Girls in Nagpur Suman Call 7001035870 Meet With Nagpur EscortsCall Girls in Nagpur Suman Call 7001035870 Meet With Nagpur Escorts
Call Girls in Nagpur Suman Call 7001035870 Meet With Nagpur Escorts
 
AKTU Computer Networks notes --- Unit 3.pdf
AKTU Computer Networks notes ---  Unit 3.pdfAKTU Computer Networks notes ---  Unit 3.pdf
AKTU Computer Networks notes --- Unit 3.pdf
 
MANUFACTURING PROCESS-II UNIT-5 NC MACHINE TOOLS
MANUFACTURING PROCESS-II UNIT-5 NC MACHINE TOOLSMANUFACTURING PROCESS-II UNIT-5 NC MACHINE TOOLS
MANUFACTURING PROCESS-II UNIT-5 NC MACHINE TOOLS
 
Processing & Properties of Floor and Wall Tiles.pptx
Processing & Properties of Floor and Wall Tiles.pptxProcessing & Properties of Floor and Wall Tiles.pptx
Processing & Properties of Floor and Wall Tiles.pptx
 
UNIT-III FMM. DIMENSIONAL ANALYSIS
UNIT-III FMM.        DIMENSIONAL ANALYSISUNIT-III FMM.        DIMENSIONAL ANALYSIS
UNIT-III FMM. DIMENSIONAL ANALYSIS
 
Call Girls Service Nagpur Tanvi Call 7001035870 Meet With Nagpur Escorts
Call Girls Service Nagpur Tanvi Call 7001035870 Meet With Nagpur EscortsCall Girls Service Nagpur Tanvi Call 7001035870 Meet With Nagpur Escorts
Call Girls Service Nagpur Tanvi Call 7001035870 Meet With Nagpur Escorts
 
The Most Attractive Pune Call Girls Budhwar Peth 8250192130 Will You Miss Thi...
The Most Attractive Pune Call Girls Budhwar Peth 8250192130 Will You Miss Thi...The Most Attractive Pune Call Girls Budhwar Peth 8250192130 Will You Miss Thi...
The Most Attractive Pune Call Girls Budhwar Peth 8250192130 Will You Miss Thi...
 
(PRIYA) Rajgurunagar Call Girls Just Call 7001035870 [ Cash on Delivery ] Pun...
(PRIYA) Rajgurunagar Call Girls Just Call 7001035870 [ Cash on Delivery ] Pun...(PRIYA) Rajgurunagar Call Girls Just Call 7001035870 [ Cash on Delivery ] Pun...
(PRIYA) Rajgurunagar Call Girls Just Call 7001035870 [ Cash on Delivery ] Pun...
 
Coefficient of Thermal Expansion and their Importance.pptx
Coefficient of Thermal Expansion and their Importance.pptxCoefficient of Thermal Expansion and their Importance.pptx
Coefficient of Thermal Expansion and their Importance.pptx
 
MANUFACTURING PROCESS-II UNIT-1 THEORY OF METAL CUTTING
MANUFACTURING PROCESS-II UNIT-1 THEORY OF METAL CUTTINGMANUFACTURING PROCESS-II UNIT-1 THEORY OF METAL CUTTING
MANUFACTURING PROCESS-II UNIT-1 THEORY OF METAL CUTTING
 
Introduction to Multiple Access Protocol.pptx
Introduction to Multiple Access Protocol.pptxIntroduction to Multiple Access Protocol.pptx
Introduction to Multiple Access Protocol.pptx
 

Exploratory Data Analysis Unit 1 ppt presentation.pptx

  • 1. Unit 1: DATA PROCESSING AND STATESTICS Basics of Data and its processing -Record Keeping , Statistics and data science , measurement scales , properties of data, Visualization, cleaning the data Symbolic data analysis , Statistics-Basic Statistical Measures, Variance and Standard Deviation, Visualizing Statistical Measures, Calculating Percentiles, Quartiles and Box Plots, Missing data handling methods-Finding missing values, dealing with missing values. Outliers- What are Outliers, Using Z-scores to Find Outliers, Modified Z-score, Using IQR to Detect Outliers
  • 2.
  • 3. Statistics & Data Science Data science involves the collection, organization, analysis and visualization of large amounts of data. Statisticians, meanwhile, use mathematical models to quantify relationships between variables and outcomes and make predictions based on those relationships. Statisticians do not use computer science, algorithms or machine learning to the same degree as computer scientists.
  • 4. Data Science Statistics Definition Is an interdisciplinary branch of computer science used to gain valuable information from a large data using statistics, computers and technology. Is a mathematical science for analysing existing data pertaining to specific problems, applying statistical tools to this data, and presenting the results for decision-making. Concept 1. primary goal is to identify underlying trends and patterns in a data for decision making. 2. works well on both quantitative and qualitative data Key steps include data mining data pre-processing Exploratory Data Analysis (EDA) Model building and optimization 1. primary goal is to determine cause- and-effect relationship in analysed data, is a purely mathematical approach. 2. works only on quantitative data Key terms include Mean Median Mode Standard deviation (σ) Variance (σ2)
  • 5. Some important techniques include regression, classification Some important techniques include probability distribution, acceptance sampling and statistical quality control Application Areas Can be applied in specialized areas like computer vision, natural language processing, disaster management, recommender systems and search engines, etc. Can be applied in areas where random variations are observed in sampled data like medical, information technology, economics, engineering, finance, marketing, accounting, and business, etc.
  • 6. Properties of Data following are the properties of data: 1) amenability of use, 2) clarity, 3) accuracy, and 4) the quality
  • 7. Amenability of use: From the dictionary meaning of data it is learnt that data are facts used in deciding something. In short, data are meant to be used as a base for arriving at definitive conclusions. They are not required, if they are not amenable to use. Clarity: This means data should necessarily' display so essential for communicating the essence of the matter. Without clarity, the meaning desired to be communicated will remain hidden. Accuracy: Data should be real, complete and accurate. Accuracy is thus, an essential property of data. Since data offer a basis for deciding something, they must necessarily be accurate if valid conclusions are to be drawn.
  • 8. Essence: In social sciences, large quantities of data are collected which cannot be presented, nor is it necessary to present them in that form. They have to be compressed and refined. Data so refined can present the essence or derived qualitative value, of the matter. Data in sciences consist of observations made from scientific experiments, these are all measured quantities. Data, thus, are always the essence of the matter.
  • 9. Outlier - Jupyter Notebook
  • 10. Missing Data Handling Methods The real-world data often has a lot of missing values. The cause of missing values can be data corruption or failure to record data. The handling of missing data is very important during the preprocessing of the dataset as many machine learning algorithms do not support missing values.
  • 11. 1.Deleting Rows with missing values 2.Impute missing values for continuous variable 3.Impute missing values for categorical variable 4.Other Imputation Methods 5.Using Algorithms that support missing values 6.Prediction of missing values 7.Imputation using Deep Learning Library — Datawig
  • 12. Delete Rows with Missing Values: Missing values can be handled by deleting the rows or columns having null values. If columns have more than half of the rows as null then the entire column can be dropped. The rows which are having one or more columns values as null can also be dropped.
  • 13. Replacing with an arbitrary value If you can make an educated guess about the missing value, then you can replace it with some arbitrary value using the following code. E.g., in the following code, we are replacing the missing values of the ‘Dependents’ column with ‘0’. IN: #Replace the missing value with '0' using 'fiilna' method train_df['Dependents'] = train_df['Dependents'].fillna(0) train_df[‘Dependents'].isnull().sum() OUT:
  • 14. Replacing with the mean Replacing with the mode Replacing with the median Replacing with the previous value – forward fill Replacing with the next value – backward fill
  • 15. How to Impute Missing Values for Categorical Features? There are two ways to impute missing values for categorical features as follows: Impute the Most Frequent Value :We will use ‘SimpleImputer’ in this case, and as this is a non-numeric column, we can’t use mean or median, but we can use the most frequent value and constant. Impute the Value “Missing” : We can impute the value “missing,” which treats it as a separate category.
  • 16. Outliers An outlier is an observation that lies an abnormal distance from other values in a random sample from a population. Outlier detection is a process used to identify and remove data points from a dataset that differ from the rest of the data points In the dataset. OR Outlier detection is the process of identifying abnormal or abnormal- looking data points in a dataset.
  • 17. Types of outlier detection There are two main types of outlier detection: descriptive and prescriptive. Descriptive outlier detection simply describes the outliers while prescriptive outlier detection determines what action, if any, needs to be taken based on the outlier.
  • 18. Identifying Outliers using Z-Score Z-Score is a measure of how many standard deviations a data point is away from the mean. data points with a Z-Score greater than a threshold are considered outliers. Definition of Z-Scores: Z-Scores are calculated by subtracting the mean of the data set from a data point and dividing the result by the standard deviation of the data set. The resulting value is a measure of how many standard deviations a data point is away from the mean.
  • 19. For example, let's say we have a dataset of test scores for a group of students. The mean score is 75, and the standard deviation is 5. If a student scored 85 on the test, we can calculate their Z-score as follows: Z-score = (85 - 75) / 5 = 2 Outlier - Jupyter Notebook
  • 20. modified z-score However, z-scores can be affected by unusually large or small data values, which is why a more robust way to detect outliers is to use a modified z-score, which is calculated as: Modified z-score = 0.6745(xi – x̃) / MAD where: •xi: A single data value •x̃: The median of the dataset •MAD: The median absolute deviation of the dataset
  • 21. Identifying Outliers using IQR (Interquartile Range): The IQR is the range between the first quartile (Q1) and the third quartile (Q3) of the data. Outliers are often identified as values outside the range [Q1 - 1.5 * IQR, Q3 + 1.5 * IQR]