Download to read offline


![International Research Journal of Engineering and Technology (IRJET) e-ISSN: 2395-0056
Volume: 10 Issue: 05 | May 2023 www.irjet.net p-ISSN: 2395-0072
© 2023, IRJET | Impact Factor value: 8.226 | ISO 9001:2008 Certified Journal | Page 46
a2 = 0.202 (MR_Base
converted from Mpa to PSI)
Layer Coefficient for
Sub-base Layer (a3)
0.227 x (LOG10
(MR_Subbase))-0.839
a3 = 0.168 (MR_Subbase
converted from Mpa to PSI)
8. Modified Layer
Coefficients
Modified Layer
Coefficients for Surface
Layer (a’1)
0.438
Modified Layer
Coefficients for Base
Layer (a’2)
0.272
Modified Layer
Coefficients for Sub-
Base Layer (a’3)
0.168
9. Calculation of Modified
Elastic Modul for
IITPave
Modified Elastic Modul
for Base Layer
(MR_base’)
10^(a’2+0.977)/0.249
MR_Base’ = 716 Mpa
Modified Elastic Modul
for Base Layer
(MR_Subbase’)
10^(a’2+0.839)/0.227
MR_Subbase = 187 Mpa
10. Revised section from
IIT Pave While Limiting
Permissible Strains
Revised Thickness of
Bound Layers
(BC+DBM) (H bit’)
80 mm
Revised Thickness of
Base Layer (H bas’e)
165 mm
Revised Thickness of
Sub-Base Layer (H
Subbase’)
200 mm
11. Comparison of Revised
Strains
Permissible Tensile
Strain for Given design
traffic (Et permissible)
1.89E-04 (As per fatigue
model calculated before)
Permissible Vertical
Strain for Given design
traffic (Ev permissible)
3.90E-04 (As per fatigue
model calculated before)
Maximum Induced
Tensile strain (Et
induced’)
1.33E-04 (From IIT pave)
Maximum Induced
Vertical strain (Ev
induced’)
3.84E-04 (From IIT pave)
Check for Tensile
Strain
Et Permissible >
1.89E-04 >
Check for Vertical
Et induced
1.33E-04
Strain
Ev Permissible >
3.90E-04
Hence, Safe
Ev induced
3.84E-04
Hence, Safe
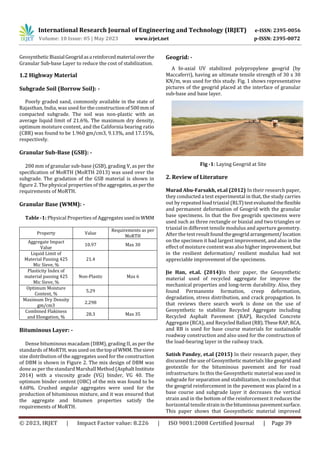
Fig -8: IIT Pave Report
Conclusion
Geogrid reinforcement has increasesignificantlythebearing
capacity of soils. However, allowable settlements, and not
ultimate bearing capacity, generally dictate the design of
spread foundations on cohesionless soils.TheCBRofmarine
clay increases by 50-100% when it is reinforced with a
single layer of geo-grid. The amount of improvement of
strength depends upon the type of soil and position of geo-
grid.
REFERENCES
[1] Krishnaswamy, N.R. and Sudhakar, S. (2005). Analytical
andexperimental Studies on geo-synthetic reinforced
road subgrade.Journal of Indian Road Congress, 66 (1),
151 -200.
[2] IRC: SP 72 (2007). Guidelines for the design of flexible
pavement for low volumeroads.Tavel,P.2007Modeling](https://image.slidesharecdn.com/irjet-v10i505-230626063008-9e1f2ebb/85/Experimental-Study-on-Pavement-Stabilization-Using-Geosynthetic-Solution-9-320.jpg)
![International Research Journal of Engineering and Technology (IRJET) e-ISSN: 2395-0056
Volume: 10 Issue: 05 | May 2023 www.irjet.net p-ISSN: 2395-0072
© 2023, IRJET | Impact Factor value: 8.226 | ISO 9001:2008 Certified Journal | Page 47
and Simulation Design. AK Peters Ltd.R. Nicole, “Title of
paper with only first word capitalized,” J. Name Stand.
Abbrev., in press.
[3] Subba Rao K.S (2000), Swell-shrink behavior of
expensive soils, Geo-technical challenges. Indian
Geotechnical Journal, 30, 1 -69.
[4] Indian Standard: 2720 (Part 16): 1987, Methods oftests
for soil- part (16): Laboratory determination of
California bearing ratio.
[5] Gosavi, M. Patil, K.A Mittal, S. Saran, S. (2004),
Improvementofpropertiesofblack cottonsoil sub-grade
through syntheticreinforcement. Journal, Institution of
Engineers (India), Volume84,pp.257-262.
[6] Chandra, S and Mehndiratta, H.C (2002), effect of
shoulder on life of flexible pavement. HRB -67, Indian
Road Congress, New Delhi, pp 37 -46.G. Eason, B. Noble,
and I.N. Sneddon, “On certain integrals of Lipschitz-
Hankel type involving products of Bessel functions,”
Phil. Trans. Roy. Soc. London, vol. A247, pp. 529- 551,
April 1955.
BIOGRAPHIES
Er. Lokesh Kumar Soni
Research of M. Tech,
Department of Civil
Engineering, University of
Technology, Jaipur](https://image.slidesharecdn.com/irjet-v10i505-230626063008-9e1f2ebb/85/Experimental-Study-on-Pavement-Stabilization-Using-Geosynthetic-Solution-10-320.jpg)

This document summarizes an experimental study on using geosynthetic materials to stabilize pavement. Specifically, it examines using extruded biaxial polypropylene geogrid at the interface of granular sub-base and base layers of a pavement section. The geogrid is proposed to increase the modulus of the granular layers, thereby reducing the required thickness of asphalt and granular layers. A literature review found that geogrid reinforcement can decrease vertical strain and reduce horizontal tensile strain in asphalt pavements. A trial section was designed with geogrid placed between granular base and sub-base layers according to IRC guidelines. Material properties of the subgrade soil, granular layers, asph


