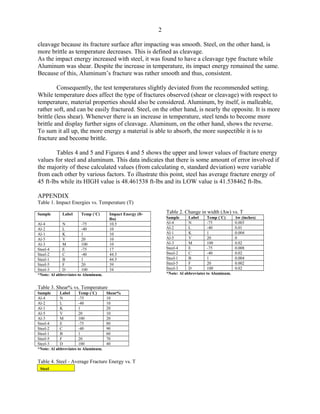
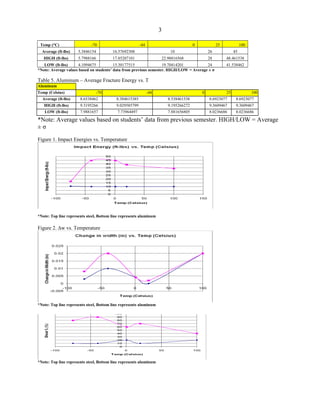
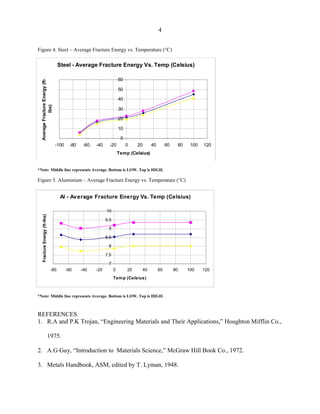
SlideShare a Scribd company logo
1 of 6
1
Memo Report No. I College of Engineering and Computer Science at California State
University, Northridge
Group # 4, Tuesday, Metallographic Observations
To: Lisa R. Reiner
From: Stephanie Ha
Date: September 30, 2008
ABSTRACT
The purpose of this experiment was to investigate the ductile-to-brittle transition in five
samples of 1018-steel and 2024-Aluminum as a function of temperature. The specimens were
placed in different temperature baths ranging from -110˚F (-79˚C) to 212˚F (100˚C) for ten
minutes to reach thermal equilibrium. Specimens were then transferred to a Charpy testing
machine to measure the impact energy (in ft-lbs). After impacting, fracture surfaces were
examined for evidence of shear or cleavage failure and lateral expansion at the breaking point of
the notch. Three curves were obtained to measure fracture energy as a function of temperature
for the steel and aluminum samples. As the temperature increased for steel, its impact energy
increased. However, for aluminum, it remained the same meaning that temperature did not
influence its fracture energy.
DESCRIPTION OF WORK
Initial width of each notch for aluminum and steel samples were measured with vernier
calipers before labeling and placement in different temperature baths. Specimens were taken out
of their temperature baths and impacted with the Charpy testing machine to measure its impact
energy. After this, fracture surfaces were examined using a booklet to estimate the %shear. Final
width was then measured at the root of each notch with vernier calipers.
RESULTS AND DISCUSSION
Data comparing impact energies vs. temperature is illustrated in Table (1) and Figure 1.
As the temperature increased, impact energies for steel varied. Its impact energy rose from 17 ft-
lbs at -75°C to 34 ft-lbs at 100°C. As the table 1 and figure 1 indicates: impact energy for steel
was greatest at -40°C and 1°C with 44.5 ft-lbs. However, aluminum remained consistent at 10 ft-
lbs and on occasion, 10.5 ft-lbs.
From Table 2 and Figure 2, our findings indicated that temperature varied the lateral
expansion of each specimen. In other words, temperature did influence the lateral expansion in
the root of the notch but the components of each temperature bath should be considered.
Table 3 and Figure 3 illustrates the ductile-to-brittle transitions in the aluminum and steel
samples based on their shear%. Based on these estimates, Aluminum has more shear than
2
cleavage because its fracture surface after impacting was smooth. Steel, on the other hand, is
more brittle as temperature decreases. This is defined as cleavage.
As the impact energy increased with steel, it was found to have a cleavage type fracture while
Aluminum was shear. Despite the increase in temperature, its impact energy remained the same.
Because of this, Aluminum’s fracture was rather smooth and thus, consistent.
Consequently, the test temperatures slightly deviated from the recommended setting.
While temperature does affect the type of fractures observed (shear or cleavage) with respect to
temperature, material properties should also be considered. Aluminum, by itself, is malleable,
rather soft, and can be easily fractured. Steel, on the other hand, is nearly the opposite. It is more
brittle (less shear). Whenever there is an increase in temperature, steel tends to become more
brittle and display further signs of cleavage. Aluminum, on the other hand, shows the reverse.
To sum it all up, the more energy a material is able to absorb, the more suspectible it is to
fracture and become brittle.
Tables 4 and 5 and Figures 4 and 5 shows the upper and lower values of fracture energy
values for steel and aluminum. This data indicates that there is some amount of error involved if
the majority of these calculated values (from calculating σ, standard deviation) were variable
from each other by various factors. To illustrate this point, steel has average fracture energy of
45 ft-lbs while its HIGH value is 48.461538 ft-lbs and its LOW value is 41.538462 ft-lbs.
APPENDIX
Table 1. Impact Energies vs. Temperature (T)
Sample Label Temp (˚C) Impact Energy (ft-
lbs)
Al-4 N -75 10.5
Al-2 L -40 10
Al-1 K 1 10
Al-5 V 20 10
Al-3 M 100 10
Steel-4 E -75 17
Steel-2 C -40 44.5
Steel-1 B 1 44.5
Steel-5 F 20 39
Steel-3 D 100 34
*Note: Al abbreviates to Aluminum.
Table 3. Shear% vs. Temperature
Sample Label Temp (˚C) Shear%
Al-4 N -75 10
Al-2 L -40 10
Al-1 K 1 20
Al-5 V 20 10
Al-3 M 100 20
Steel-4 E -75 80
Steel-2 C -40 90
Steel-1 B 1 60
Steel-5 F 20 70
Steel-3 D 100 40
*Note: Al abbreviates to Aluminum.
Table 4. Steel - Average Fracture Energy vs. T
Steel
Table 2. Change in width (Δw) vs. T
Sample Label Temp (˚C) Δw (inches)
Al-4 N -75 0.003
Al-2 L -40 0.01
Al-1 K 1 0.004
Al-5 V 20 0
Al-3 M 100 0.02
Steel-4 E -75 0.008
Steel-2 C -40 0.02
Steel-1 B 1 0.004
Steel-5 F 20 0.002
Steel-3 D 100 0.02
*Note: Al abbreviates to Aluminum.
3
Temp (°C) -70 -44 0 25 100
Average (ft-lbs) 5.3846154 16.57692308 10 26 45
HIGH (ft-lbs) 5.7988166 17.85207101 22.98816568 28 48.461538
LOW (ft-lbs) 4.1094675 15.30177515 19.70414201 24 41.538462
*Note: Average values based on students’ data from previous semester. HIGH/LOW = Average ± σ
Table 5. Aluminum – Average Fracture Energy vs. T
Aluminum
Temp (Celsius) -70 -44 0 25 100
Average (ft-lbs) 8.6538462 8.384615385 8.538461538 8.6923077 8.6923077
HIGH (ft-lbs) 9.3195266 9.029585799 9.195266272 9.3609467 9.3609467
LOW (ft-lbs) 7.9881657 7.73964497 7.881656805 8.0236686 8.0236686
*Note: Average values based on students’ data from previous semester. HIGH/LOW = Average
± σ
Figure 4. Steel - Average Fracture Energies as a Function of Temperature
*Note: Middle line represents average, Top line is HIGH, and Bottom line is LOW
Figure 1. Impact Energies vs. Temperature
*Note: Top line represents steel, Bottom line represents aluminum
Figure 3. Shear% vs. Temperature
*Note: Top line represents steel, Bottom line represents aluminum
Figure 2. Δw vs. Temperature
*Note: Top line represents steel, Bottom line represents aluminum
Steel - Average Fracture Energy Vs. Temp (Celsius)
0
10
20
30
40
50
60
-100 -80 -60 -40 -20 0 20 40 60 80 100 120
Temp (Celsius)
AverageFractureEnergy(ft-
lbs)
4
Figure 4. Steel – Average Fracture Energy vs. Temperature (°C)
*Note: Middle line represents Average. Bottom is LOW. Top is HIGH.
Figure 5. Aluminium – Average Fracture Energy vs. Temperature (°C)
*Note: Middle line represents Average. Bottom is LOW. Top is HIGH.
REFERENCES
1. R.A and P.K Trojan, “Engineering Materials and Their Applications,” Houghton Mifflin Co.,
1975.
2. A.G Guy, “Introduction to Materials Science,” McGraw Hill Book Co., 1972.
3. Metals Handbook, ASM, edited by T. Lyman, 1948.
Al - Average Fracture Energy Vs. Temp (Celsius)
7
7.5
8
8.5
9
9.5
10
-80 -60 -40 -20 0 20 40 60 80 100 120
Temp (Celsius)
FractureEnergy(ft-lbs)
5
5

More Related Content

What's hot

Jornal da física - Física em foco - 3° edição
Jornal da física - Física em foco - 3° ediçãoJornal da física - Física em foco - 3° edição
Jornal da física - Física em foco - 3° ediçãoBreno Shaos
 
Study Of Mechanical Properties On Al 6061 Hybrid Composite by Stir Casting Me...
Study Of Mechanical Properties On Al 6061 Hybrid Composite by Stir Casting Me...Study Of Mechanical Properties On Al 6061 Hybrid Composite by Stir Casting Me...
Study Of Mechanical Properties On Al 6061 Hybrid Composite by Stir Casting Me...IRJET Journal
 
Problema costos de Mecanizado (procesos de fabricacion)
Problema costos de Mecanizado (procesos de fabricacion)Problema costos de Mecanizado (procesos de fabricacion)
Problema costos de Mecanizado (procesos de fabricacion)Miguel Antonio Bula Picon
 
3.metallography experiment (engineering lab)
3.metallography experiment (engineering lab)3.metallography experiment (engineering lab)
3.metallography experiment (engineering lab)Parthibanraj Selvaraj
 
Lab fuerzas de_corte
Lab fuerzas de_corteLab fuerzas de_corte
Lab fuerzas de_cortefqzambrano
 
Bursting Pressure of Mild Steel Cylindrical Vessels
Bursting Pressure of Mild Steel Cylindrical VesselsBursting Pressure of Mild Steel Cylindrical Vessels
Bursting Pressure of Mild Steel Cylindrical VesselsMayank Mehta
 
Bloque A - Teoría de representación de diagramas de esfuerzos - Mecánica de s...
Bloque A - Teoría de representación de diagramas de esfuerzos - Mecánica de s...Bloque A - Teoría de representación de diagramas de esfuerzos - Mecánica de s...
Bloque A - Teoría de representación de diagramas de esfuerzos - Mecánica de s...Maribel Castilla Heredia
 
Solución del modulo de young
Solución del modulo de youngSolución del modulo de young
Solución del modulo de youngprincobudget
 
PROJETO DE CONSTRUCAO SUBESTACOES.pdf
PROJETO DE CONSTRUCAO SUBESTACOES.pdfPROJETO DE CONSTRUCAO SUBESTACOES.pdf
PROJETO DE CONSTRUCAO SUBESTACOES.pdfRogerio Dias Gimenes
 
Hardness conversion chart
Hardness conversion chartHardness conversion chart
Hardness conversion chartDiana Ixchel
 
Microstructure and chemical compositions of ferritic stainless steel
Microstructure and chemical compositions of ferritic stainless steelMicrostructure and chemical compositions of ferritic stainless steel
Microstructure and chemical compositions of ferritic stainless steelGyanendra Awasthi
 

What's hot (20)

Jornal da física - Física em foco - 3° edição
Jornal da física - Física em foco - 3° ediçãoJornal da física - Física em foco - 3° edição
Jornal da física - Física em foco - 3° edição
 
4 tension test
4 tension test4 tension test
4 tension test
 
Aisi 1045
Aisi 1045Aisi 1045
Aisi 1045
 
Tipos de hierro angular
Tipos de hierro angularTipos de hierro angular
Tipos de hierro angular
 
Ch5
Ch5Ch5
Ch5
 
cold work
cold workcold work
cold work
 
Study Of Mechanical Properties On Al 6061 Hybrid Composite by Stir Casting Me...
Study Of Mechanical Properties On Al 6061 Hybrid Composite by Stir Casting Me...Study Of Mechanical Properties On Al 6061 Hybrid Composite by Stir Casting Me...
Study Of Mechanical Properties On Al 6061 Hybrid Composite by Stir Casting Me...
 
Problema costos de Mecanizado (procesos de fabricacion)
Problema costos de Mecanizado (procesos de fabricacion)Problema costos de Mecanizado (procesos de fabricacion)
Problema costos de Mecanizado (procesos de fabricacion)
 
Resistencia de materiales 1 esime
Resistencia de materiales  1 esimeResistencia de materiales  1 esime
Resistencia de materiales 1 esime
 
U4 p1 welding metallurgy
U4 p1 welding metallurgyU4 p1 welding metallurgy
U4 p1 welding metallurgy
 
3.metallography experiment (engineering lab)
3.metallography experiment (engineering lab)3.metallography experiment (engineering lab)
3.metallography experiment (engineering lab)
 
03 rolling of metals
03 rolling of metals03 rolling of metals
03 rolling of metals
 
Lab fuerzas de_corte
Lab fuerzas de_corteLab fuerzas de_corte
Lab fuerzas de_corte
 
Bursting Pressure of Mild Steel Cylindrical Vessels
Bursting Pressure of Mild Steel Cylindrical VesselsBursting Pressure of Mild Steel Cylindrical Vessels
Bursting Pressure of Mild Steel Cylindrical Vessels
 
Phy351 ch 9
Phy351 ch 9Phy351 ch 9
Phy351 ch 9
 
Bloque A - Teoría de representación de diagramas de esfuerzos - Mecánica de s...
Bloque A - Teoría de representación de diagramas de esfuerzos - Mecánica de s...Bloque A - Teoría de representación de diagramas de esfuerzos - Mecánica de s...
Bloque A - Teoría de representación de diagramas de esfuerzos - Mecánica de s...
 
Solución del modulo de young
Solución del modulo de youngSolución del modulo de young
Solución del modulo de young
 
PROJETO DE CONSTRUCAO SUBESTACOES.pdf
PROJETO DE CONSTRUCAO SUBESTACOES.pdfPROJETO DE CONSTRUCAO SUBESTACOES.pdf
PROJETO DE CONSTRUCAO SUBESTACOES.pdf
 
Hardness conversion chart
Hardness conversion chartHardness conversion chart
Hardness conversion chart
 
Microstructure and chemical compositions of ferritic stainless steel
Microstructure and chemical compositions of ferritic stainless steelMicrostructure and chemical compositions of ferritic stainless steel
Microstructure and chemical compositions of ferritic stainless steel
 

Viewers also liked (20)

impact test 10-4
impact test 10-4impact test 10-4
impact test 10-4
 
Impact test
Impact testImpact test
Impact test
 
1499 methods for charpy impact test
1499 methods for charpy impact test1499 methods for charpy impact test
1499 methods for charpy impact test
 
2. Impact Test
2. Impact Test2. Impact Test
2. Impact Test
 
1499 charpy impact tes
1499 charpy impact tes1499 charpy impact tes
1499 charpy impact tes
 
Individual
IndividualIndividual
Individual
 
Technical_Report
Technical_ReportTechnical_Report
Technical_Report
 
BIOLOGY03FinalStudyGuide
BIOLOGY03FinalStudyGuideBIOLOGY03FinalStudyGuide
BIOLOGY03FinalStudyGuide
 
[Speech3] Draft002
[Speech3] Draft002[Speech3] Draft002
[Speech3] Draft002
 
Introduction on aggregate impact testing machine ppt
Introduction on aggregate impact testing machine pptIntroduction on aggregate impact testing machine ppt
Introduction on aggregate impact testing machine ppt
 
Impact test on metals
Impact test on metalsImpact test on metals
Impact test on metals
 
Textile composite testing
Textile composite testingTextile composite testing
Textile composite testing
 
Testing Machine- universal tester
Testing Machine- universal testerTesting Machine- universal tester
Testing Machine- universal tester
 
Tensile test report
Tensile test reportTensile test report
Tensile test report
 
UNIVERSAL MEASURING MACHINE-PPT
UNIVERSAL MEASURING MACHINE-PPTUNIVERSAL MEASURING MACHINE-PPT
UNIVERSAL MEASURING MACHINE-PPT
 
Is2062.2006
Is2062.2006Is2062.2006
Is2062.2006
 
Tensile Strength
Tensile StrengthTensile Strength
Tensile Strength
 
UTM
UTMUTM
UTM
 
Universal testing machines
Universal testing machinesUniversal testing machines
Universal testing machines
 
Universal testing machines
Universal testing machinesUniversal testing machines
Universal testing machines
 

Similar to [EXPERIMENT2] CHARPY IMPACT TESTING MEMO REPORT

The Elevated Temperature Deformation of G115 Steel and the Associated Deforma...
The Elevated Temperature Deformation of G115 Steel and the Associated Deforma...The Elevated Temperature Deformation of G115 Steel and the Associated Deforma...
The Elevated Temperature Deformation of G115 Steel and the Associated Deforma...IJAMSE Journal
 
Steel 4140Left MiddleRight AVGHardness (HRA)42.7.docx
Steel 4140Left MiddleRight AVGHardness (HRA)42.7.docxSteel 4140Left MiddleRight AVGHardness (HRA)42.7.docx
Steel 4140Left MiddleRight AVGHardness (HRA)42.7.docxrafaelaj1
 
Report and Analysis: Resulting Microstructures of Cooled Carbon Steel
Report and Analysis: Resulting Microstructures of Cooled Carbon SteelReport and Analysis: Resulting Microstructures of Cooled Carbon Steel
Report and Analysis: Resulting Microstructures of Cooled Carbon SteelDeAndria Hardy
 
A Study of Anodic Voltage Drop in Aluminum Reduction Cell by Finite Element A...
A Study of Anodic Voltage Drop in Aluminum Reduction Cell by Finite Element A...A Study of Anodic Voltage Drop in Aluminum Reduction Cell by Finite Element A...
A Study of Anodic Voltage Drop in Aluminum Reduction Cell by Finite Element A...IJERA Editor
 
1st research article
1st research article1st research article
1st research articleSravani Pappu
 
Buckling Analysis of Cold Formed Steel Compression Members at Elevated Temper...
Buckling Analysis of Cold Formed Steel Compression Members at Elevated Temper...Buckling Analysis of Cold Formed Steel Compression Members at Elevated Temper...
Buckling Analysis of Cold Formed Steel Compression Members at Elevated Temper...IJMER
 
Example discussion section
Example discussion sectionExample discussion section
Example discussion sectionNadiya Mahjabin
 
13. r stud - rdh 10935-000 - r-stud astm c177 laboratory testing report - 170213
13. r stud - rdh 10935-000 - r-stud astm c177 laboratory testing report - 17021313. r stud - rdh 10935-000 - r-stud astm c177 laboratory testing report - 170213
13. r stud - rdh 10935-000 - r-stud astm c177 laboratory testing report - 170213J. Patrick Lucas
 
Optimization of spheroidized annealing process parameters on AISI 10B21 steel...
Optimization of spheroidized annealing process parameters on AISI 10B21 steel...Optimization of spheroidized annealing process parameters on AISI 10B21 steel...
Optimization of spheroidized annealing process parameters on AISI 10B21 steel...Steffi Wang
 
IMPACT TEST REPORT ...
IMPACT TEST REPORT                                                           ...IMPACT TEST REPORT                                                           ...
IMPACT TEST REPORT ...musadoto
 
EFFECT OF THERMAL EXPOSURE ON THE MECHANICAL AND WEAR PROPERTIES OF AEROSPACE...
EFFECT OF THERMAL EXPOSURE ON THE MECHANICAL AND WEAR PROPERTIES OF AEROSPACE...EFFECT OF THERMAL EXPOSURE ON THE MECHANICAL AND WEAR PROPERTIES OF AEROSPACE...
EFFECT OF THERMAL EXPOSURE ON THE MECHANICAL AND WEAR PROPERTIES OF AEROSPACE...Journal For Research
 
Mustafa ÜBEYLİ
Mustafa ÜBEYLİMustafa ÜBEYLİ
Mustafa ÜBEYLİThinTech
 
Effects of thermo mechanical simulation on the corrosion of steel
Effects of thermo mechanical simulation on the corrosion of steelEffects of thermo mechanical simulation on the corrosion of steel
Effects of thermo mechanical simulation on the corrosion of steelJaideep Adusumelli
 

Similar to [EXPERIMENT2] CHARPY IMPACT TESTING MEMO REPORT (20)

MSE527LImpact (Editted)
MSE527LImpact (Editted)MSE527LImpact (Editted)
MSE527LImpact (Editted)
 
The Elevated Temperature Deformation of G115 Steel and the Associated Deforma...
The Elevated Temperature Deformation of G115 Steel and the Associated Deforma...The Elevated Temperature Deformation of G115 Steel and the Associated Deforma...
The Elevated Temperature Deformation of G115 Steel and the Associated Deforma...
 
SAIMM_article
SAIMM_articleSAIMM_article
SAIMM_article
 
Steel 4140Left MiddleRight AVGHardness (HRA)42.7.docx
Steel 4140Left MiddleRight AVGHardness (HRA)42.7.docxSteel 4140Left MiddleRight AVGHardness (HRA)42.7.docx
Steel 4140Left MiddleRight AVGHardness (HRA)42.7.docx
 
Report and Analysis: Resulting Microstructures of Cooled Carbon Steel
Report and Analysis: Resulting Microstructures of Cooled Carbon SteelReport and Analysis: Resulting Microstructures of Cooled Carbon Steel
Report and Analysis: Resulting Microstructures of Cooled Carbon Steel
 
[IJET-V1I6P9] Authors: Parag Amrutkar, R.R.Borse ,J.G.Patil
[IJET-V1I6P9] Authors: Parag Amrutkar, R.R.Borse ,J.G.Patil  [IJET-V1I6P9] Authors: Parag Amrutkar, R.R.Borse ,J.G.Patil
[IJET-V1I6P9] Authors: Parag Amrutkar, R.R.Borse ,J.G.Patil
 
A Study of Anodic Voltage Drop in Aluminum Reduction Cell by Finite Element A...
A Study of Anodic Voltage Drop in Aluminum Reduction Cell by Finite Element A...A Study of Anodic Voltage Drop in Aluminum Reduction Cell by Finite Element A...
A Study of Anodic Voltage Drop in Aluminum Reduction Cell by Finite Element A...
 
A Study of Anodic Voltage Drop in Aluminum Reduction Cell by Finite Element A...
A Study of Anodic Voltage Drop in Aluminum Reduction Cell by Finite Element A...A Study of Anodic Voltage Drop in Aluminum Reduction Cell by Finite Element A...
A Study of Anodic Voltage Drop in Aluminum Reduction Cell by Finite Element A...
 
1st research article
1st research article1st research article
1st research article
 
Wj 1983 06_s147
Wj 1983 06_s147Wj 1983 06_s147
Wj 1983 06_s147
 
Buckling Analysis of Cold Formed Steel Compression Members at Elevated Temper...
Buckling Analysis of Cold Formed Steel Compression Members at Elevated Temper...Buckling Analysis of Cold Formed Steel Compression Members at Elevated Temper...
Buckling Analysis of Cold Formed Steel Compression Members at Elevated Temper...
 
Twip
TwipTwip
Twip
 
Example discussion section
Example discussion sectionExample discussion section
Example discussion section
 
13. r stud - rdh 10935-000 - r-stud astm c177 laboratory testing report - 170213
13. r stud - rdh 10935-000 - r-stud astm c177 laboratory testing report - 17021313. r stud - rdh 10935-000 - r-stud astm c177 laboratory testing report - 170213
13. r stud - rdh 10935-000 - r-stud astm c177 laboratory testing report - 170213
 
Optimization of spheroidized annealing process parameters on AISI 10B21 steel...
Optimization of spheroidized annealing process parameters on AISI 10B21 steel...Optimization of spheroidized annealing process parameters on AISI 10B21 steel...
Optimization of spheroidized annealing process parameters on AISI 10B21 steel...
 
IMPACT TEST REPORT ...
IMPACT TEST REPORT                                                           ...IMPACT TEST REPORT                                                           ...
IMPACT TEST REPORT ...
 
EFFECT OF THERMAL EXPOSURE ON THE MECHANICAL AND WEAR PROPERTIES OF AEROSPACE...
EFFECT OF THERMAL EXPOSURE ON THE MECHANICAL AND WEAR PROPERTIES OF AEROSPACE...EFFECT OF THERMAL EXPOSURE ON THE MECHANICAL AND WEAR PROPERTIES OF AEROSPACE...
EFFECT OF THERMAL EXPOSURE ON THE MECHANICAL AND WEAR PROPERTIES OF AEROSPACE...
 
Project2Report.docx
Project2Report.docxProject2Report.docx
Project2Report.docx
 
Mustafa ÜBEYLİ
Mustafa ÜBEYLİMustafa ÜBEYLİ
Mustafa ÜBEYLİ
 
Effects of thermo mechanical simulation on the corrosion of steel
Effects of thermo mechanical simulation on the corrosion of steelEffects of thermo mechanical simulation on the corrosion of steel
Effects of thermo mechanical simulation on the corrosion of steel
 

[EXPERIMENT2] CHARPY IMPACT TESTING MEMO REPORT

  • 1. 1 Memo Report No. I College of Engineering and Computer Science at California State University, Northridge Group # 4, Tuesday, Metallographic Observations To: Lisa R. Reiner From: Stephanie Ha Date: September 30, 2008 ABSTRACT The purpose of this experiment was to investigate the ductile-to-brittle transition in five samples of 1018-steel and 2024-Aluminum as a function of temperature. The specimens were placed in different temperature baths ranging from -110˚F (-79˚C) to 212˚F (100˚C) for ten minutes to reach thermal equilibrium. Specimens were then transferred to a Charpy testing machine to measure the impact energy (in ft-lbs). After impacting, fracture surfaces were examined for evidence of shear or cleavage failure and lateral expansion at the breaking point of the notch. Three curves were obtained to measure fracture energy as a function of temperature for the steel and aluminum samples. As the temperature increased for steel, its impact energy increased. However, for aluminum, it remained the same meaning that temperature did not influence its fracture energy. DESCRIPTION OF WORK Initial width of each notch for aluminum and steel samples were measured with vernier calipers before labeling and placement in different temperature baths. Specimens were taken out of their temperature baths and impacted with the Charpy testing machine to measure its impact energy. After this, fracture surfaces were examined using a booklet to estimate the %shear. Final width was then measured at the root of each notch with vernier calipers. RESULTS AND DISCUSSION Data comparing impact energies vs. temperature is illustrated in Table (1) and Figure 1. As the temperature increased, impact energies for steel varied. Its impact energy rose from 17 ft- lbs at -75°C to 34 ft-lbs at 100°C. As the table 1 and figure 1 indicates: impact energy for steel was greatest at -40°C and 1°C with 44.5 ft-lbs. However, aluminum remained consistent at 10 ft- lbs and on occasion, 10.5 ft-lbs. From Table 2 and Figure 2, our findings indicated that temperature varied the lateral expansion of each specimen. In other words, temperature did influence the lateral expansion in the root of the notch but the components of each temperature bath should be considered. Table 3 and Figure 3 illustrates the ductile-to-brittle transitions in the aluminum and steel samples based on their shear%. Based on these estimates, Aluminum has more shear than
  • 2. 2 cleavage because its fracture surface after impacting was smooth. Steel, on the other hand, is more brittle as temperature decreases. This is defined as cleavage. As the impact energy increased with steel, it was found to have a cleavage type fracture while Aluminum was shear. Despite the increase in temperature, its impact energy remained the same. Because of this, Aluminum’s fracture was rather smooth and thus, consistent. Consequently, the test temperatures slightly deviated from the recommended setting. While temperature does affect the type of fractures observed (shear or cleavage) with respect to temperature, material properties should also be considered. Aluminum, by itself, is malleable, rather soft, and can be easily fractured. Steel, on the other hand, is nearly the opposite. It is more brittle (less shear). Whenever there is an increase in temperature, steel tends to become more brittle and display further signs of cleavage. Aluminum, on the other hand, shows the reverse. To sum it all up, the more energy a material is able to absorb, the more suspectible it is to fracture and become brittle. Tables 4 and 5 and Figures 4 and 5 shows the upper and lower values of fracture energy values for steel and aluminum. This data indicates that there is some amount of error involved if the majority of these calculated values (from calculating σ, standard deviation) were variable from each other by various factors. To illustrate this point, steel has average fracture energy of 45 ft-lbs while its HIGH value is 48.461538 ft-lbs and its LOW value is 41.538462 ft-lbs. APPENDIX Table 1. Impact Energies vs. Temperature (T) Sample Label Temp (˚C) Impact Energy (ft- lbs) Al-4 N -75 10.5 Al-2 L -40 10 Al-1 K 1 10 Al-5 V 20 10 Al-3 M 100 10 Steel-4 E -75 17 Steel-2 C -40 44.5 Steel-1 B 1 44.5 Steel-5 F 20 39 Steel-3 D 100 34 *Note: Al abbreviates to Aluminum. Table 3. Shear% vs. Temperature Sample Label Temp (˚C) Shear% Al-4 N -75 10 Al-2 L -40 10 Al-1 K 1 20 Al-5 V 20 10 Al-3 M 100 20 Steel-4 E -75 80 Steel-2 C -40 90 Steel-1 B 1 60 Steel-5 F 20 70 Steel-3 D 100 40 *Note: Al abbreviates to Aluminum. Table 4. Steel - Average Fracture Energy vs. T Steel Table 2. Change in width (Δw) vs. T Sample Label Temp (˚C) Δw (inches) Al-4 N -75 0.003 Al-2 L -40 0.01 Al-1 K 1 0.004 Al-5 V 20 0 Al-3 M 100 0.02 Steel-4 E -75 0.008 Steel-2 C -40 0.02 Steel-1 B 1 0.004 Steel-5 F 20 0.002 Steel-3 D 100 0.02 *Note: Al abbreviates to Aluminum.
  • 3. 3 Temp (°C) -70 -44 0 25 100 Average (ft-lbs) 5.3846154 16.57692308 10 26 45 HIGH (ft-lbs) 5.7988166 17.85207101 22.98816568 28 48.461538 LOW (ft-lbs) 4.1094675 15.30177515 19.70414201 24 41.538462 *Note: Average values based on students’ data from previous semester. HIGH/LOW = Average ± σ Table 5. Aluminum – Average Fracture Energy vs. T Aluminum Temp (Celsius) -70 -44 0 25 100 Average (ft-lbs) 8.6538462 8.384615385 8.538461538 8.6923077 8.6923077 HIGH (ft-lbs) 9.3195266 9.029585799 9.195266272 9.3609467 9.3609467 LOW (ft-lbs) 7.9881657 7.73964497 7.881656805 8.0236686 8.0236686 *Note: Average values based on students’ data from previous semester. HIGH/LOW = Average ± σ Figure 4. Steel - Average Fracture Energies as a Function of Temperature *Note: Middle line represents average, Top line is HIGH, and Bottom line is LOW Figure 1. Impact Energies vs. Temperature *Note: Top line represents steel, Bottom line represents aluminum Figure 3. Shear% vs. Temperature *Note: Top line represents steel, Bottom line represents aluminum Figure 2. Δw vs. Temperature *Note: Top line represents steel, Bottom line represents aluminum
  • 4. Steel - Average Fracture Energy Vs. Temp (Celsius) 0 10 20 30 40 50 60 -100 -80 -60 -40 -20 0 20 40 60 80 100 120 Temp (Celsius) AverageFractureEnergy(ft- lbs) 4 Figure 4. Steel – Average Fracture Energy vs. Temperature (°C) *Note: Middle line represents Average. Bottom is LOW. Top is HIGH. Figure 5. Aluminium – Average Fracture Energy vs. Temperature (°C) *Note: Middle line represents Average. Bottom is LOW. Top is HIGH. REFERENCES 1. R.A and P.K Trojan, “Engineering Materials and Their Applications,” Houghton Mifflin Co., 1975. 2. A.G Guy, “Introduction to Materials Science,” McGraw Hill Book Co., 1972. 3. Metals Handbook, ASM, edited by T. Lyman, 1948. Al - Average Fracture Energy Vs. Temp (Celsius) 7 7.5 8 8.5 9 9.5 10 -80 -60 -40 -20 0 20 40 60 80 100 120 Temp (Celsius) FractureEnergy(ft-lbs)
  • 5. 5
  • 6. 5