Download to read offline

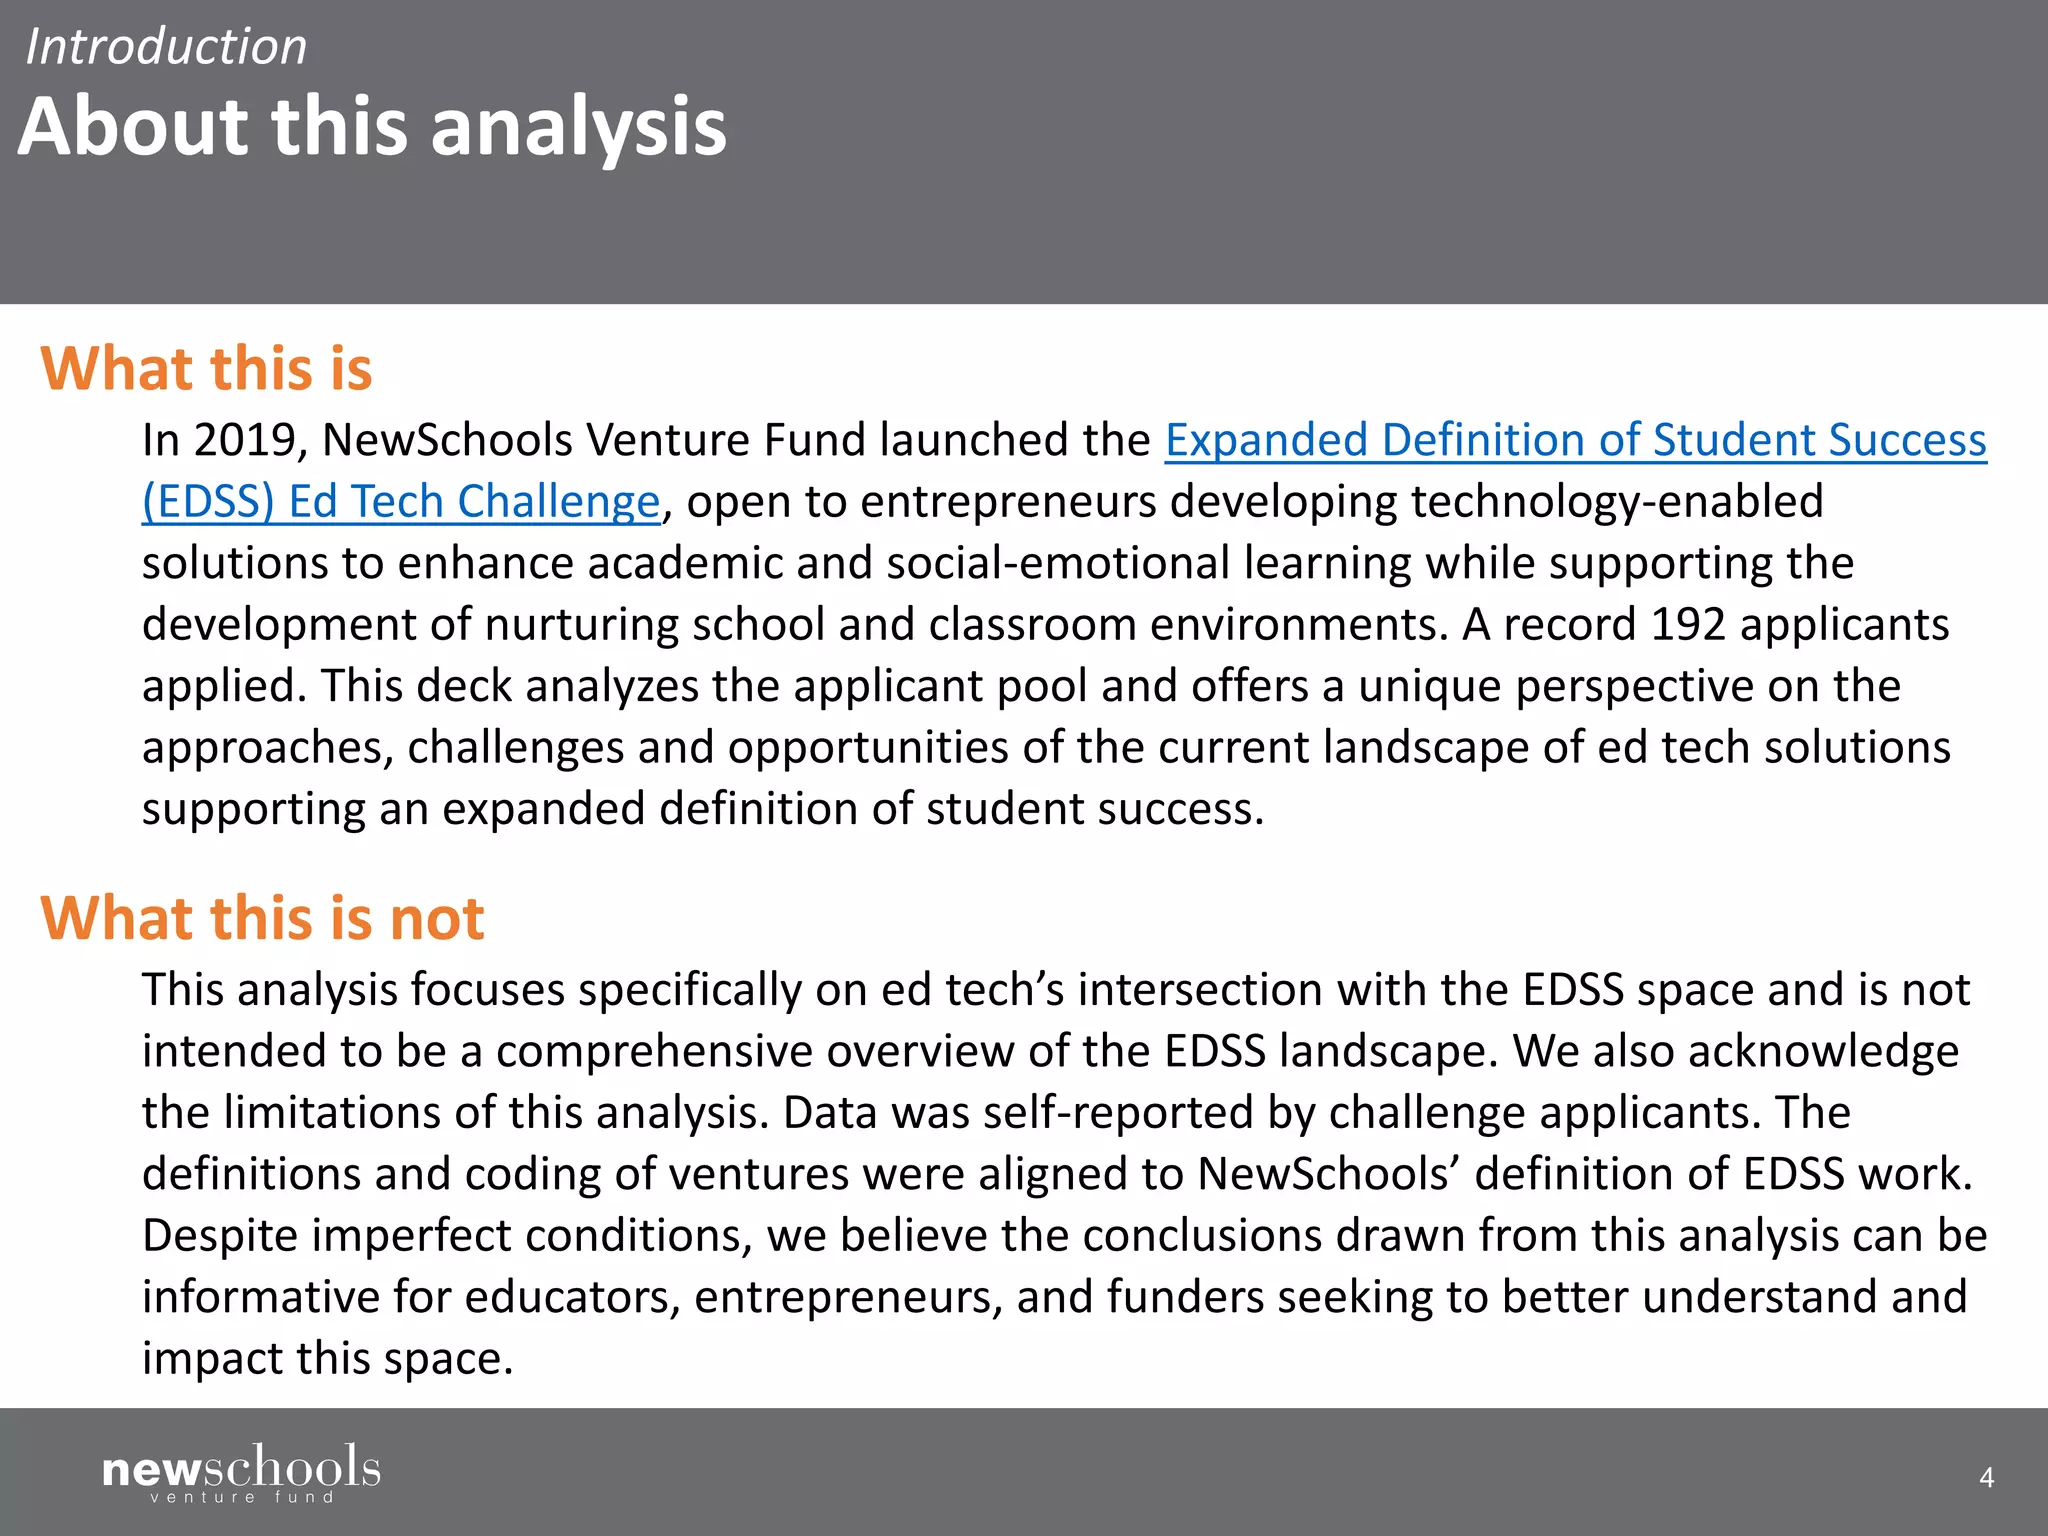
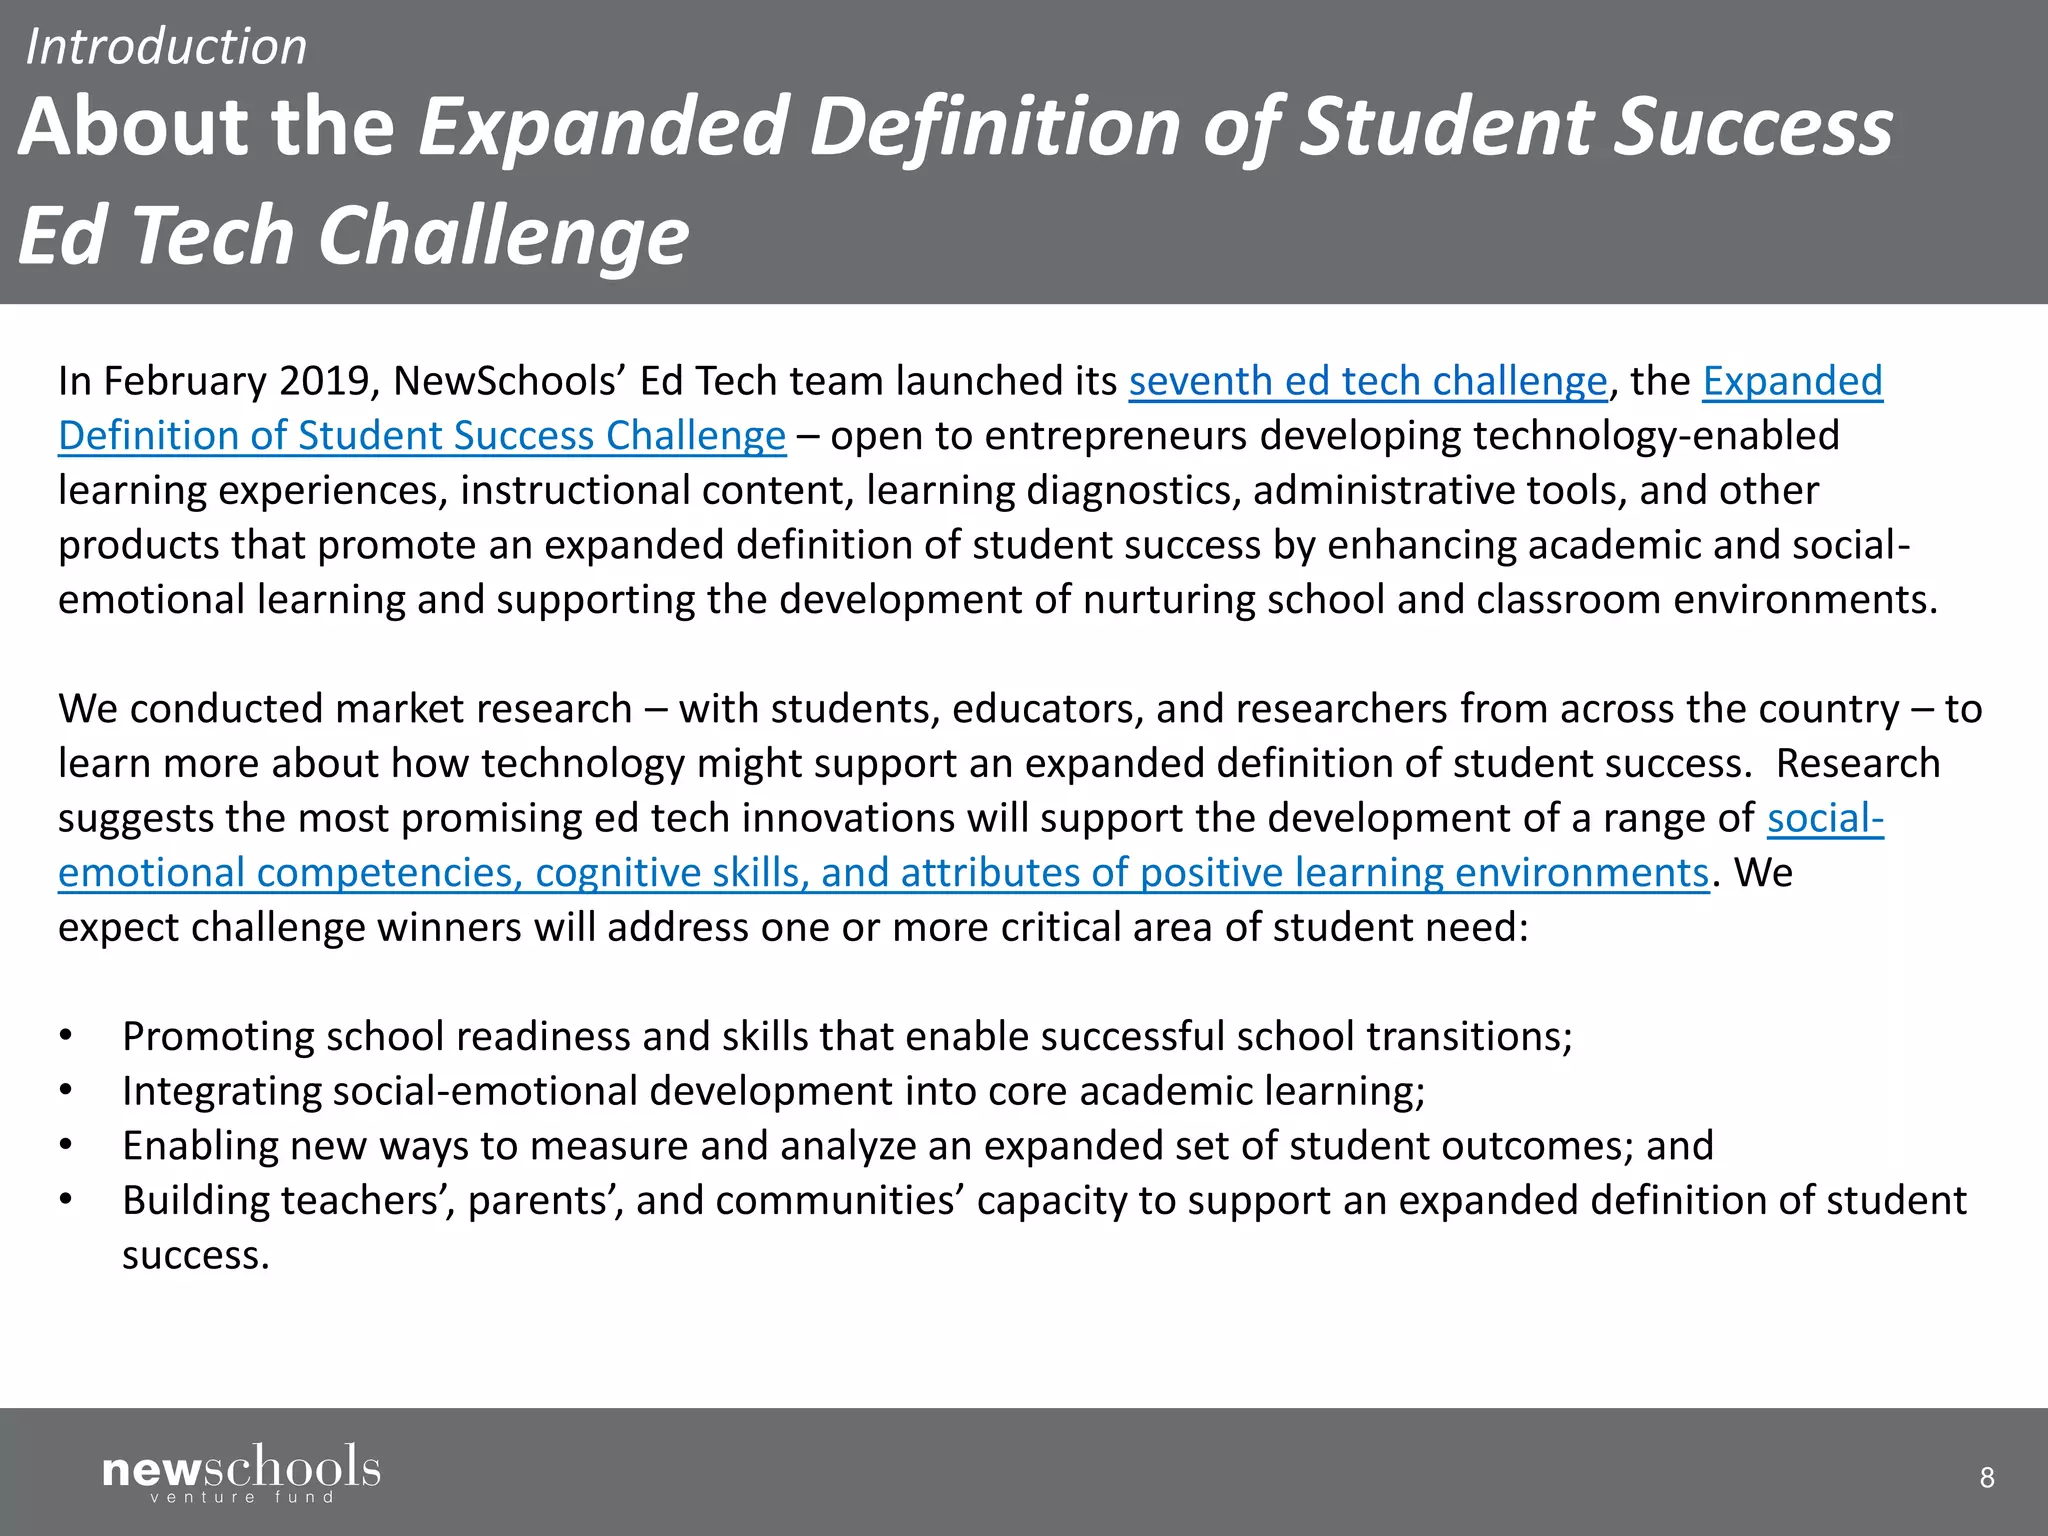
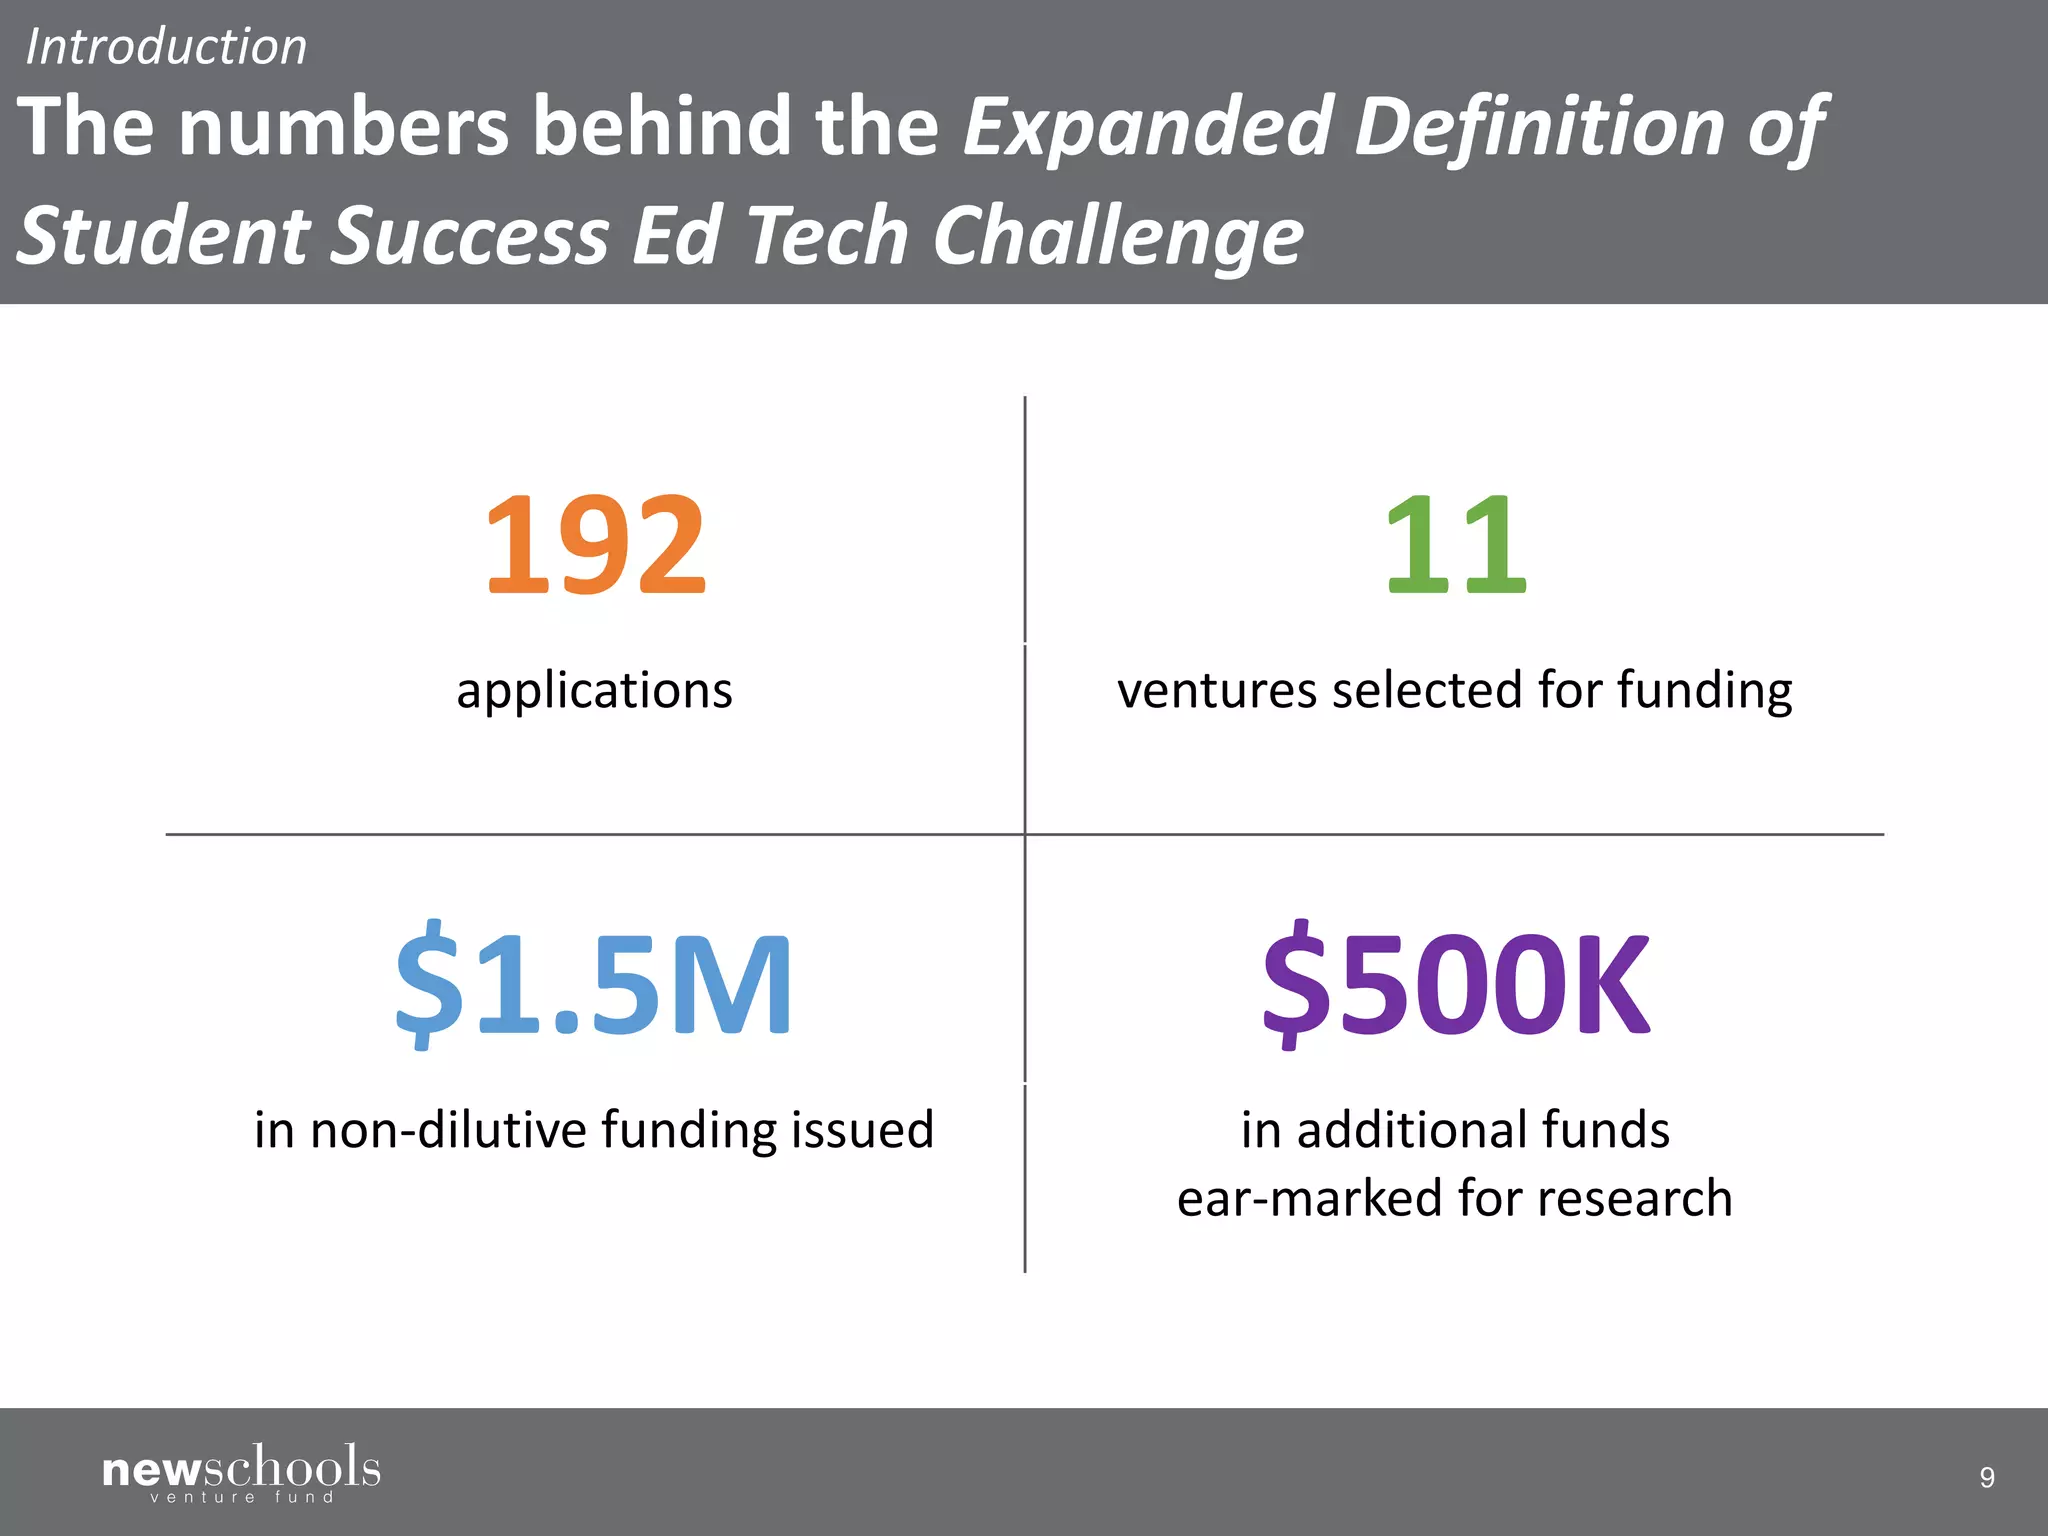

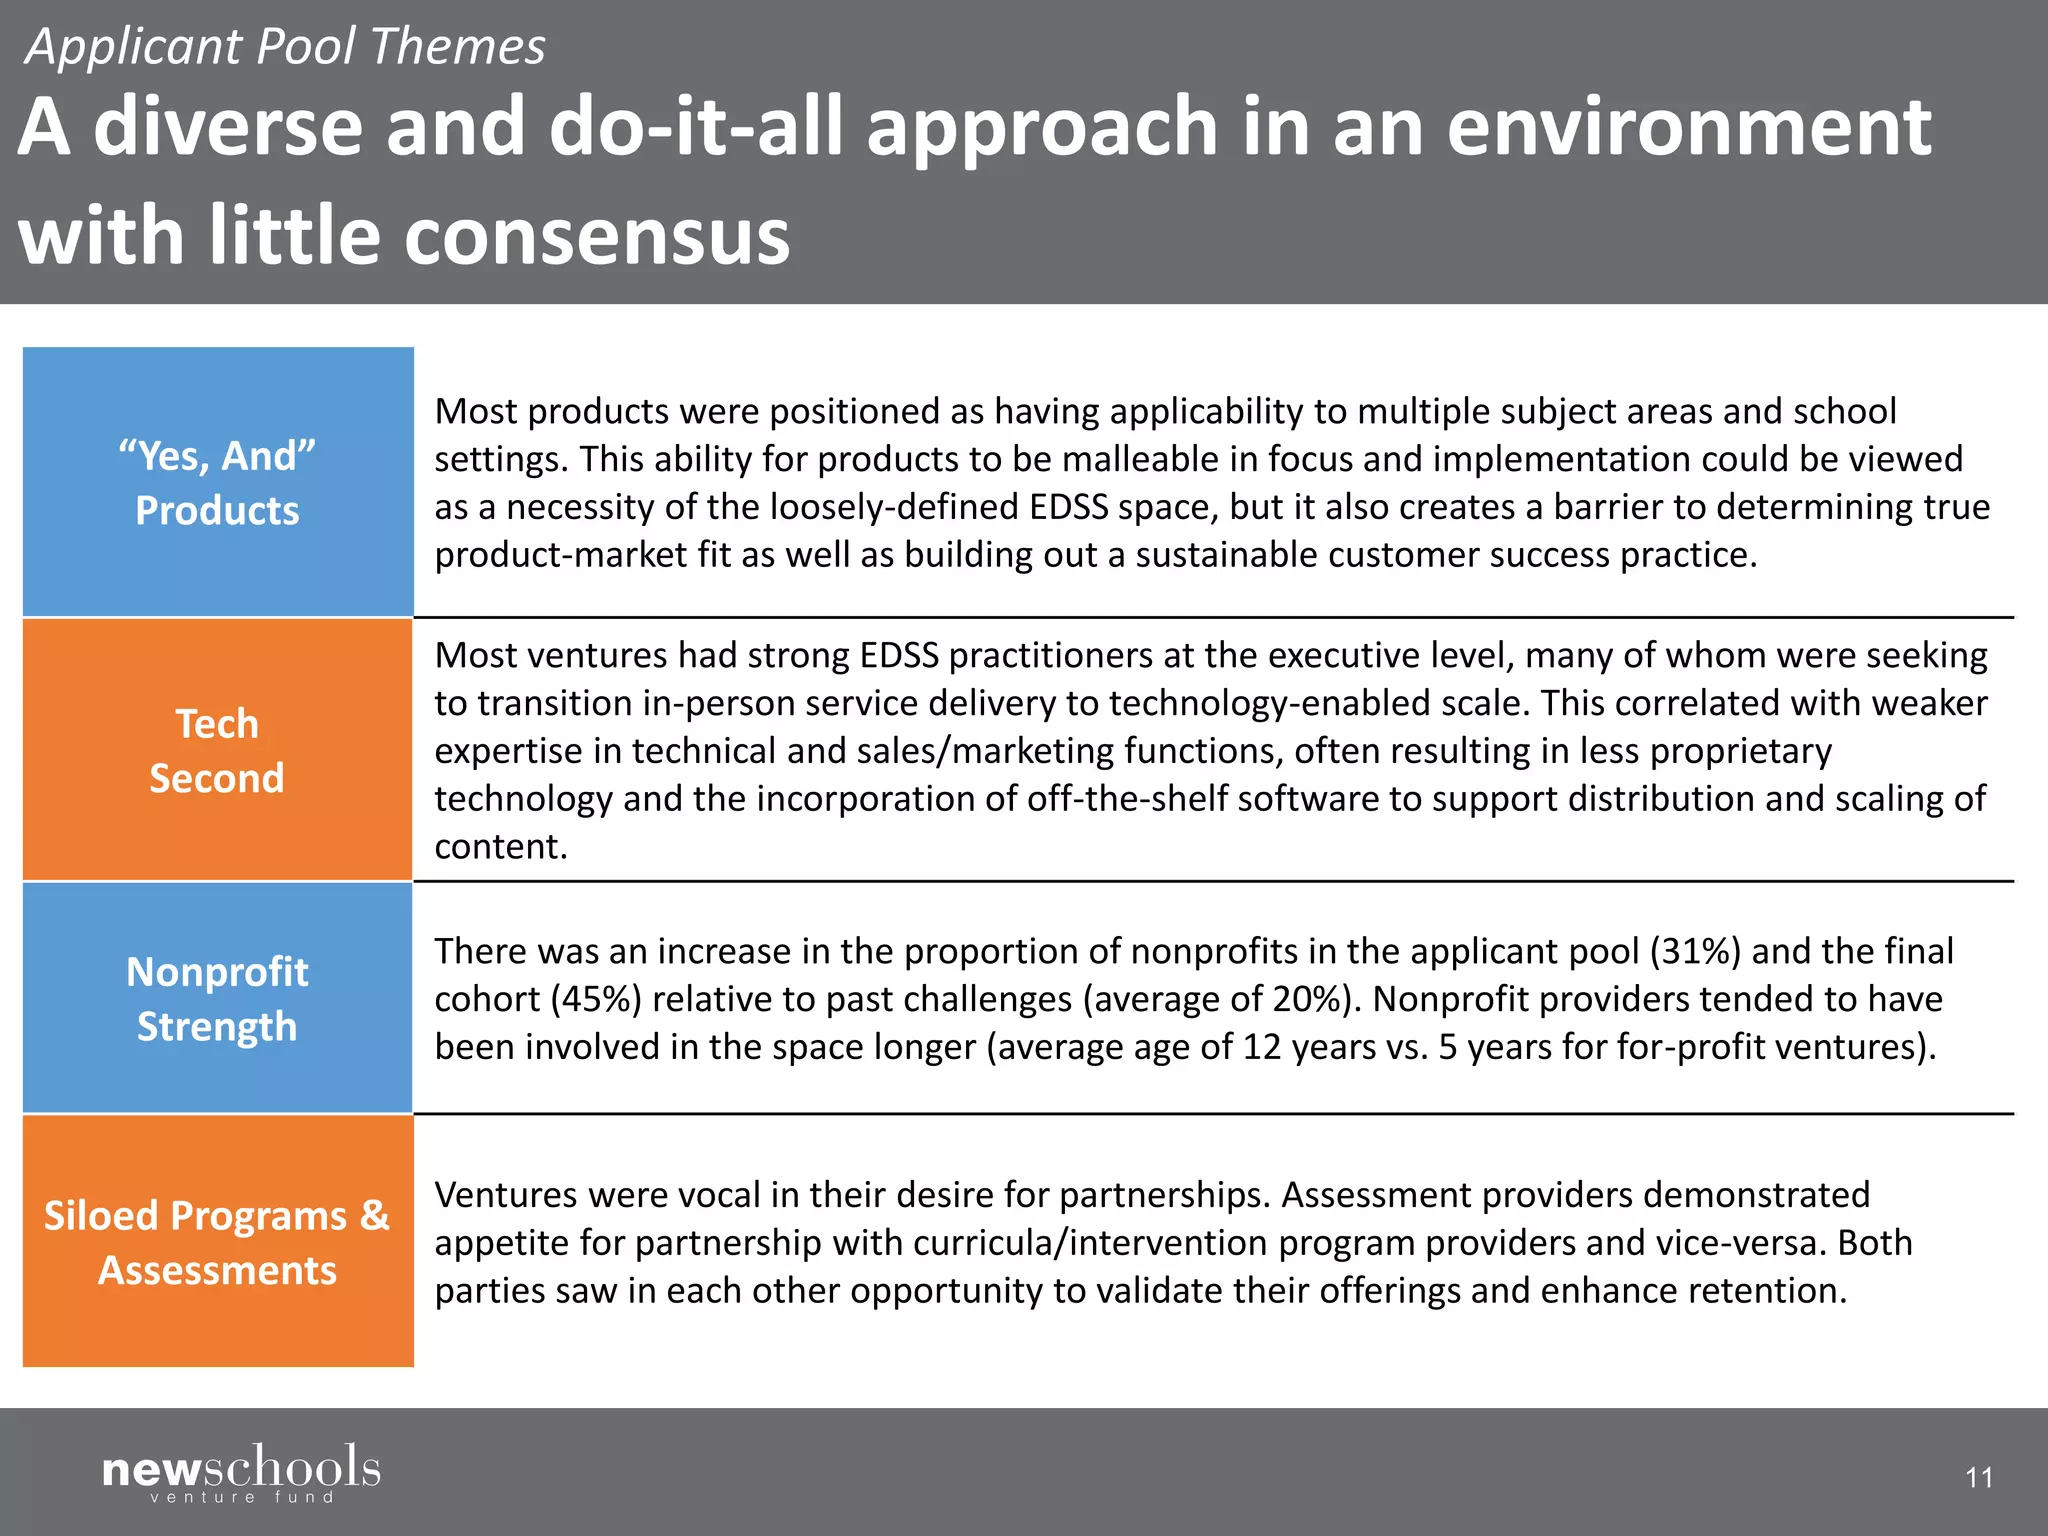
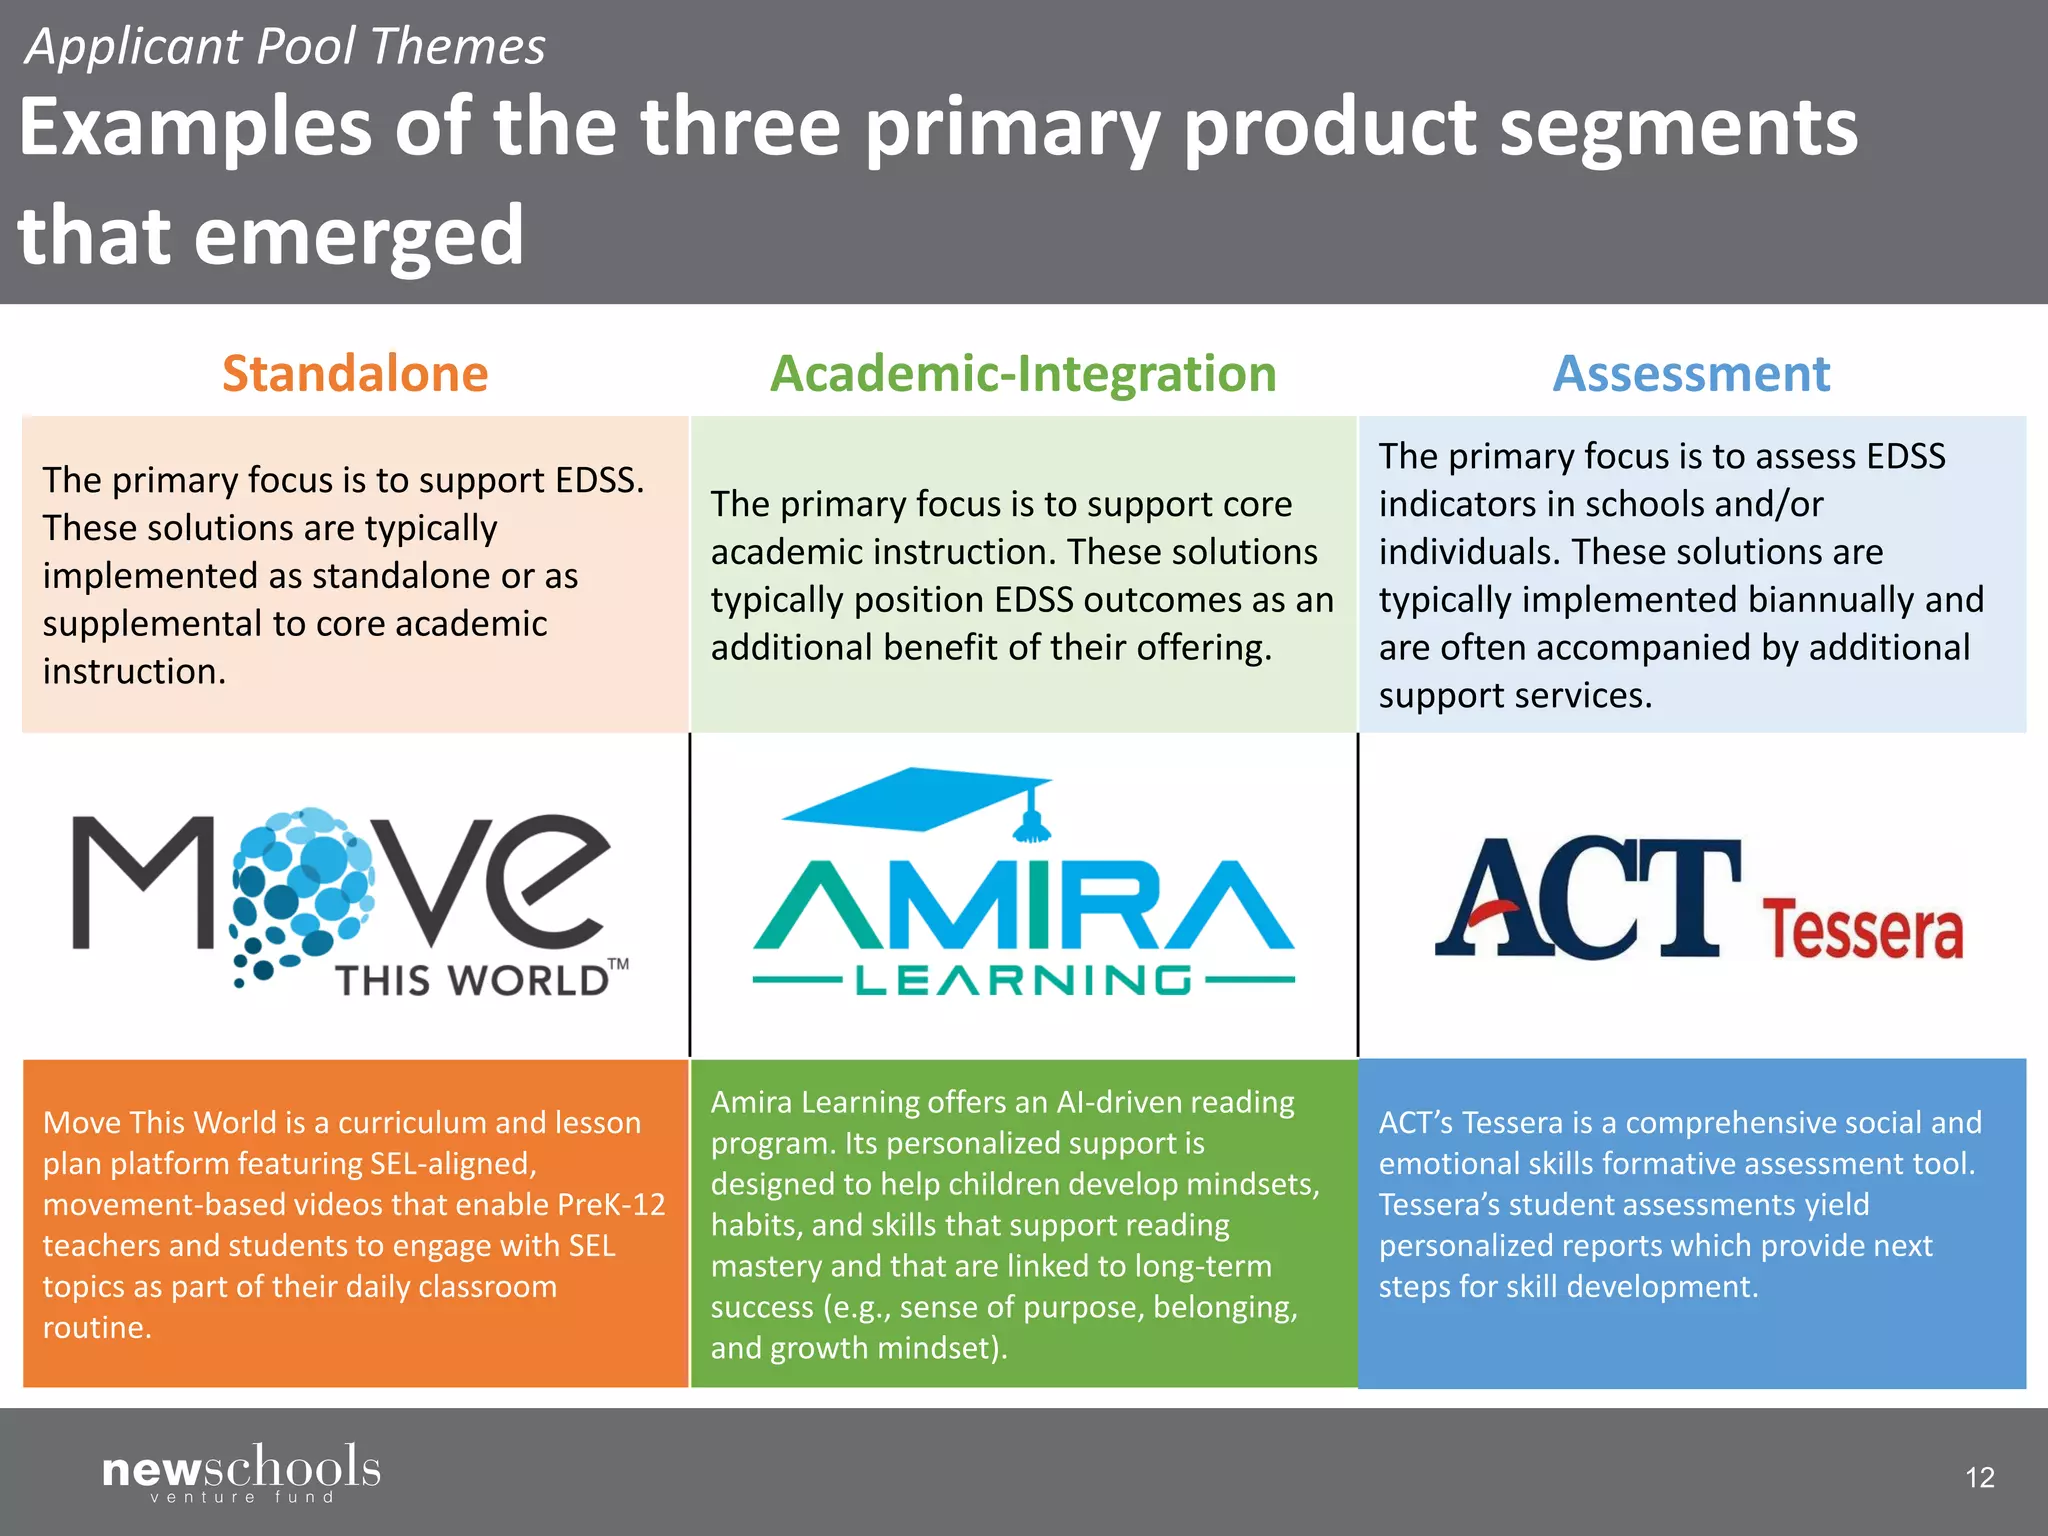

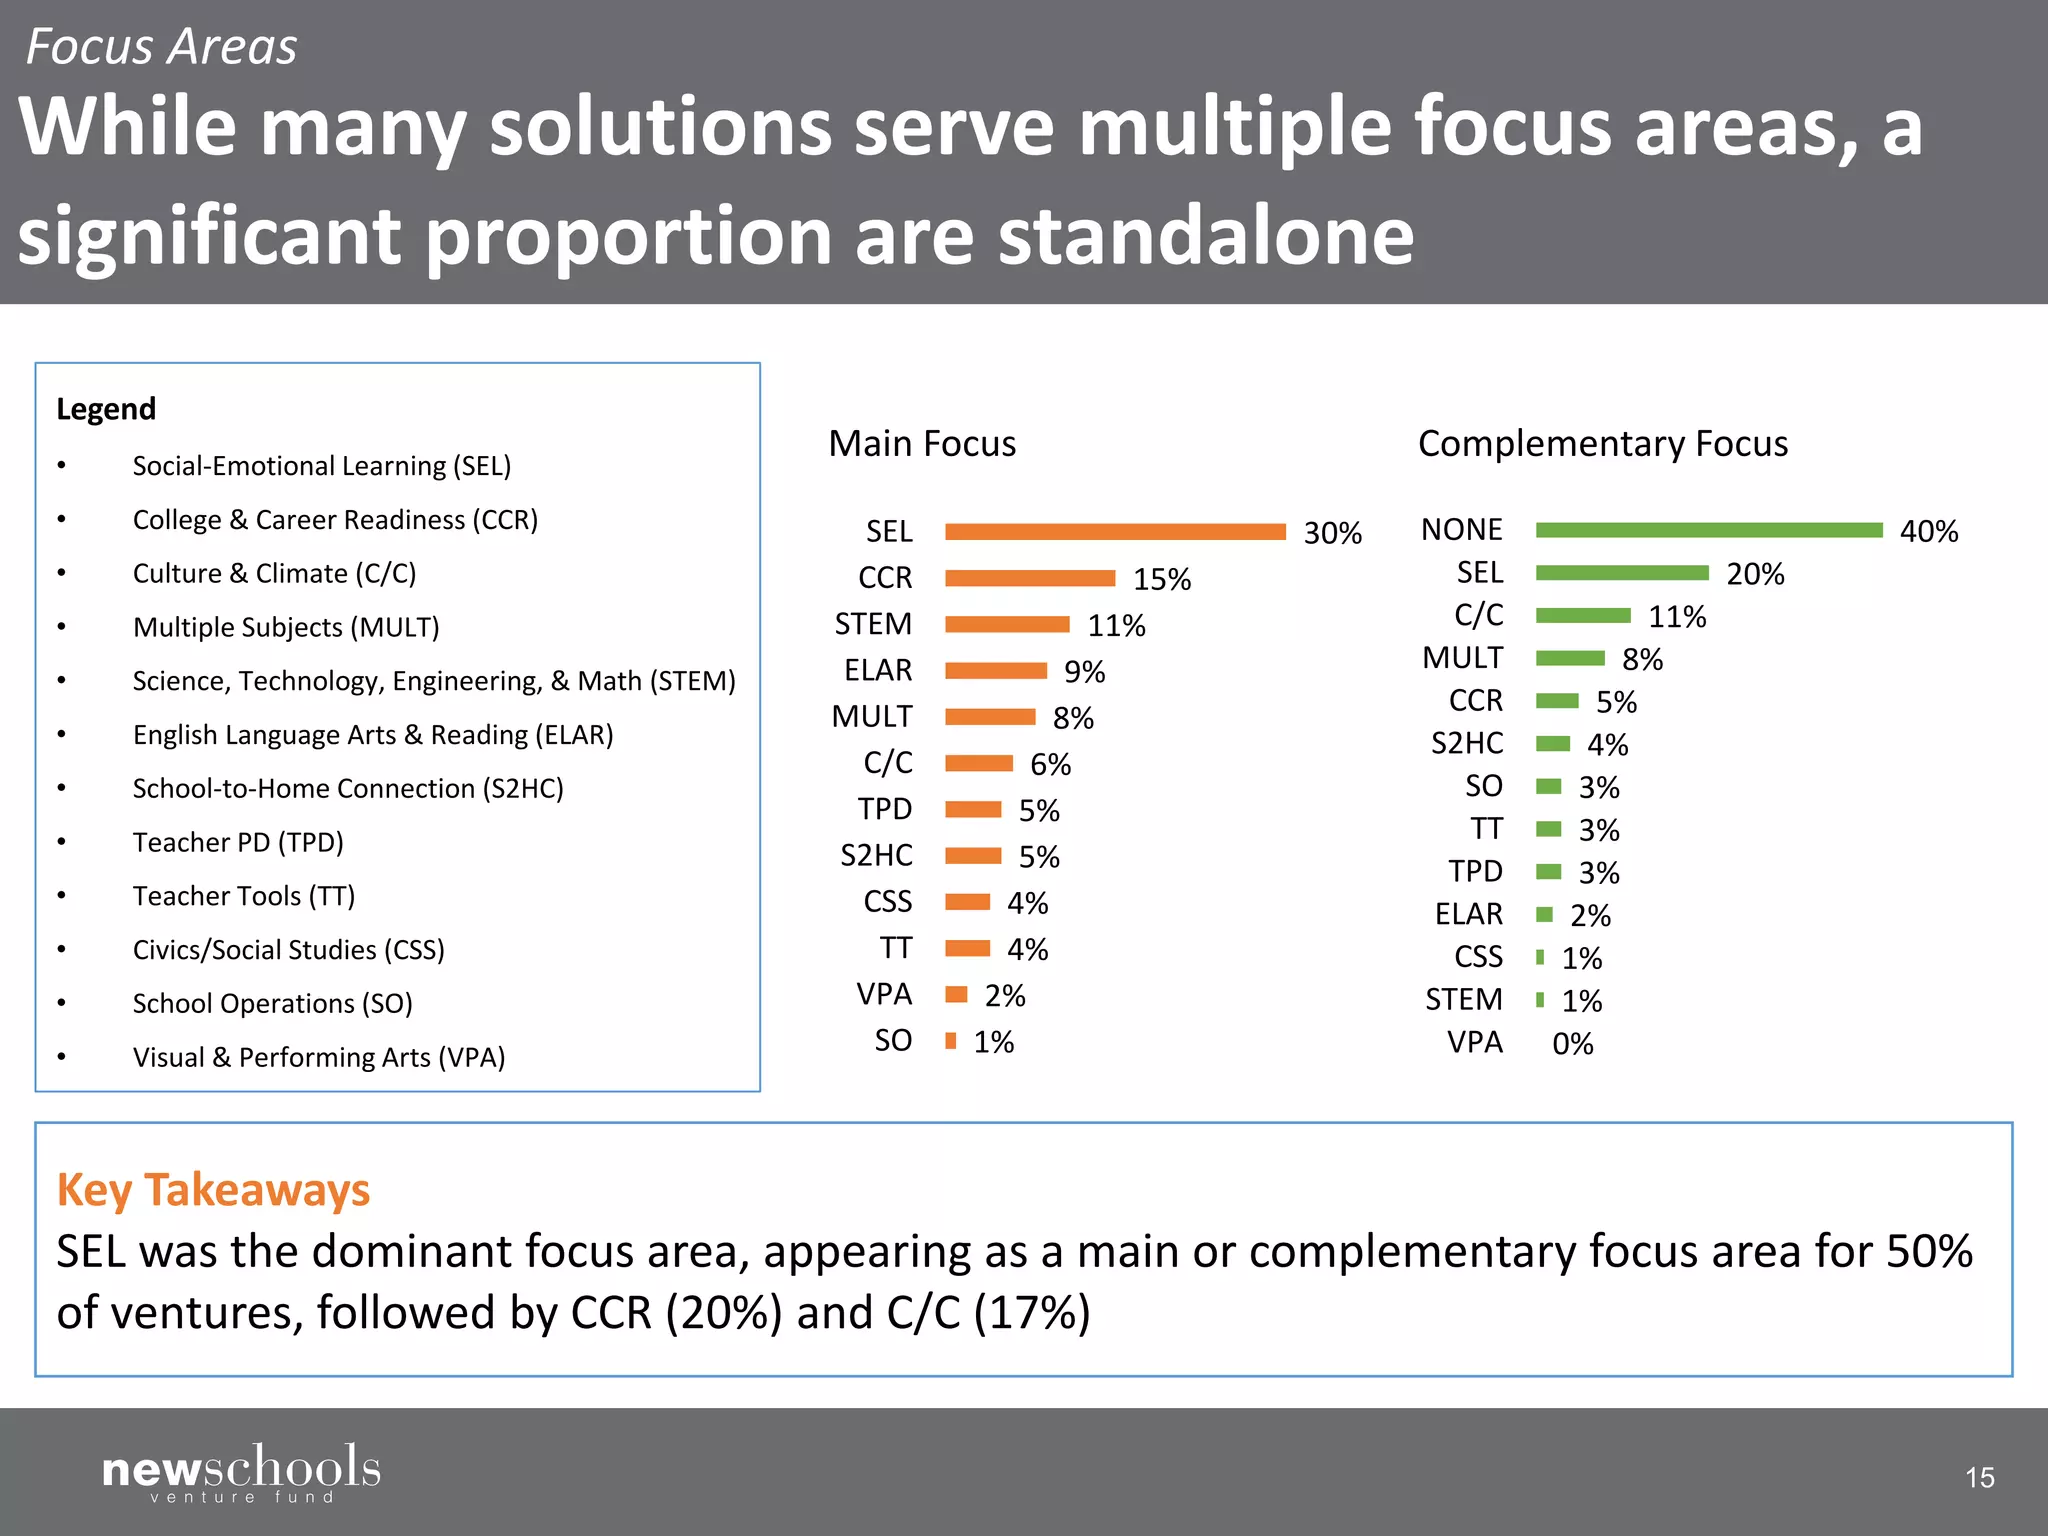

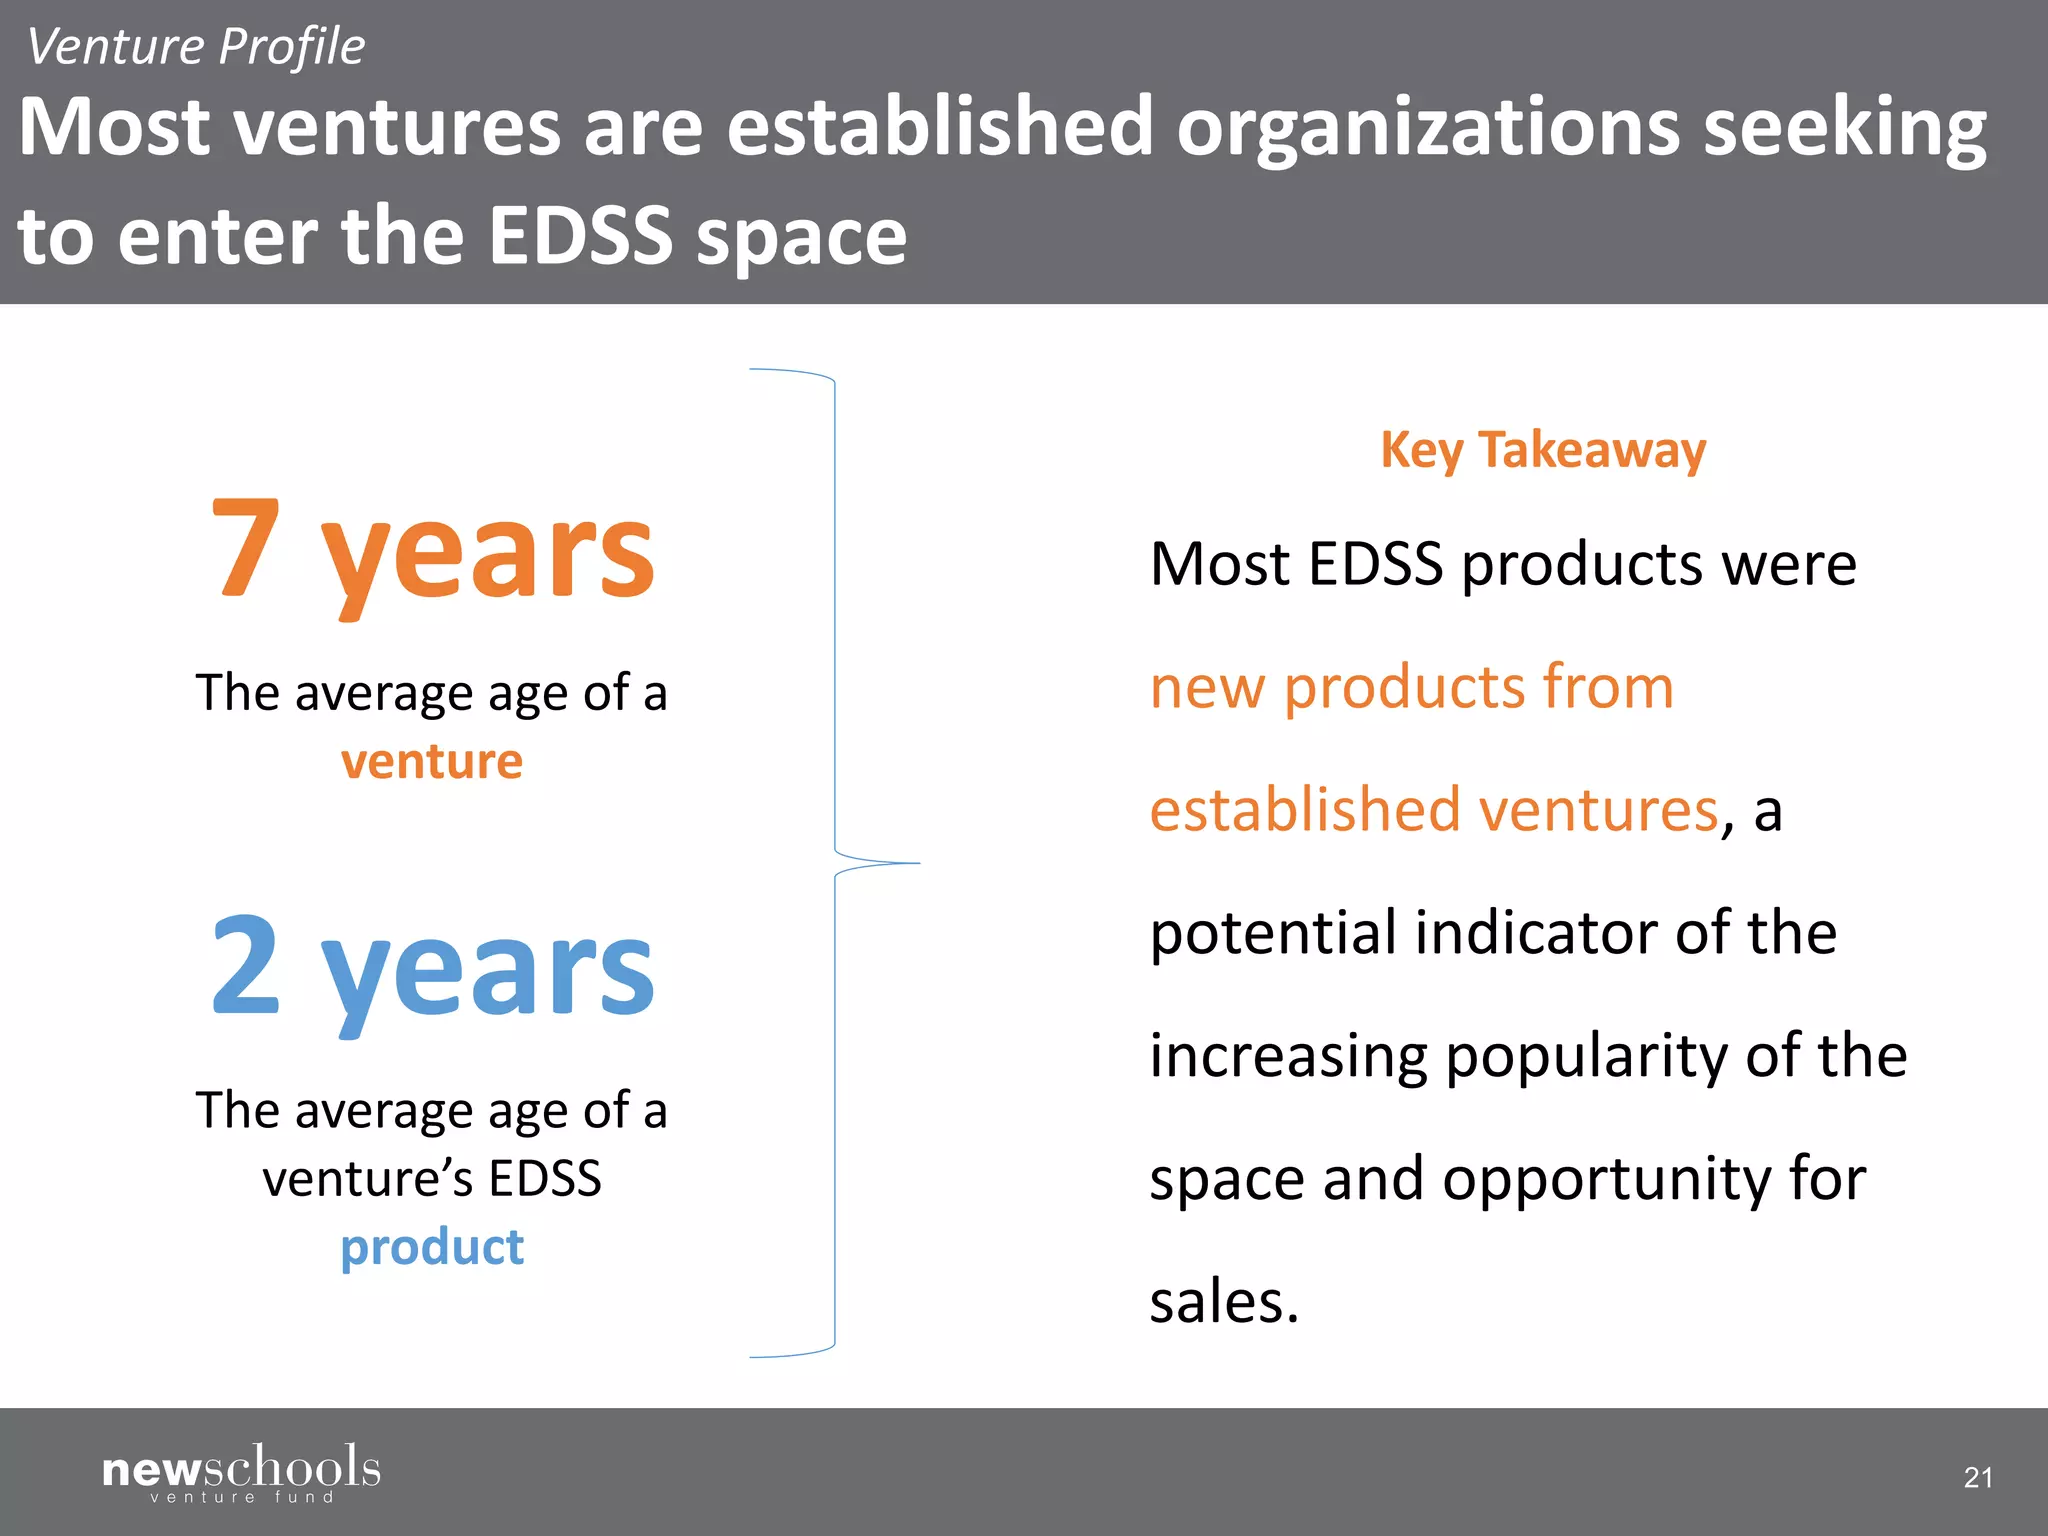
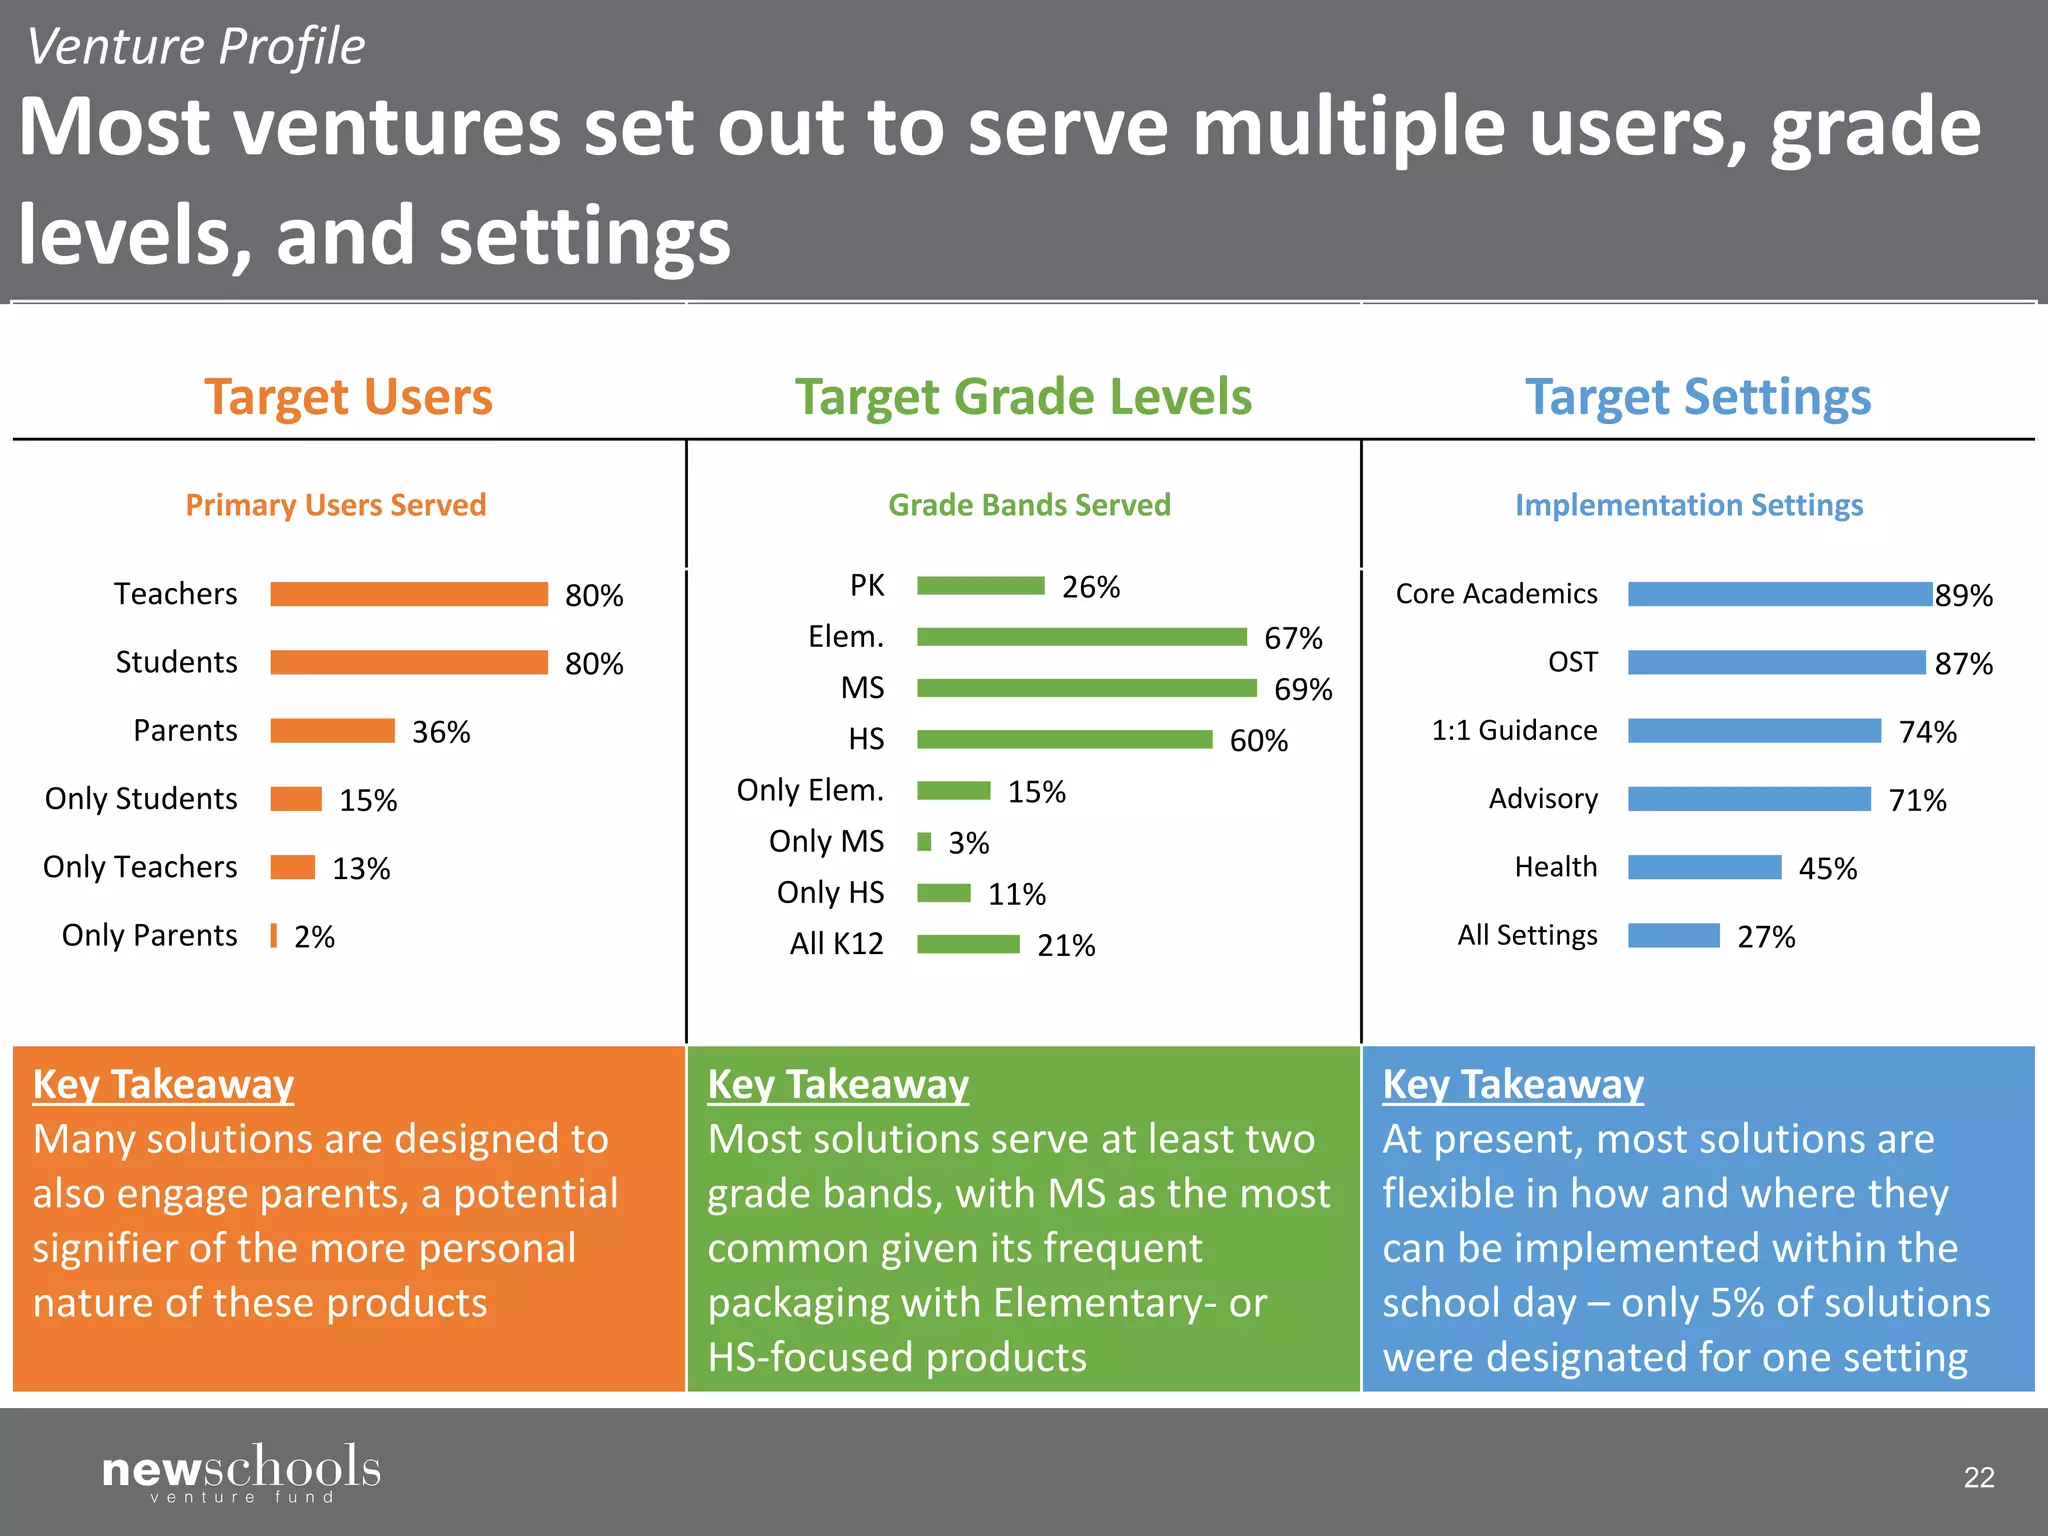
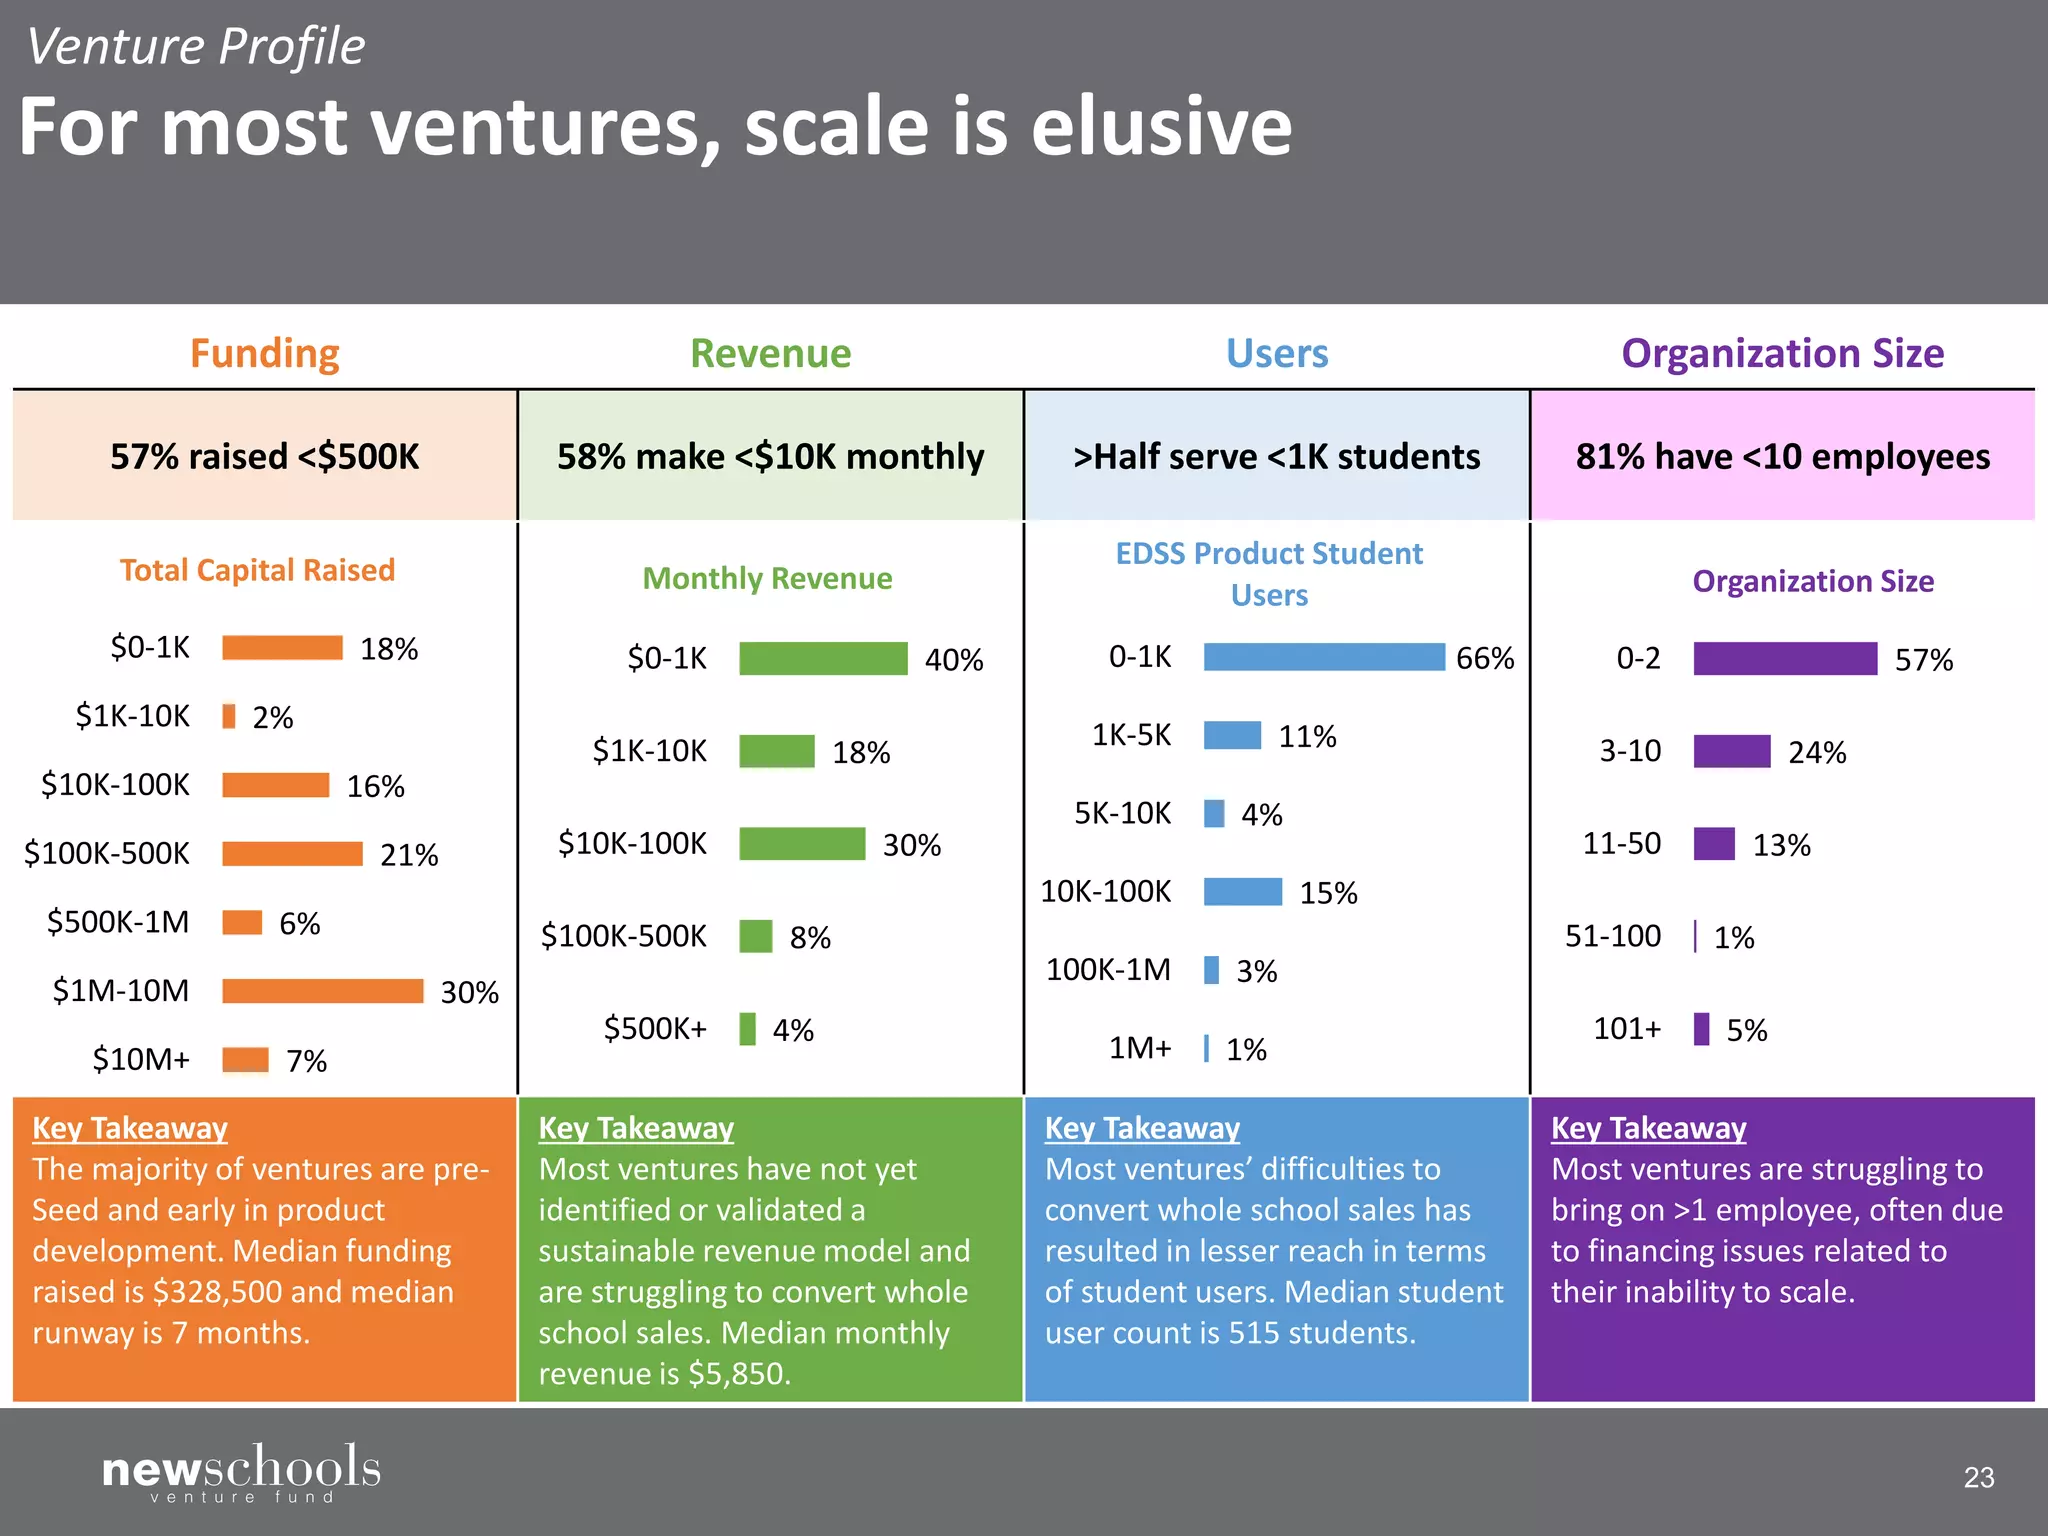
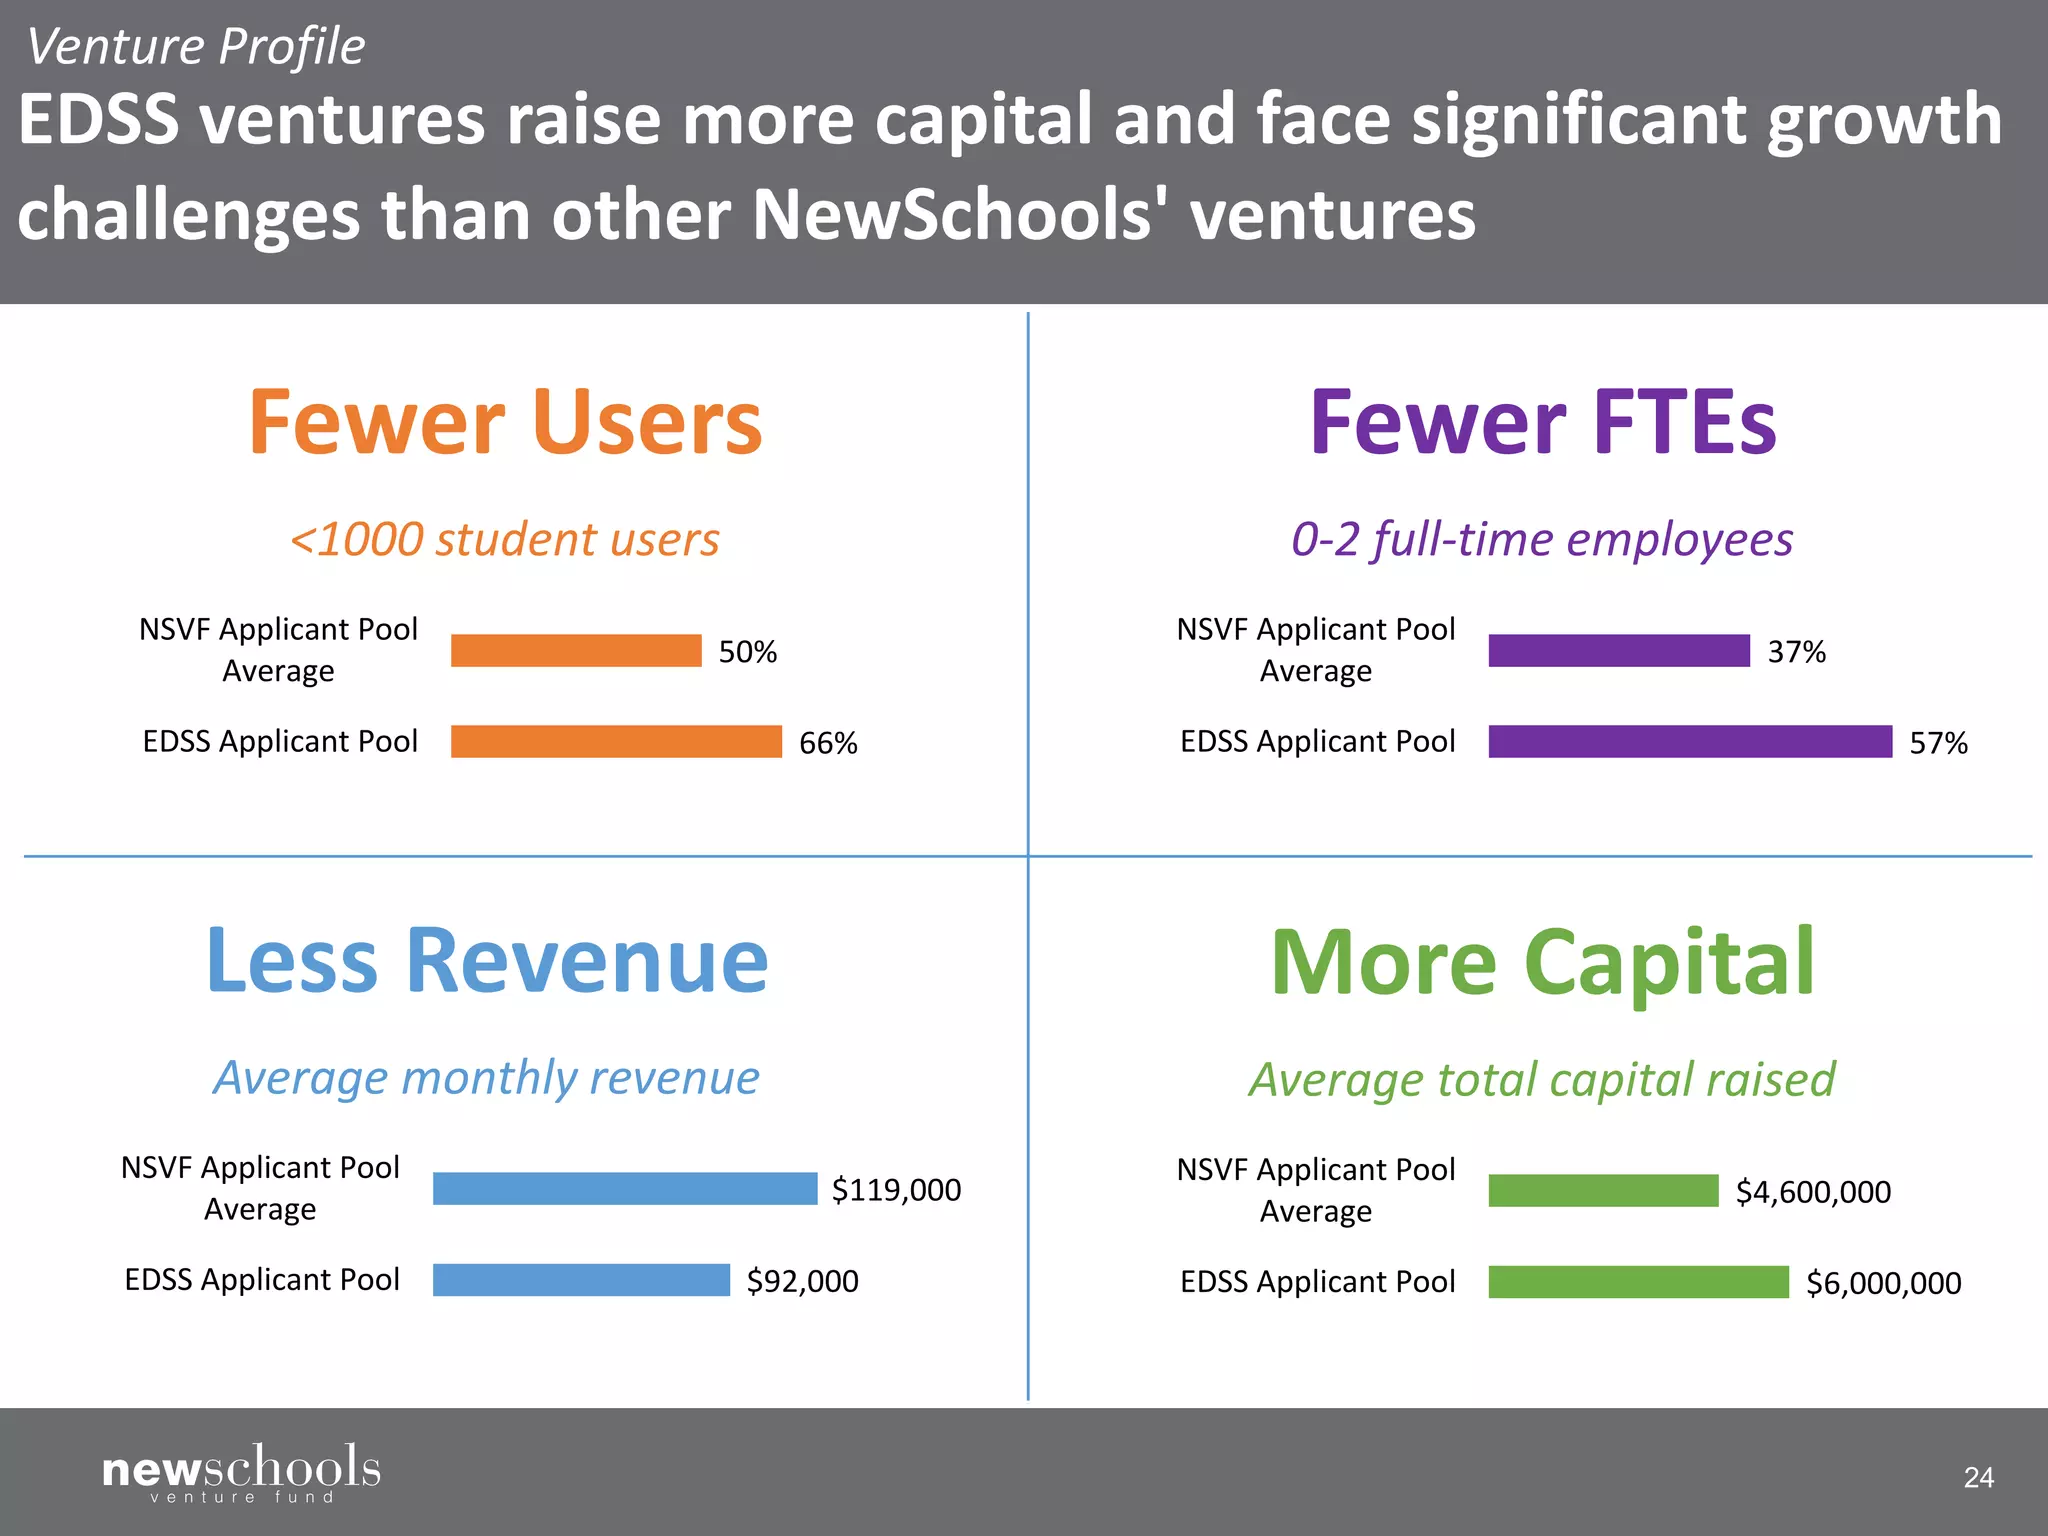


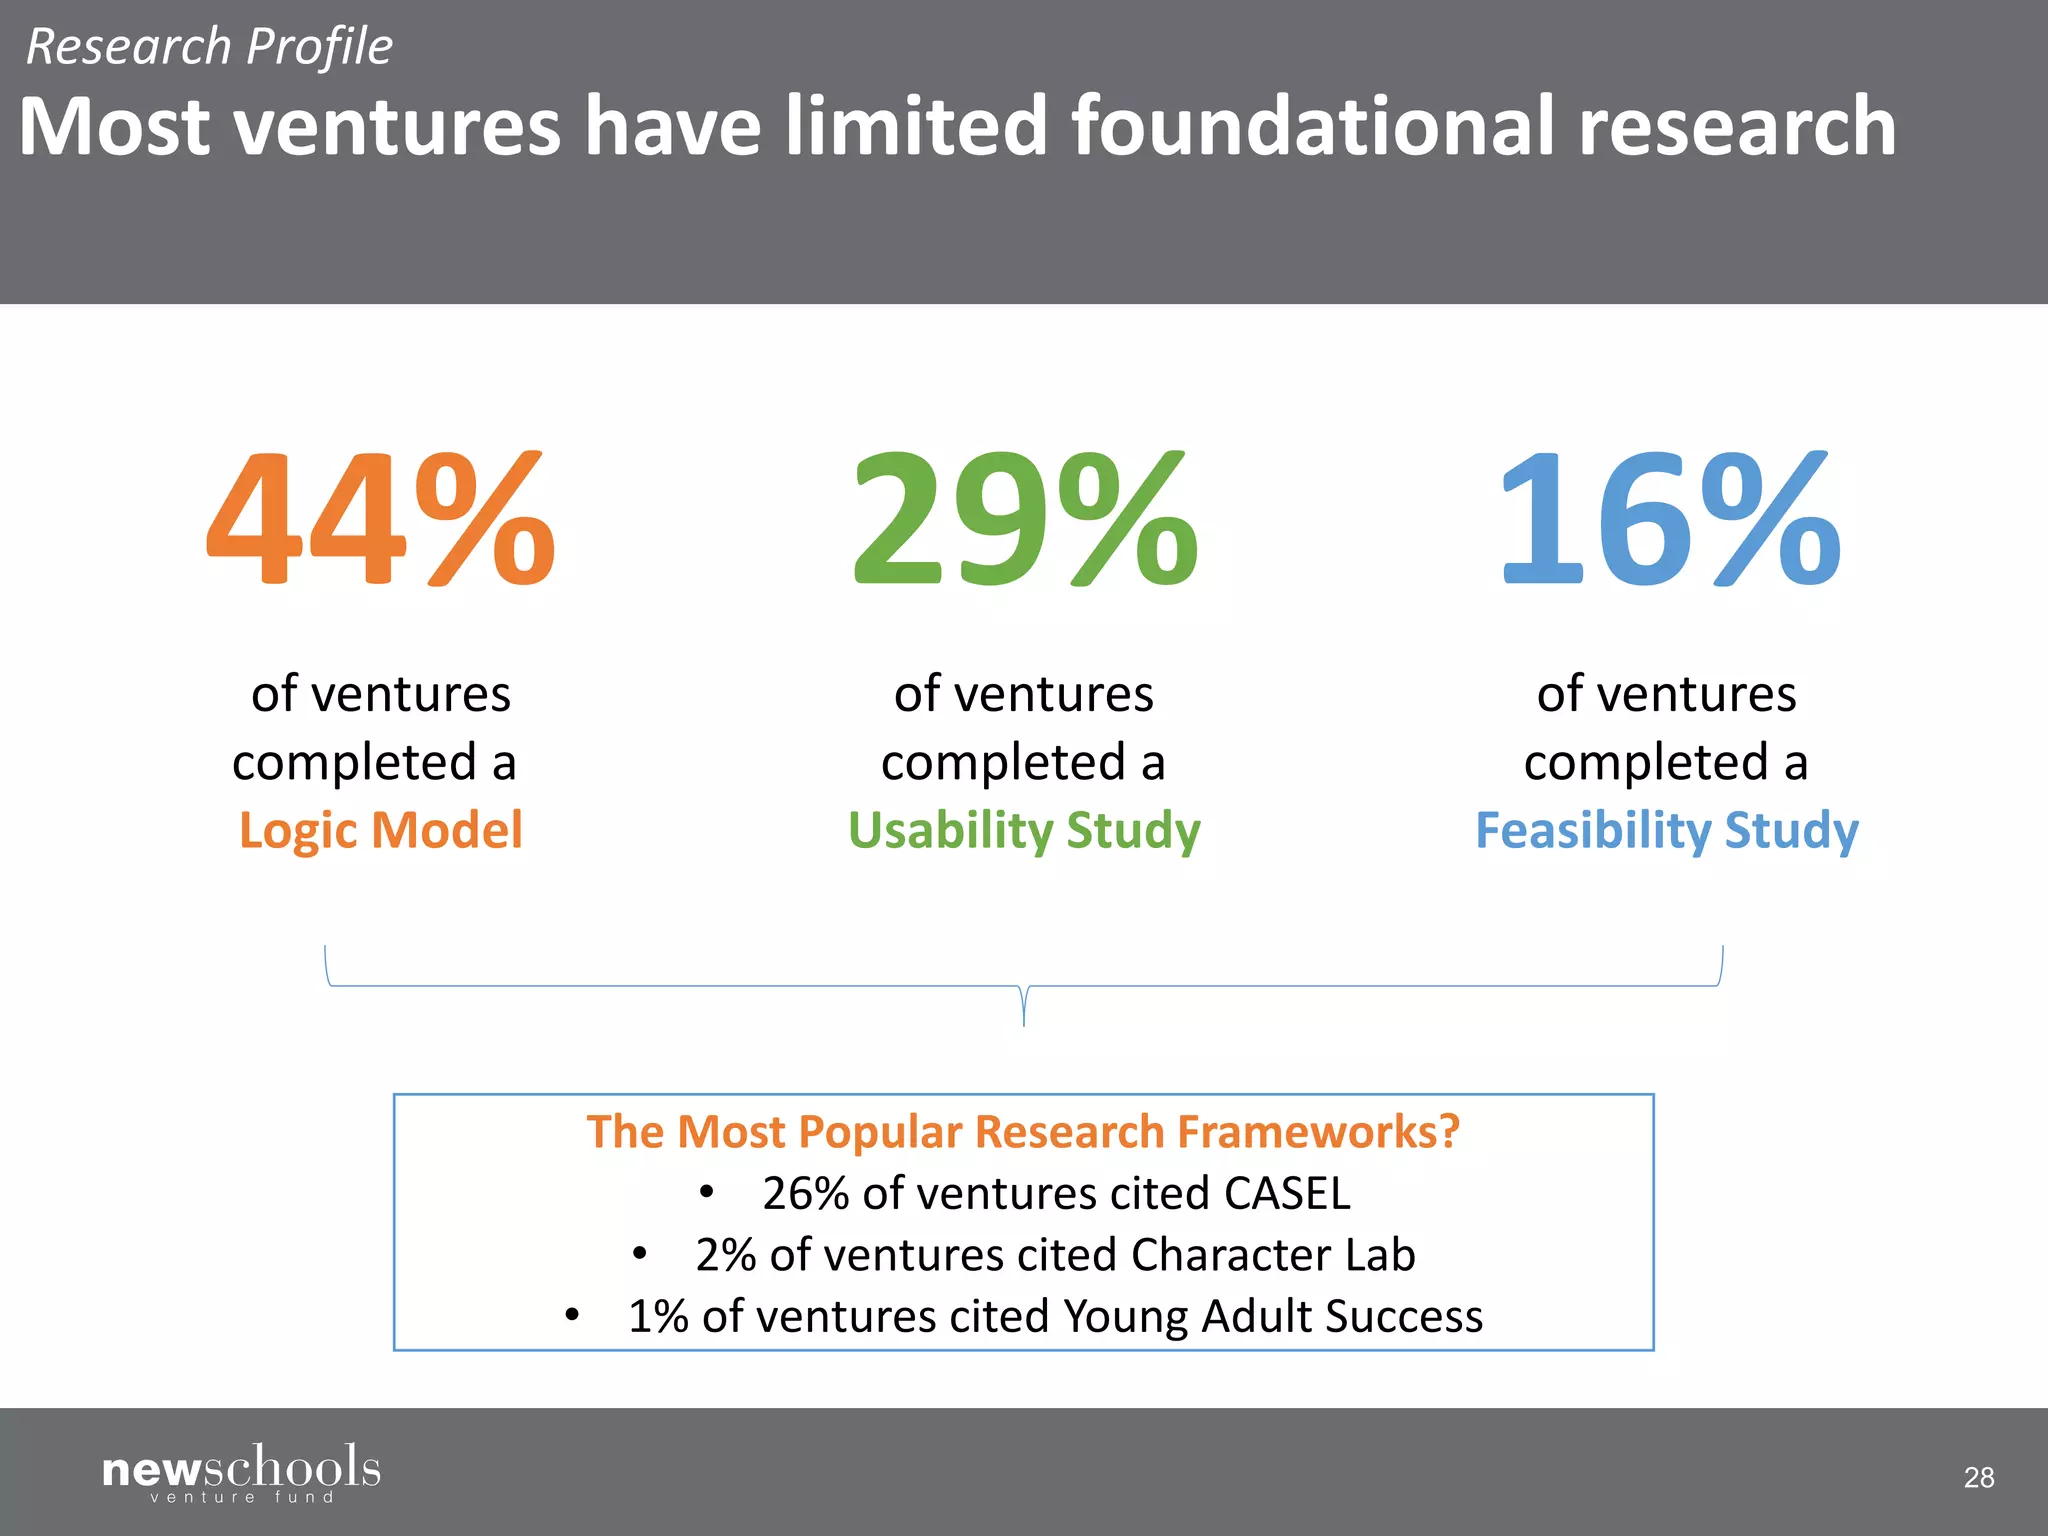

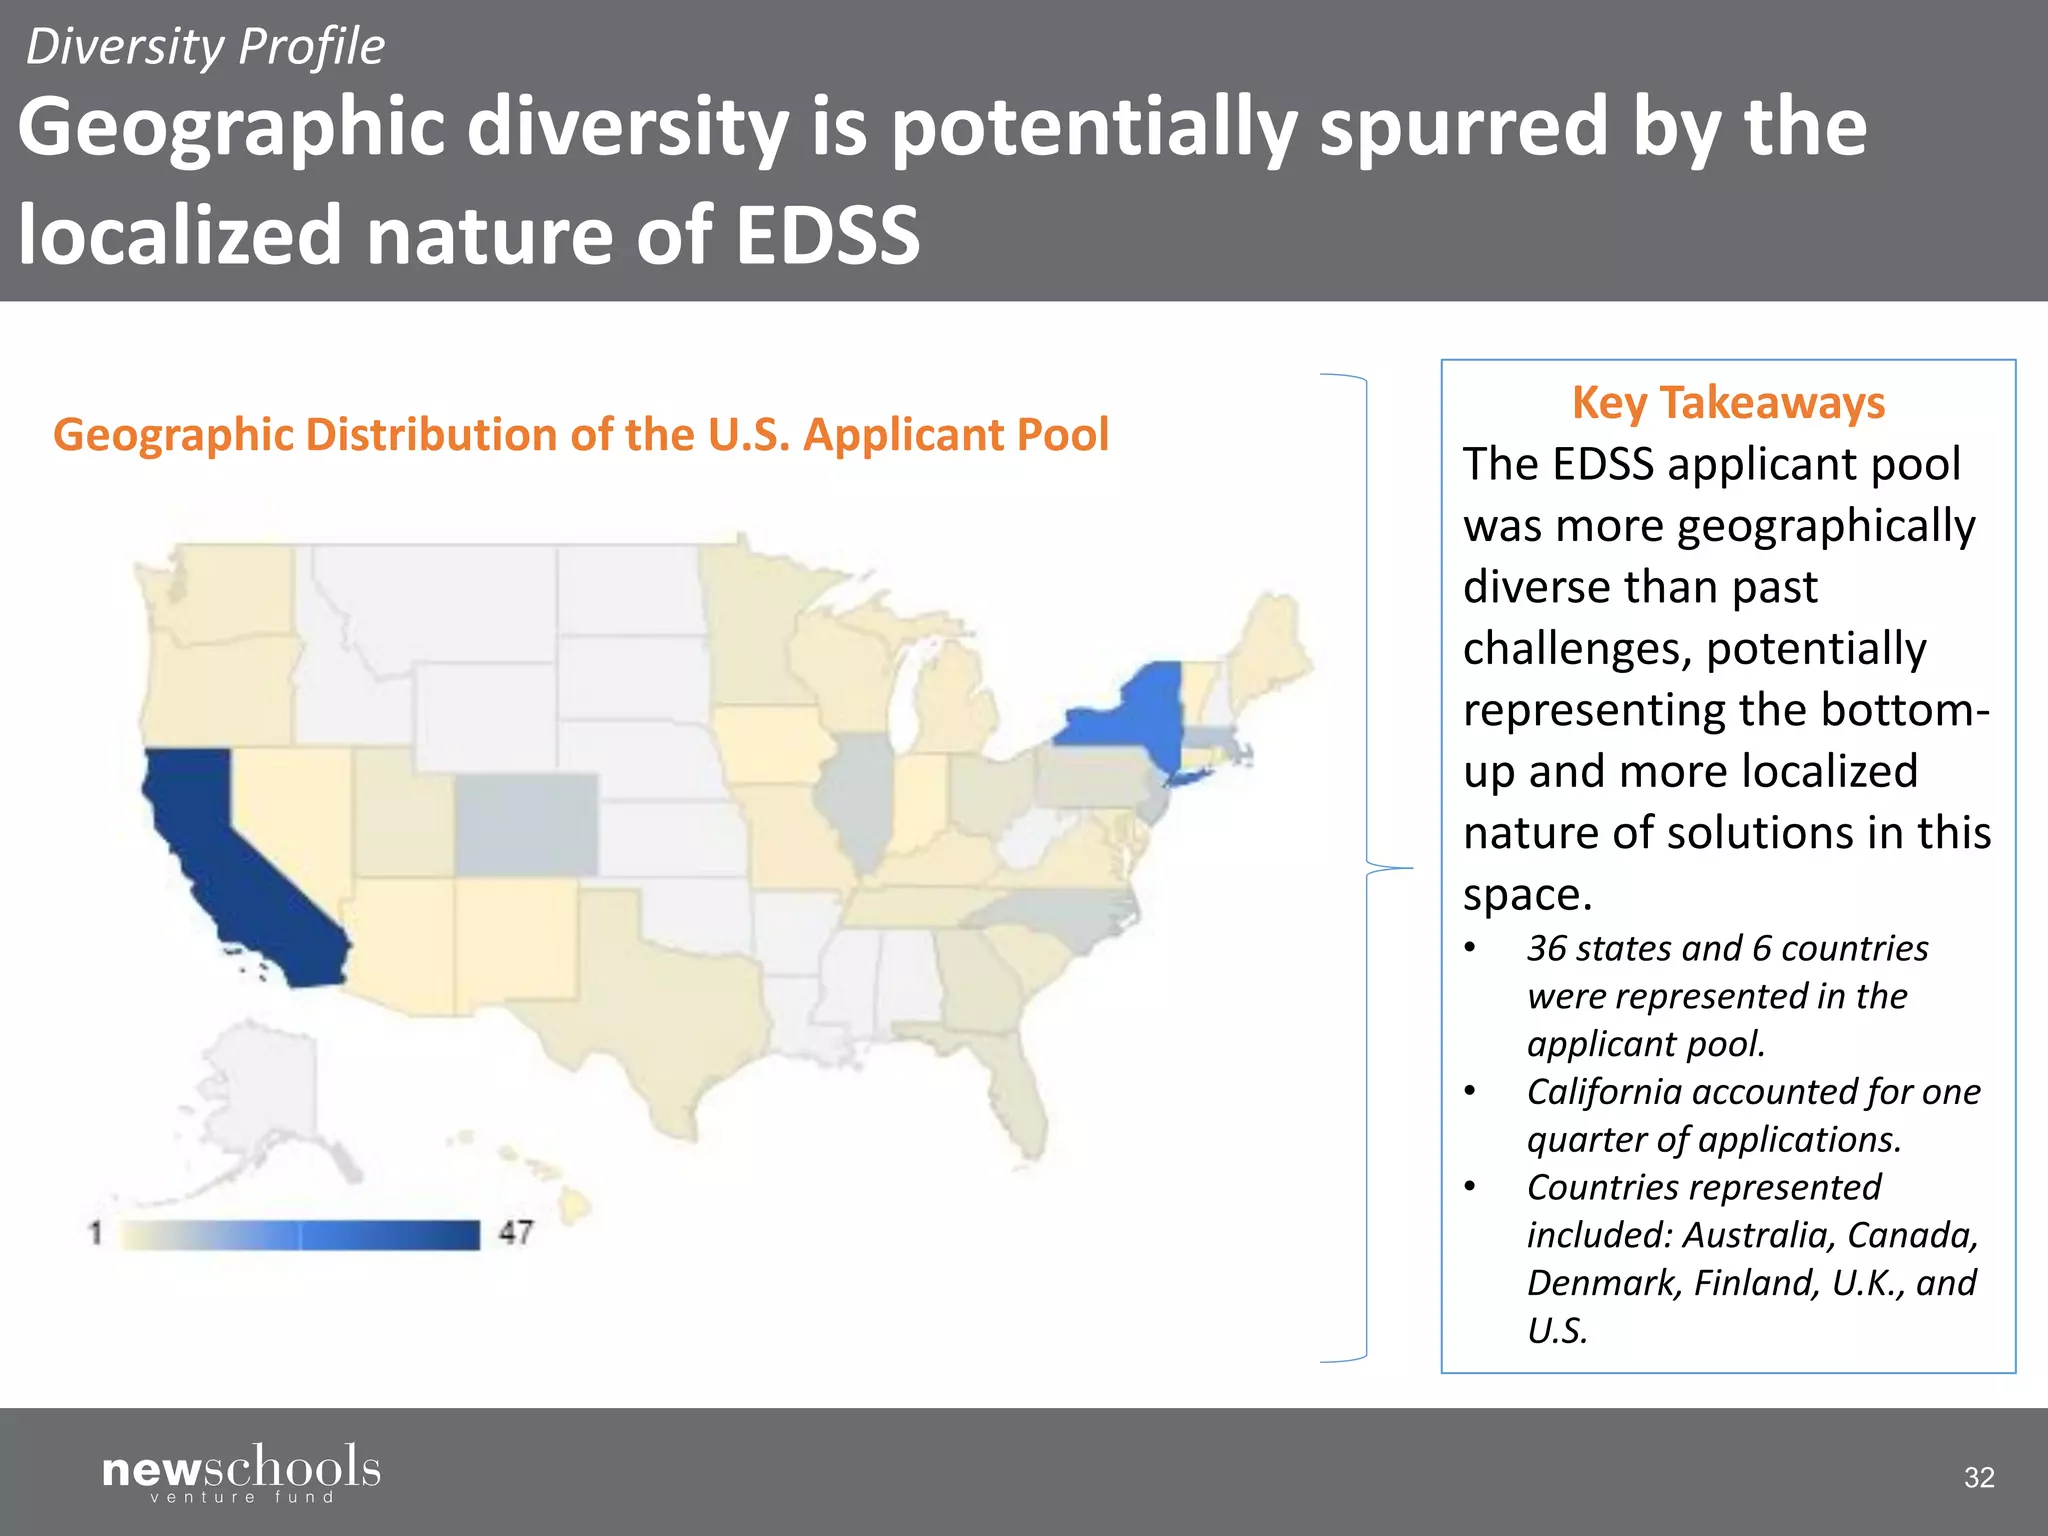


The document outlines the findings from the NewSchools Venture Fund's 2019 Expanded Definition of Student Success (EDSS) EdTech Challenge, which attracted a record 192 applicants. It highlights the trends and challenges in the educational technology sector, emphasizing a significant focus on social-emotional learning, the diverse makeup of applicants, and the limited foundational research among ventures. The analysis aims to inform educators, entrepreneurs, and funders about the evolving edtech landscape in relation to enhancing both academic and social-emotional learning outcomes.


