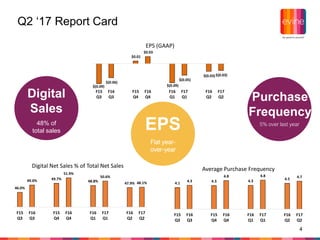
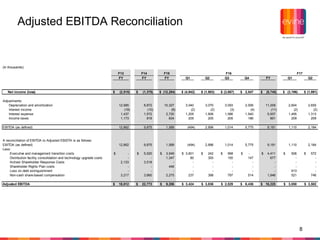
- Revenue and EPS results for the second quarter of 2017 were in line with expectations, positioning the company for growth in the second half of the fiscal year.
- The company recently reached agreements to launch its HD broadcast signal in over 10 million new homes over the next 6 months.
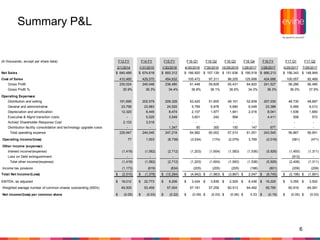
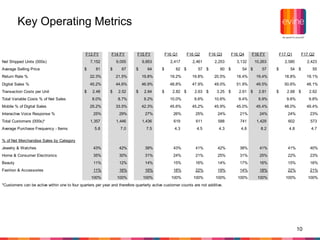
- Efforts to rebuild the Home category showed early success, with 9% revenue growth in that segment during the second quarter compared to the prior year.
- Investments in mobile and fulfillment capabilities helped drive a 5% increase in purchase frequency and mobile sales growing to 49.4% of digital sales, up from 47.9% last year.