Iron Mountain plans to convert to a REIT to enhance stockholder returns. As a REIT, it will be able to acquire leased facilities, broaden its investor base, and increase valuations. It expects to significantly increase its annual dividend for stockholders. The conversion is on track for 2014 and Iron Mountain will be able to execute its strategy within the REIT framework using its global real estate footprint.

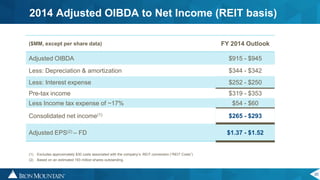
![17
(1) Adjusted to reflect planned conversion to a REIT in 2014
(2) Includes 0% - 2% internal revenue growth
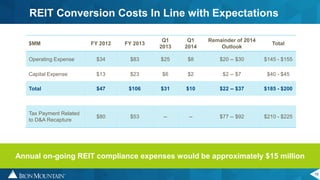
(3) Excludes approximately $6 million of charges related to the company’s organizational realignment and includes on-going REIT compliance costs of approximately $15 million
(4) Assumes 193 million shares outstanding
(5) Includes ~$6 million for the relocation of the Boston headquarters and $5 million of REIT conversion CapEx
(6) Includes ~$40MM associated with the expansion of our data center capacity
($MM)) Initial Guidance C$ Growth Adjusted Guidance(1) C$ Growth
Revenues $3,090 - $3,170 2% - 4%(2) $3,090 - $3,170 2% - 4%(2)
Adjusted OIBDA(3)
$930 - $960 2% - 5% $915- $945 0% - 3%
Adjusted EPS(3) – FD $1.03 - $1.14 $1.37 – $1.52(4)
Investments:
Capex (ex RE)(5)
~$245 ~$250
Real Estate(6)
~$90 ~$90
Free Cash Flow (ex: RE) $300 - $340 $350 - $390
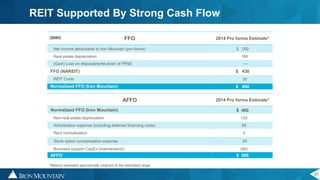
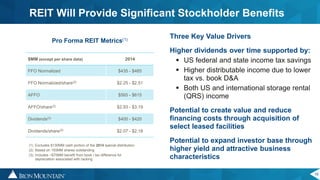
FFO [Normalized] $435 - $485
AFFO $565 - $615
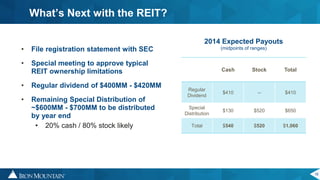
Dividends ~$207 $400 - $420
2014 – Adjustments to Guidance](https://image.slidesharecdn.com/favorableoutcomepresentation062514final-nonotes-140626045627-phpapp01/85/Favorable-Outcome-Presentation-06-25-14-final-17-320.jpg)