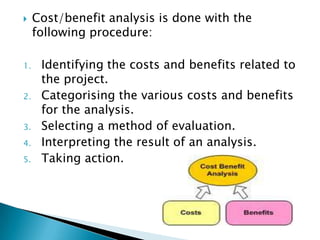
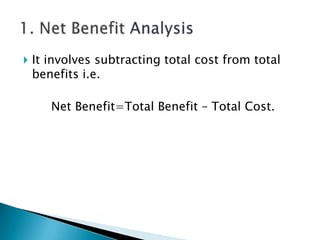
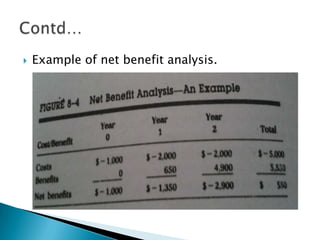
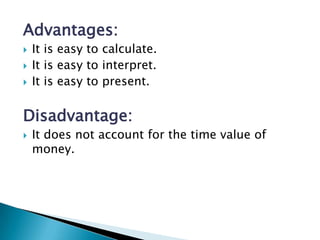
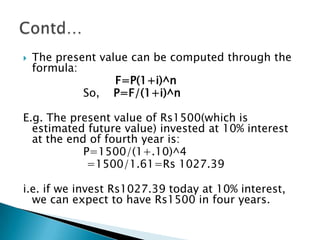
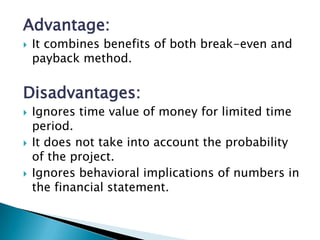
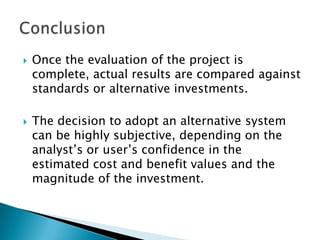
BY:-   Varnit Agarwal
       Navodit Thareja
       Pranav Mohindru
       Abhay Rana
   Cost/benefit analysis gives a picture of the
    various costs,benefits and rules associated
    with each alternative system.

 Costs and benefits are classified as:
1. Tangible & Intangible costs and benefits
2. Direct & Indirect costs and benefits
3. Fixed & variable costs and benefits
    Cost/benefit analysis is done with the
     following procedure:

1.    Identifying the costs and benefits related to
      the project.
2.    Categorising the various costs and benefits
      for the analysis.
3.    Selecting a method of evaluation.
4.    Interpreting the result of an analysis.
5.    Taking action.
   When all the financial data have been
    identified, the analyst has to select a method
    of evaluation.

   Based on that evaluation,the result has been
    interpreted. On the basis of the interpreted
    result, an action has been taken for the
    alternative system of an organisation.
1.   Net Benefit Analysis
2.   Present Value Analysis
3.   Net Present Value
4.   Payback Analysis
5.   Break-even Analysis
6.   Cash-flow Analysis
 It involves subtracting total cost from total
 benefits i.e.

     Net Benefit=Total Benefit – Total Cost.
   Example of net benefit analysis.
Advantages:
   It is easy to calculate.
   It is easy to interpret.
   It is easy to present.

Disadvantage:
   It does not account for the time value of
    money.
   Present Value analysis is used for long-term
    projects where it is difficult to compare
    today’s cost with the benefits of tomorrow.

   In this method cost and benefits are
    calculated in terms of today’s value of
    investment.

   The present value analysis determines how
    much money is invested now in order to
    receive a given return in some year’s time.
   The present value can be computed through the
    formula:
                   F=P(1+i)^n
             So, P=F/(1+i)^n

E.g. The present value of Rs1500(which is
  estimated future value) invested at 10% interest
  at the end of fourth year is:
            P=1500/(1+.10)^4
             =1500/1.61=Rs 1027.39

i.e. if we invest Rs1027.39 today at 10% interest,
  we can expect to have Rs1500 in four years.
Year         Estimated     Present      Cumulative
             future vale   value        present
                                        value of
                                        benefits
1            Rs 1500       Rs 1363.63   Rs 1363.63
2            Rs 1500       Rs 1239.67   Rs 2603.30
3            Rs 1500       Rs 1127.82   Rs 3731.12
4            Rs 1500       Rs 1027.39   Rs 4758.51

It shows that present value of a stream of estimated
future values of Rs. 1500 each for the next 4 years
after discounting for 10% is Rs. 4758.51
Advantages:
   It is easy to calculate.
   It equates different investment opportunities
    with various costs and benefits and discount
    rates.
   It accounts for time value of money.

Disadvantage:
   It is only a relative(not absolute) measure of a
    project’s return on investment.
   The present value analysis when carried out
    for the net benefits is called NET PRESENT
    VALUE(NPV).

   Its equal to benefits minus costs. It is
    expressed as percentage of the investment.

   NET PRESENT VALUE(%)=BENEFITS-COSTS
Example:
Suppose a company invested Rs 3000 for a
 microcomputer that yields a cumulative
 benefit of Rs 4758.51. So, net present
 value(gain) of Rs 1758.51.

The net present value is expressed as a
 percentage of the investment. Therefore,
          1758.51/3000=0.55=55%
Advantages:
   It is relatively easy to calculate.
   It accounts for time value of money.

Disadvantage:
   It is only a relative(not absolute) measure of a
    project’s return on investment.
   When a project is started, costs are incurred
    while the benefits take time to start.

   Payback analysis is to determine how long it
    will take for a project when the accumulated
    benefits equal the benefits used.

   Payback analysis defines the period required
    to recover the money spent on a project. This
    period is called the payback period. The
    shorter the period ,the faster the benefits.
   The table below shows the example of
     Payback Analysis.
               Year1   Year2   Year3   Year4   Year5
Initial cost   10000
Operating              1000    1000    1000    1000
cost
Total cost     10000   1000    1000    1000    1000
Cumulative     10000   11000   12000   13000   14000
cost
Benefits       0       5000    5000    5000    5000
Cumulative     0       5000    10000   15000   20000
benefits
Advantage:
   It is easy to calculate.
   It has straightforward interpretation for
    choice between two or more alternatives for
    candidate system.

Disadvantages:
   It is conservative economic measure applied
    to one opportunity at a time.
   It does not compare profitability of multiple
    investment alternatives.
   It does not allow for time value of money.
   Break-even analysis is a technique which
    compares the costs of using present and
    candidate systems.

   It is based on categorizing production costs
    between those which are "variable" (costs that
    change when the production output changes)
    and those that are "fixed" (costs not directly
    related to the volume of production).
   Total variable and fixed costs are compared
    with sales revenue in order to determine the
    level of sales volume.

    Sales value or production at which the
    business makes neither a profit nor a loss is
    known as the "break- even point".
   It is a graphical representation of costs at
    various levels of activity shown on the same
    chart as the variation of income with the
    same variation in activity.

   The point at which neither profit nor loss is
    made is known as the "break-even point" and
    is represented on the chart below by the
    intersection of the two lines.
Advantage:
   It is easy to understand.

Disadvantage:
   It does not allow for time factor and
    depreciation value of money.
   Cash flow analysis deals with the timing and
    amount of cash inflows/outflows from a firm
    or an investment.

   Cash flow analysis keeps tracks of
    accumulated cost and revenues on regular
    basis.
   It is simply calculated by deducting the
    operating cost from revenues created from
    investment on a period-by-period basis and
    then calculates the accumulated cost.

   Cash flow =Revenue – operating Expenses
Accumulated Cash Flow=Cash Flow (month 1)
 + Cash Flow(month 2) +…+Cash Flow(month
 n).
Here the payback period is of 3 years.
Advantage:
   It combines benefits of both break-even and
    payback method.

Disadvantages:
   Ignores time value of money for limited time
    period.
   It does not take into account the probability
    of the project.
   Ignores behavioral implications of numbers in
    the financial statement.
   Once the evaluation of the project is
    complete, actual results are compared against
    standards or alternative investments.

   The decision to adopt an alternative system
    can be highly subjective, depending on the
    analyst’s or user’s confidence in the
    estimated cost and benefit values and the
    magnitude of the investment.
1. Net Benefit Analysis is calculated through
(a) Total cost –Total benefit
(b) Total benefit – Total cost
(c) Total cost + Total benefit


2.    What is “break-even” point?
(a)   Profit with loss.
(b)   No profit but loss
(c)   Profit but no loss
(d)   Neither profit nor loss
3.    What is the formula for calculating future
      value of a project?
(a)   F=P(1+i)^n
(b)   F=P/(1+i)^n
(c)   F=P^n/(1+i)
(d)   None of the above.

4.    Tangible cost can be
(a)   Measured
(b)   Identified
(c)   All of above
5.    “Cost of breakdown of an online system
      during banking hours will cost the bank to
      lose deposit” is an example of
(a)   Tangible cost
(b)   Indirect cost
(c)   Variable cost
(d)   Intangible cost
Thank You !!!

Evaluation

  • 1.
    BY:- Varnit Agarwal Navodit Thareja Pranav Mohindru Abhay Rana
  • 2.
    Cost/benefit analysis gives a picture of the various costs,benefits and rules associated with each alternative system.  Costs and benefits are classified as: 1. Tangible & Intangible costs and benefits 2. Direct & Indirect costs and benefits 3. Fixed & variable costs and benefits
  • 3.
    Cost/benefit analysis is done with the following procedure: 1. Identifying the costs and benefits related to the project. 2. Categorising the various costs and benefits for the analysis. 3. Selecting a method of evaluation. 4. Interpreting the result of an analysis. 5. Taking action.
  • 4.
    When all the financial data have been identified, the analyst has to select a method of evaluation.  Based on that evaluation,the result has been interpreted. On the basis of the interpreted result, an action has been taken for the alternative system of an organisation.
  • 5.
    1. Net Benefit Analysis 2. Present Value Analysis 3. Net Present Value 4. Payback Analysis 5. Break-even Analysis 6. Cash-flow Analysis
  • 6.
     It involvessubtracting total cost from total benefits i.e. Net Benefit=Total Benefit – Total Cost.
  • 7.
    Example of net benefit analysis.
  • 8.
    Advantages:  It is easy to calculate.  It is easy to interpret.  It is easy to present. Disadvantage:  It does not account for the time value of money.
  • 9.
    Present Value analysis is used for long-term projects where it is difficult to compare today’s cost with the benefits of tomorrow.  In this method cost and benefits are calculated in terms of today’s value of investment.  The present value analysis determines how much money is invested now in order to receive a given return in some year’s time.
  • 10.
    The present value can be computed through the formula: F=P(1+i)^n So, P=F/(1+i)^n E.g. The present value of Rs1500(which is estimated future value) invested at 10% interest at the end of fourth year is: P=1500/(1+.10)^4 =1500/1.61=Rs 1027.39 i.e. if we invest Rs1027.39 today at 10% interest, we can expect to have Rs1500 in four years.
  • 11.
    Year Estimated Present Cumulative future vale value present value of benefits 1 Rs 1500 Rs 1363.63 Rs 1363.63 2 Rs 1500 Rs 1239.67 Rs 2603.30 3 Rs 1500 Rs 1127.82 Rs 3731.12 4 Rs 1500 Rs 1027.39 Rs 4758.51 It shows that present value of a stream of estimated future values of Rs. 1500 each for the next 4 years after discounting for 10% is Rs. 4758.51
  • 12.
    Advantages:  It is easy to calculate.  It equates different investment opportunities with various costs and benefits and discount rates.  It accounts for time value of money. Disadvantage:  It is only a relative(not absolute) measure of a project’s return on investment.
  • 13.
    The present value analysis when carried out for the net benefits is called NET PRESENT VALUE(NPV).  Its equal to benefits minus costs. It is expressed as percentage of the investment.  NET PRESENT VALUE(%)=BENEFITS-COSTS
  • 14.
    Example: Suppose a companyinvested Rs 3000 for a microcomputer that yields a cumulative benefit of Rs 4758.51. So, net present value(gain) of Rs 1758.51. The net present value is expressed as a percentage of the investment. Therefore, 1758.51/3000=0.55=55%
  • 15.
    Advantages:  It is relatively easy to calculate.  It accounts for time value of money. Disadvantage:  It is only a relative(not absolute) measure of a project’s return on investment.
  • 16.
    When a project is started, costs are incurred while the benefits take time to start.  Payback analysis is to determine how long it will take for a project when the accumulated benefits equal the benefits used.  Payback analysis defines the period required to recover the money spent on a project. This period is called the payback period. The shorter the period ,the faster the benefits.
  • 17.
    The table below shows the example of Payback Analysis. Year1 Year2 Year3 Year4 Year5 Initial cost 10000 Operating 1000 1000 1000 1000 cost Total cost 10000 1000 1000 1000 1000 Cumulative 10000 11000 12000 13000 14000 cost Benefits 0 5000 5000 5000 5000 Cumulative 0 5000 10000 15000 20000 benefits
  • 18.
    Advantage:  It is easy to calculate.  It has straightforward interpretation for choice between two or more alternatives for candidate system. Disadvantages:  It is conservative economic measure applied to one opportunity at a time.  It does not compare profitability of multiple investment alternatives.  It does not allow for time value of money.
  • 19.
    Break-even analysis is a technique which compares the costs of using present and candidate systems.  It is based on categorizing production costs between those which are "variable" (costs that change when the production output changes) and those that are "fixed" (costs not directly related to the volume of production).
  • 20.
    Total variable and fixed costs are compared with sales revenue in order to determine the level of sales volume.  Sales value or production at which the business makes neither a profit nor a loss is known as the "break- even point".
  • 21.
    It is a graphical representation of costs at various levels of activity shown on the same chart as the variation of income with the same variation in activity.  The point at which neither profit nor loss is made is known as the "break-even point" and is represented on the chart below by the intersection of the two lines.
  • 23.
    Advantage:  It is easy to understand. Disadvantage:  It does not allow for time factor and depreciation value of money.
  • 24.
    Cash flow analysis deals with the timing and amount of cash inflows/outflows from a firm or an investment.  Cash flow analysis keeps tracks of accumulated cost and revenues on regular basis.
  • 25.
    It is simply calculated by deducting the operating cost from revenues created from investment on a period-by-period basis and then calculates the accumulated cost. Cash flow =Revenue – operating Expenses Accumulated Cash Flow=Cash Flow (month 1) + Cash Flow(month 2) +…+Cash Flow(month n).
  • 26.
    Here the paybackperiod is of 3 years.
  • 27.
    Advantage:  It combines benefits of both break-even and payback method. Disadvantages:  Ignores time value of money for limited time period.  It does not take into account the probability of the project.  Ignores behavioral implications of numbers in the financial statement.
  • 28.
    Once the evaluation of the project is complete, actual results are compared against standards or alternative investments.  The decision to adopt an alternative system can be highly subjective, depending on the analyst’s or user’s confidence in the estimated cost and benefit values and the magnitude of the investment.
  • 29.
    1. Net BenefitAnalysis is calculated through (a) Total cost –Total benefit (b) Total benefit – Total cost (c) Total cost + Total benefit 2. What is “break-even” point? (a) Profit with loss. (b) No profit but loss (c) Profit but no loss (d) Neither profit nor loss
  • 30.
    3. What is the formula for calculating future value of a project? (a) F=P(1+i)^n (b) F=P/(1+i)^n (c) F=P^n/(1+i) (d) None of the above. 4. Tangible cost can be (a) Measured (b) Identified (c) All of above
  • 31.
    5. “Cost of breakdown of an online system during banking hours will cost the bank to lose deposit” is an example of (a) Tangible cost (b) Indirect cost (c) Variable cost (d) Intangible cost
  • 32.