Download to read offline


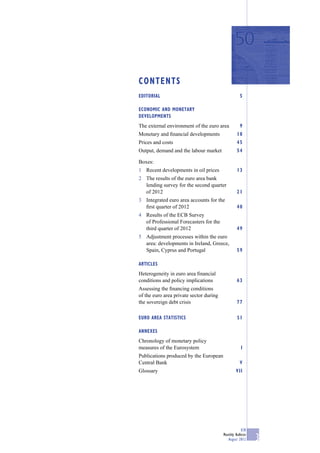
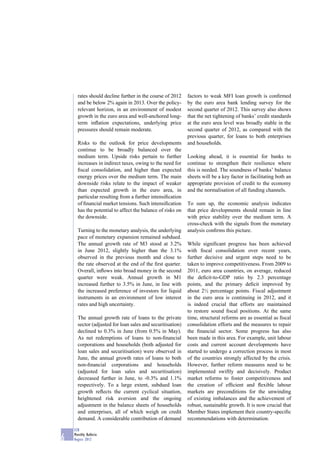

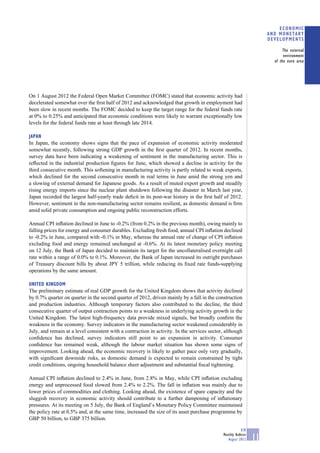
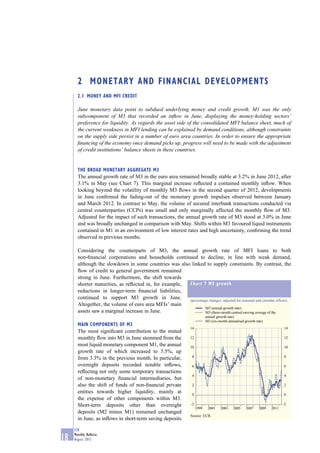
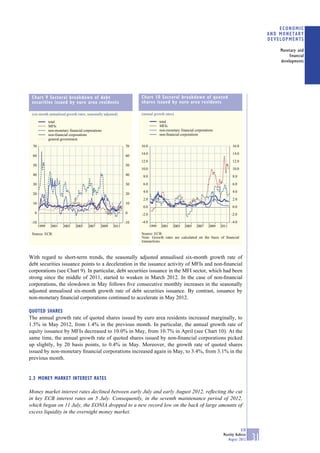
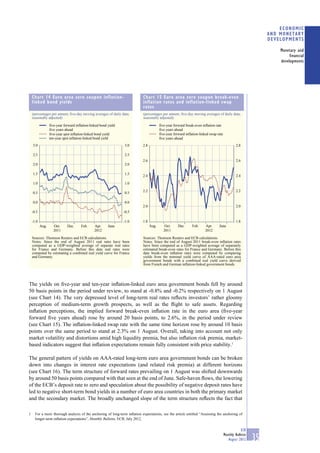
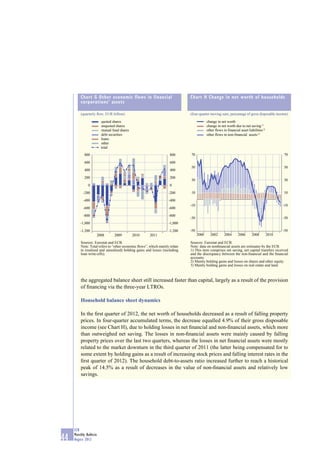
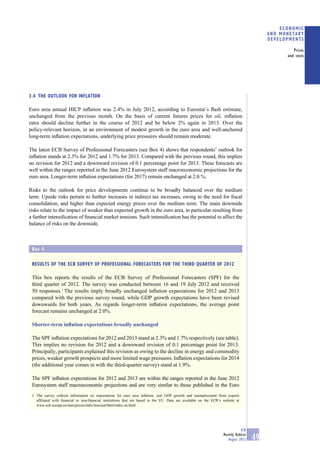
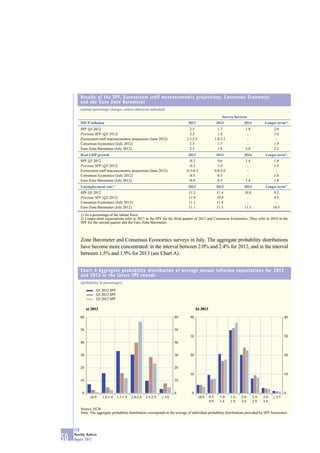
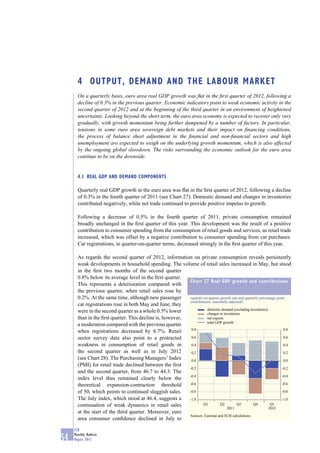
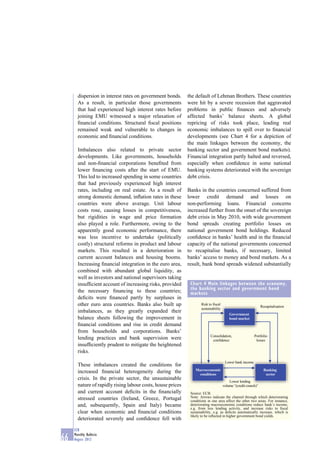
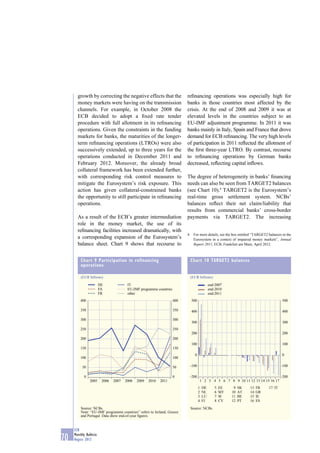
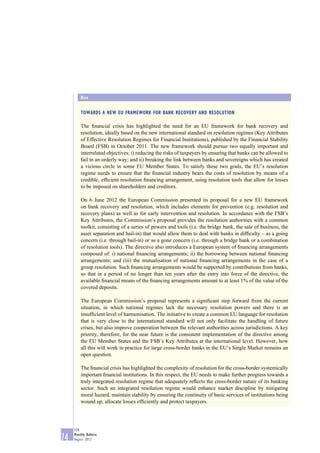

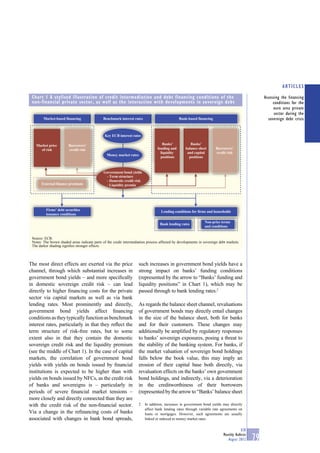
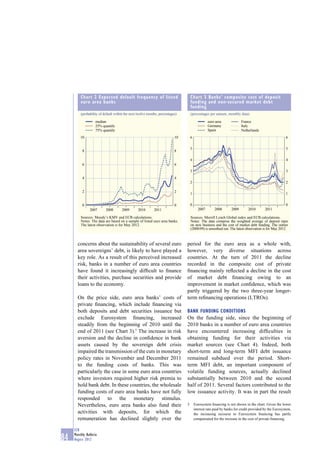
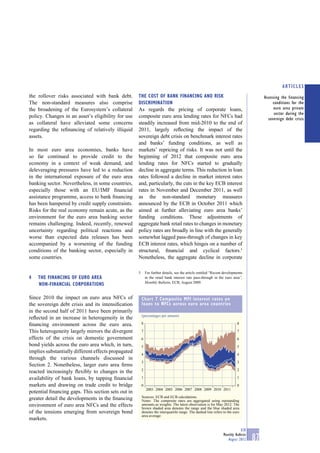
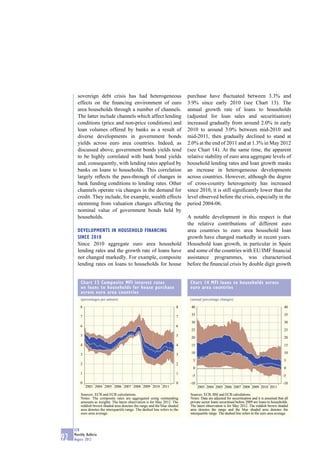


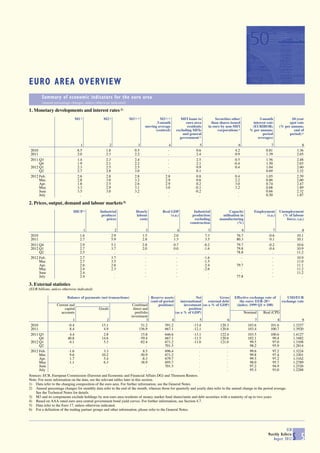
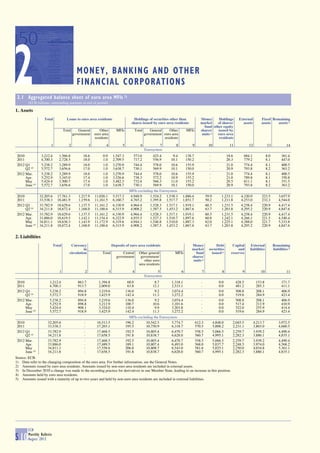
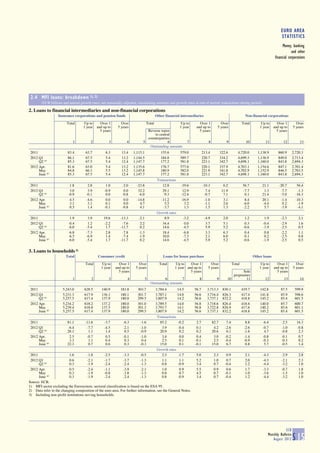
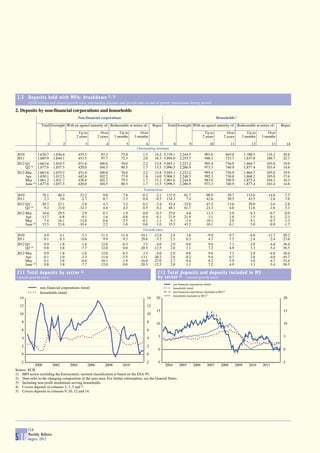
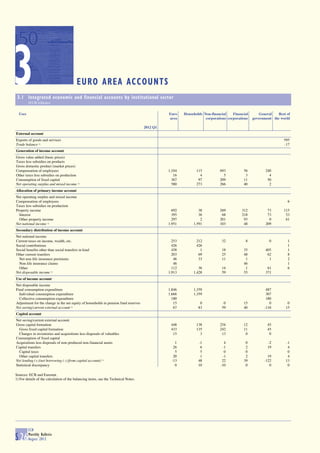
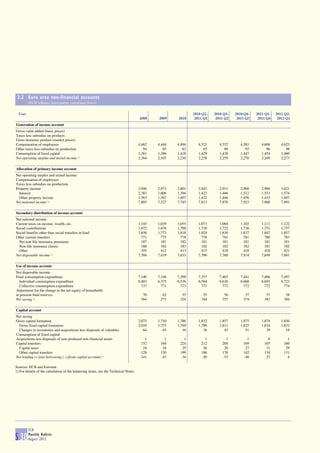
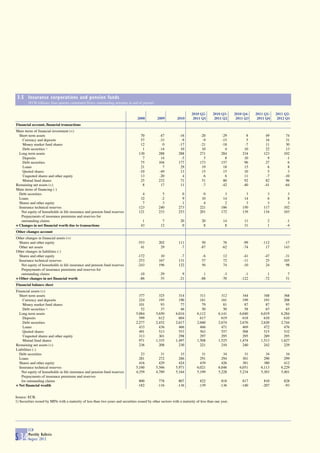
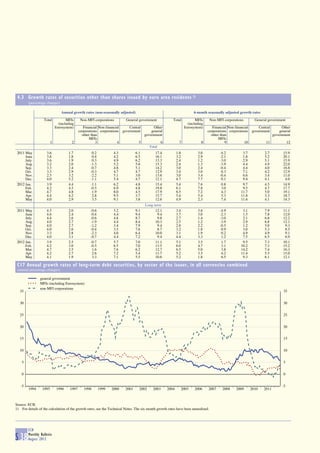
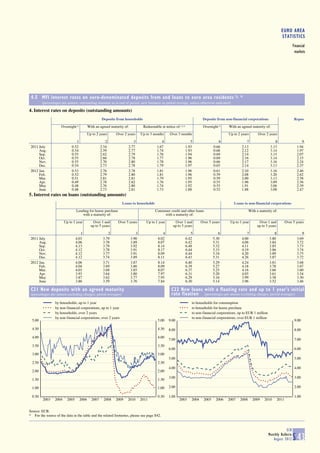
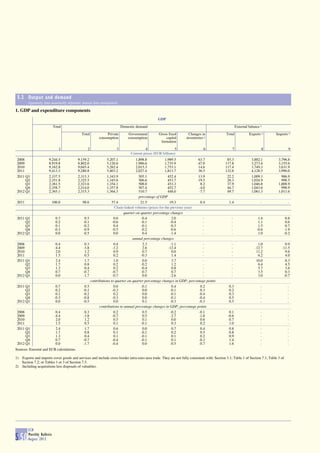
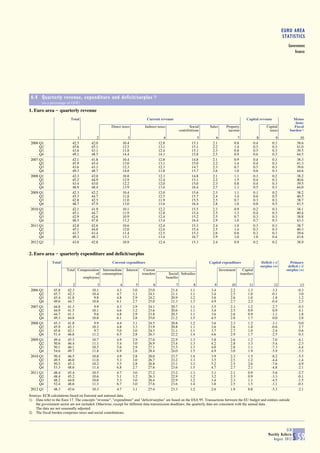
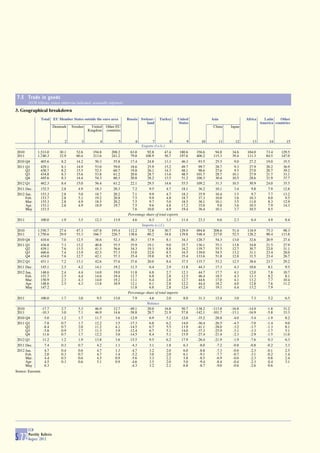
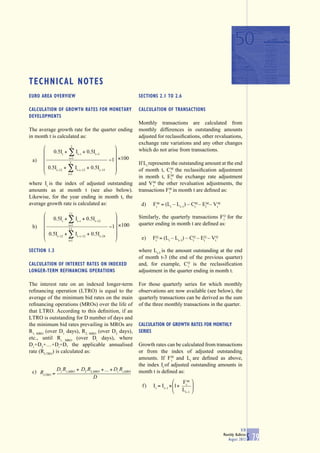
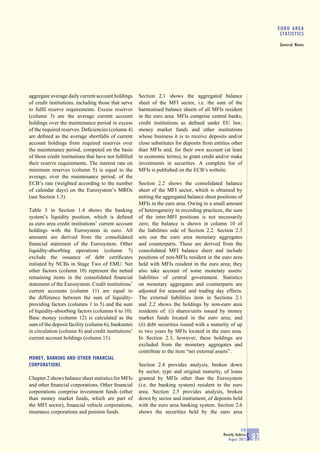
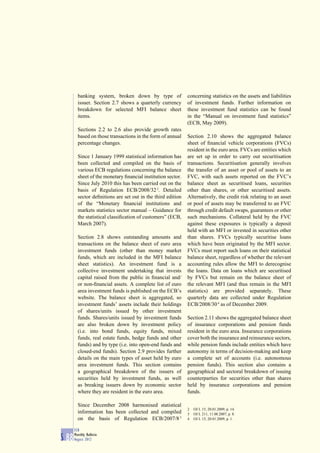
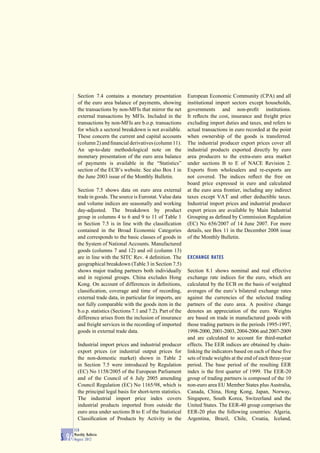
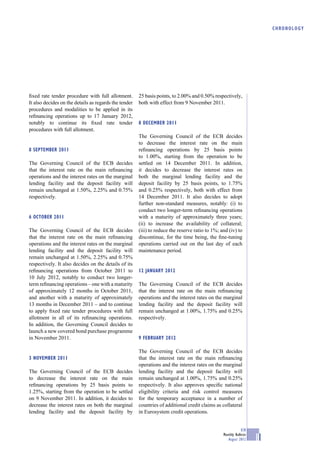
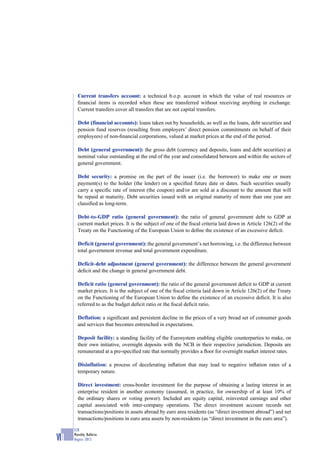
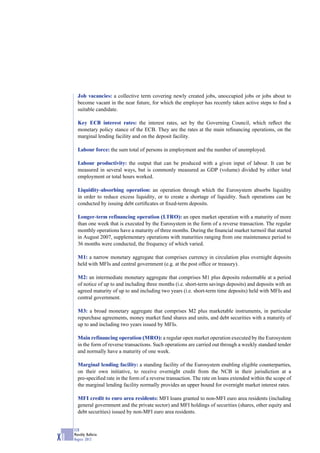
![6.3 Change in debt 1)
(as a percentage of GDP)
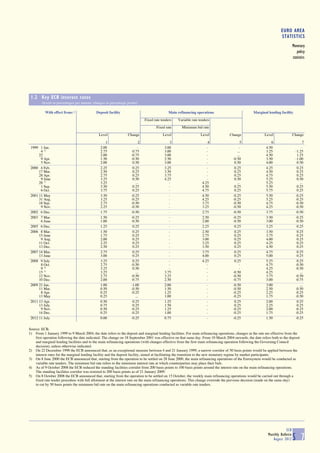
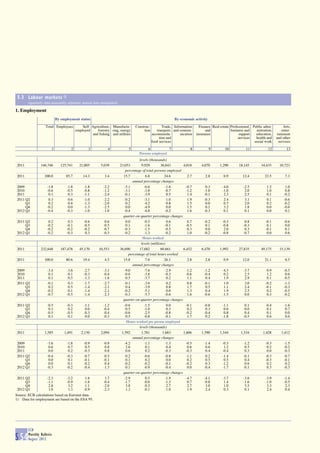
1. Euro area _ by source, financial instrument and sector of the holder
Total Source of change Financial instruments Holders
Borrowing Valuation Other Currency Loans Short-term Long-term Domestic Other
requirement 2) effects 3) changes and securities securities creditors 5) MFIs Other creditors 6)
in deposits financial
volume 4) corporations
1 2 3 4 5 6 7 8 9 10 11 12
2003 3.1 3.3 -0.2 0.0 -0.6 1.0 0.6 2.1 0.5 0.8 0.8 2.7
2004 3.2 3.3 -0.1 0.0 0.2 0.1 -0.1 2.9 0.2 -0.1 0.3 3.0
2005 3.3 3.1 0.2 0.0 0.3 0.5 -0.1 2.6 -0.4 -0.1 0.5 3.7
2006 1.6 1.5 0.1 0.0 0.2 0.2 -0.3 1.5 -0.3 1.1 -1.4 1.9
2007 1.2 1.2 0.0 0.0 -0.1 0.0 0.1 1.2 -0.5 -0.3 -0.3 1.6
2008 5.3 5.2 0.1 0.0 0.1 0.5 2.7 2.0 1.1 1.1 -0.6 4.2
2009 7.2 7.4 -0.2 0.0 0.1 0.7 1.6 4.9 3.0 2.3 0.9 4.3
2010 7.5 7.7 -0.1 0.0 0.0 3.0 -0.7 5.2 4.2 3.3 1.0 3.3
2011 4.2 4.0 0.2 0.0 0.0 0.5 0.2 3.5 3.2 1.0 1.0 1.1
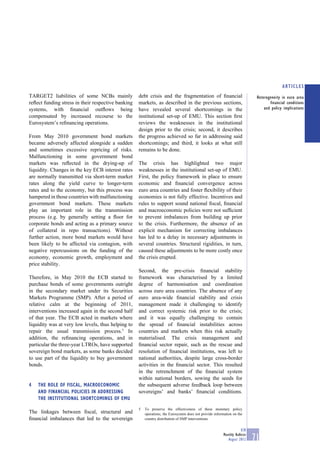
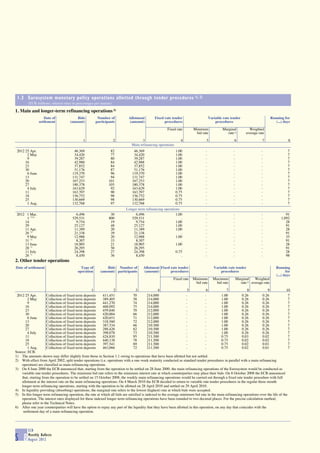
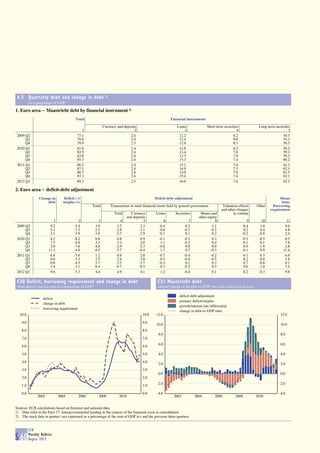
2. Euro area _ deficit-debt adjustment
Change in Deficit (-) / Deficit-debt adjustment 8)
debt surplus (+) 7)
Total Transactions in main financial assets held by general government Valuation Other Other 9)
effects Exchange changes in
Total Currency Loans Securities 10) Shares and rate volume
and other Privatisations Equity effects
deposits equity injections
1 2 3 4 5 6 7 8 9 10 11 12 13 14
2003 3.1 -3.2 0.0 0.1 0.1 0.0 0.0 0.1 -0.2 0.1 -0.2 -0.1 0.0 0.1
2004 3.2 -2.9 0.3 0.2 0.2 0.0 0.1 0.0 -0.5 0.2 -0.1 0.0 0.0 0.1
2005 3.3 -2.6 0.8 0.6 0.3 0.0 0.1 0.1 -0.3 0.2 0.2 0.0 0.0 0.0
2006 1.6 -1.4 0.2 0.2 0.3 -0.1 0.2 -0.2 -0.4 0.1 0.1 0.0 0.0 -0.1
2007 1.2 -0.7 0.5 0.6 0.2 0.0 0.2 0.1 -0.3 0.2 0.0 0.0 0.0 -0.1
2008 5.3 -2.1 3.2 3.0 0.8 0.7 0.7 0.9 -0.1 0.7 0.1 0.0 0.0 0.0
2009 7.2 -6.4 0.9 1.0 0.3 0.0 0.3 0.4 -0.3 0.5 -0.2 0.0 0.0 0.1
2010 7.5 -6.2 1.3 1.8 0.0 0.5 1.1 0.1 0.0 0.1 -0.1 0.0 0.0 -0.3
2011 4.2 -4.1 0.1 -0.3 0.2 -0.2 -0.2 0.0 -0.1 0.2 0.2 0.0 0.0 0.2
Source: ECB.
1) Data refer to the Euro 17 and are partially estimated. Annual change in gross nominal consolidated debt is expressed as a percentage of GDP, i.e. [debt(t) - debt(t-1)] ÷ GDP(t).
Intergovernmental lending in the context of the financial crisis is consolidated.
2) The borrowing requirement is by definition equal to transactions in debt.
3) Includes, in addition to the impact of foreign exchange movements, effects arising from measurement at nominal value (e.g. premia or discounts on securities issued).
4) Includes, in particular, the impact of the reclassification of units and certain types of debt assumption.
5) Holders resident in the country whose government has issued the debt.
6) Includes residents of euro area countries other than the country whose government has issued the debt.
7) Including proceeds from sales of UMTS licences.
8) The difference between the annual change in gross nominal consolidated debt and the deficit as a percentage of GDP.
9) Mainly composed of transactions in other assets and liabilities (trade credits, other receivables/payables and financial derivatives).
10) Excluding financial derivatives.
ECB
Monthly Bulletin
S 58 August 2012](https://image.slidesharecdn.com/bceboletinagosto2012-120810165621-phpapp02/85/BCE-Boletin-agosto-2012-155-320.jpg)


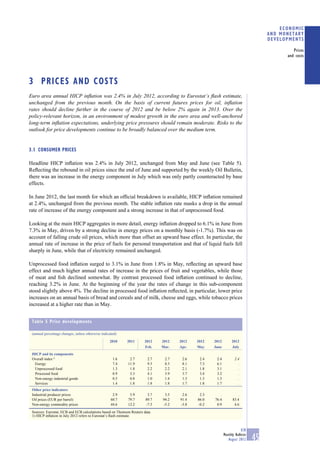
Global economic growth remains gradual and uneven, with weakness persisting in Europe. Surveys show growth momentum continued to slow in early Q3 2012. Inflation has eased in recent months in advanced economies due to falling commodity prices. Overall, the recovery in the global economy continues but faces fragilities, particularly in Europe.


![q2_2010_en[1].pdf](https://cdn.slidesharecdn.com/ss_thumbnails/q2-2010-en-5b1-5d-120322141401-phpapp02-thumbnail.jpg?width=640&height=640&fit=bounds)


