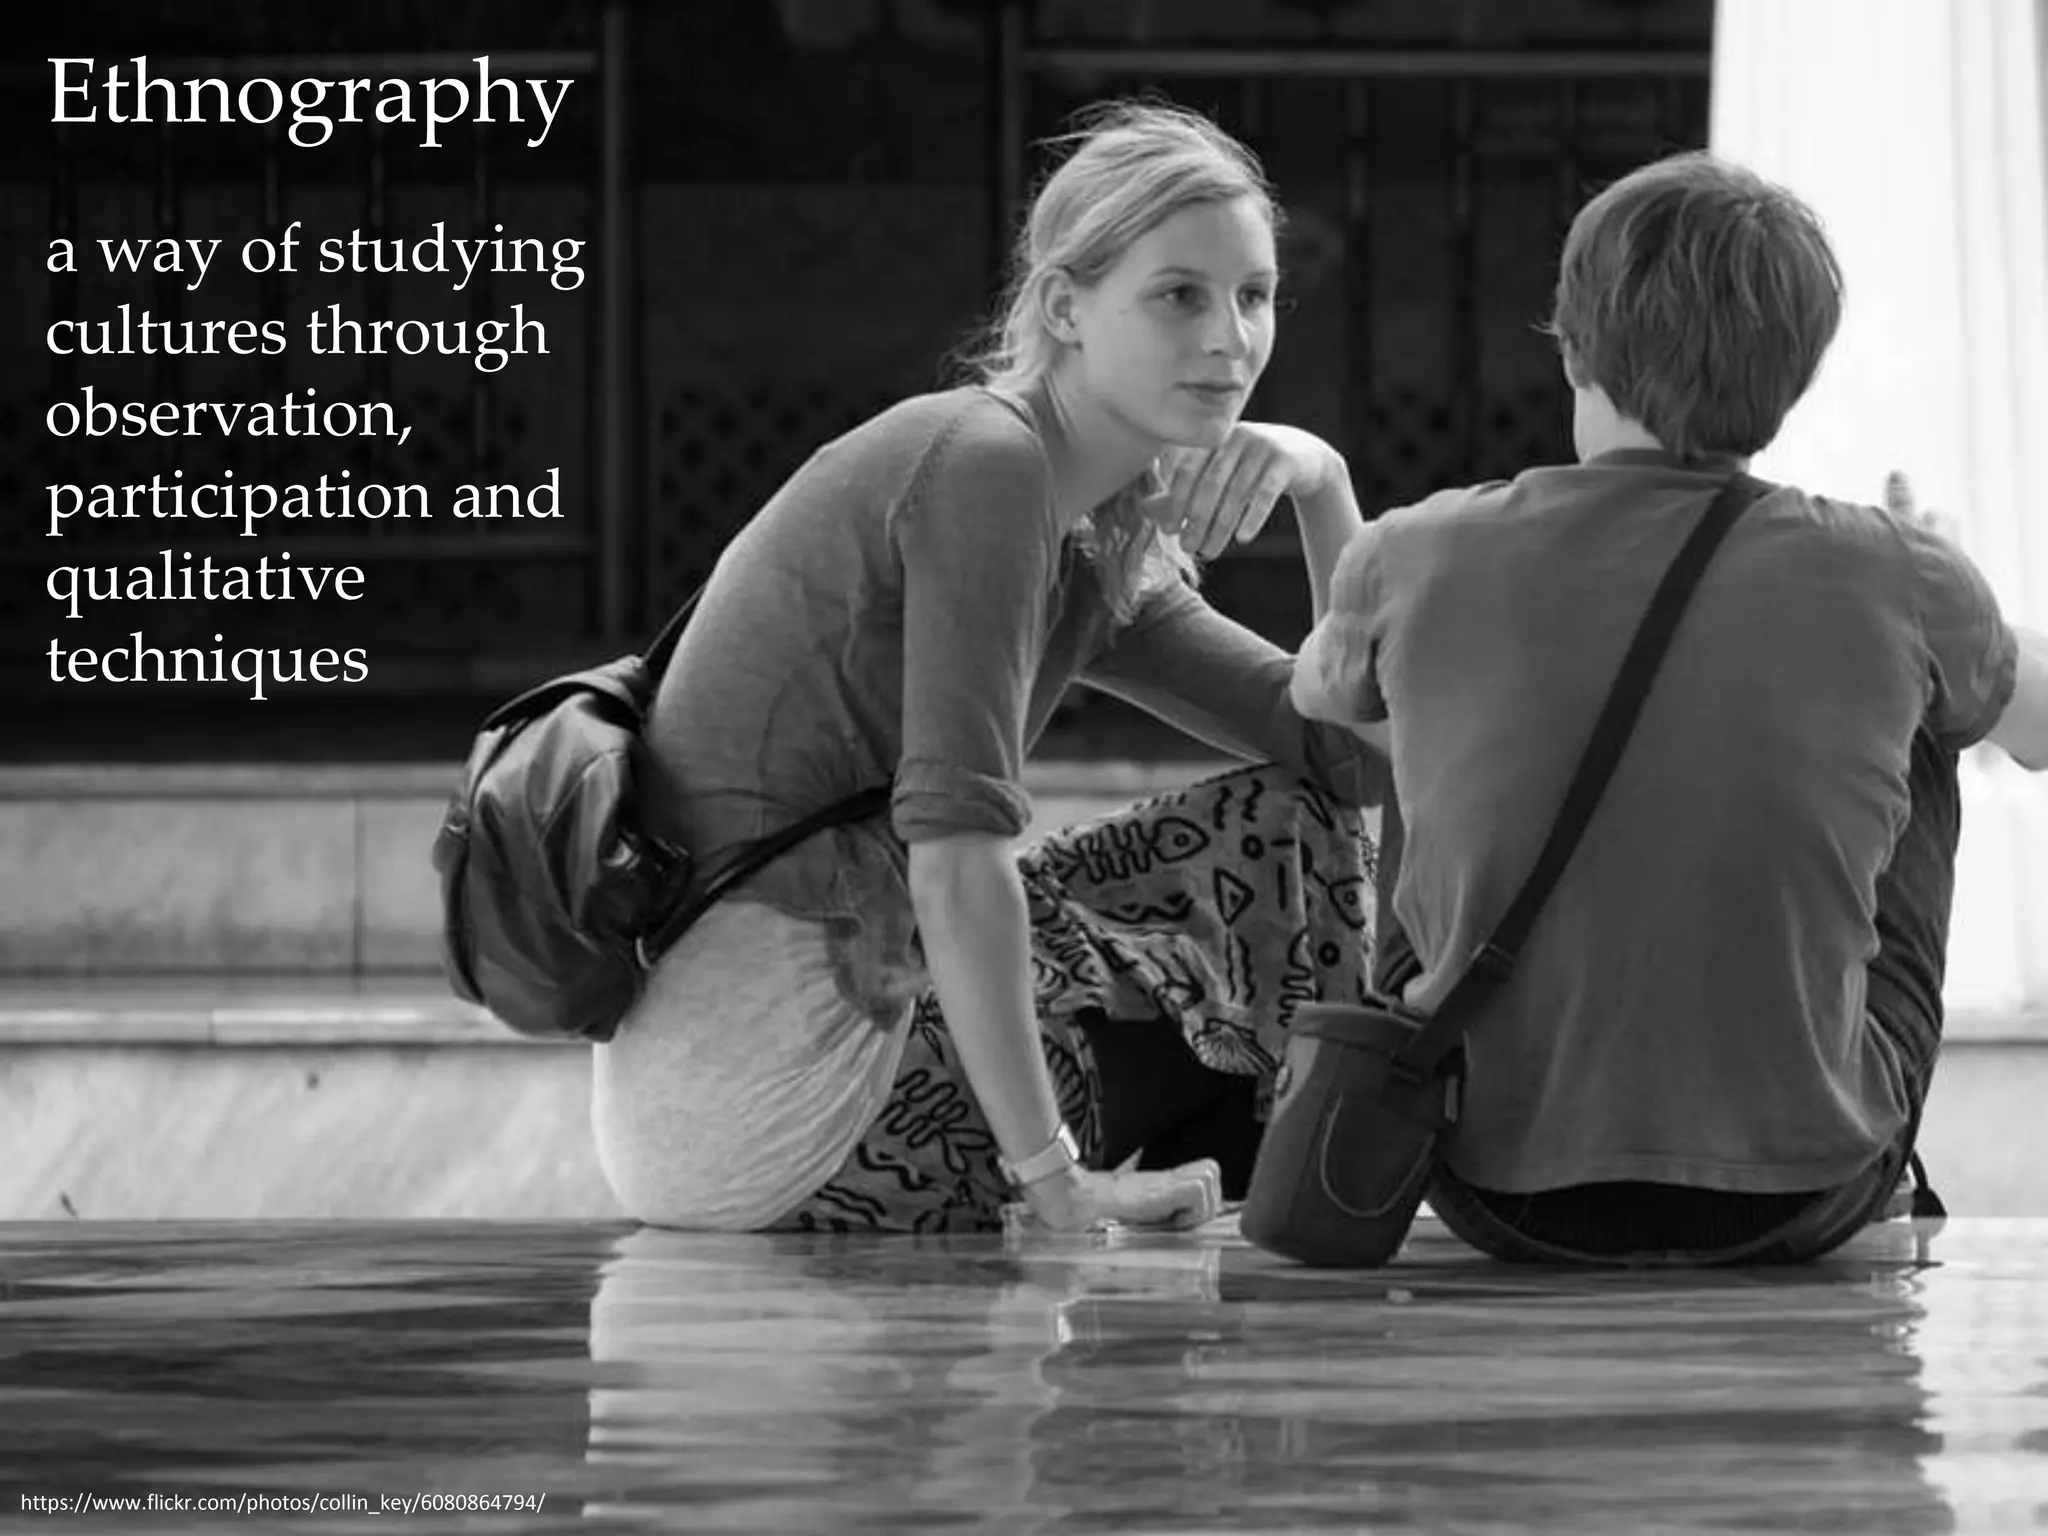
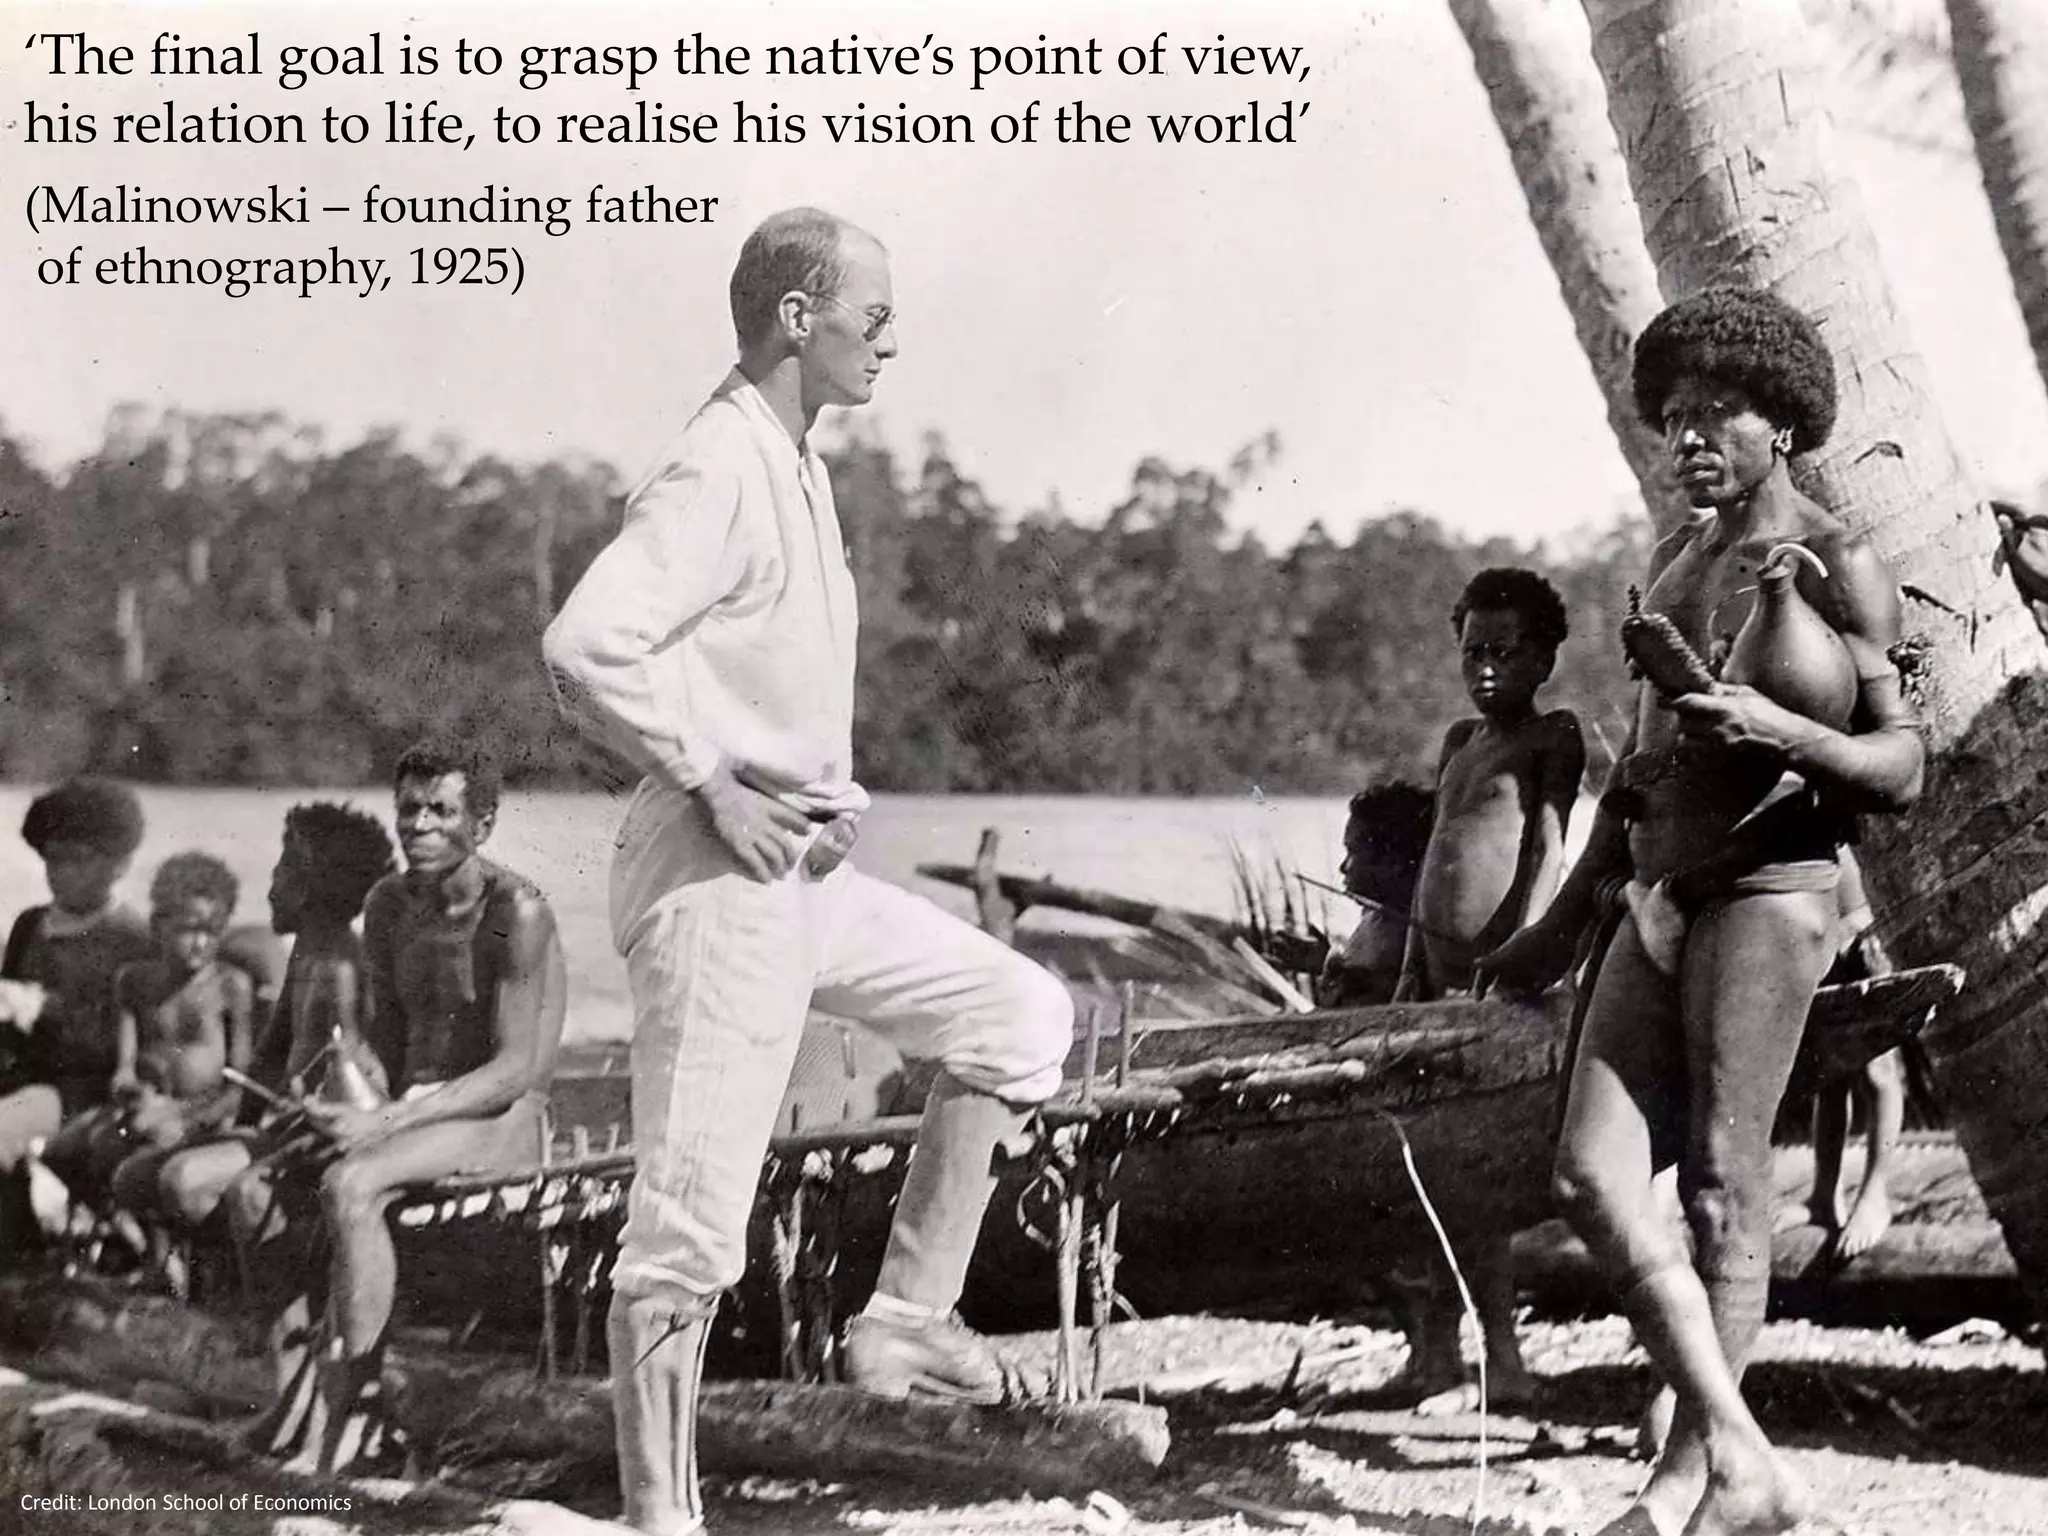
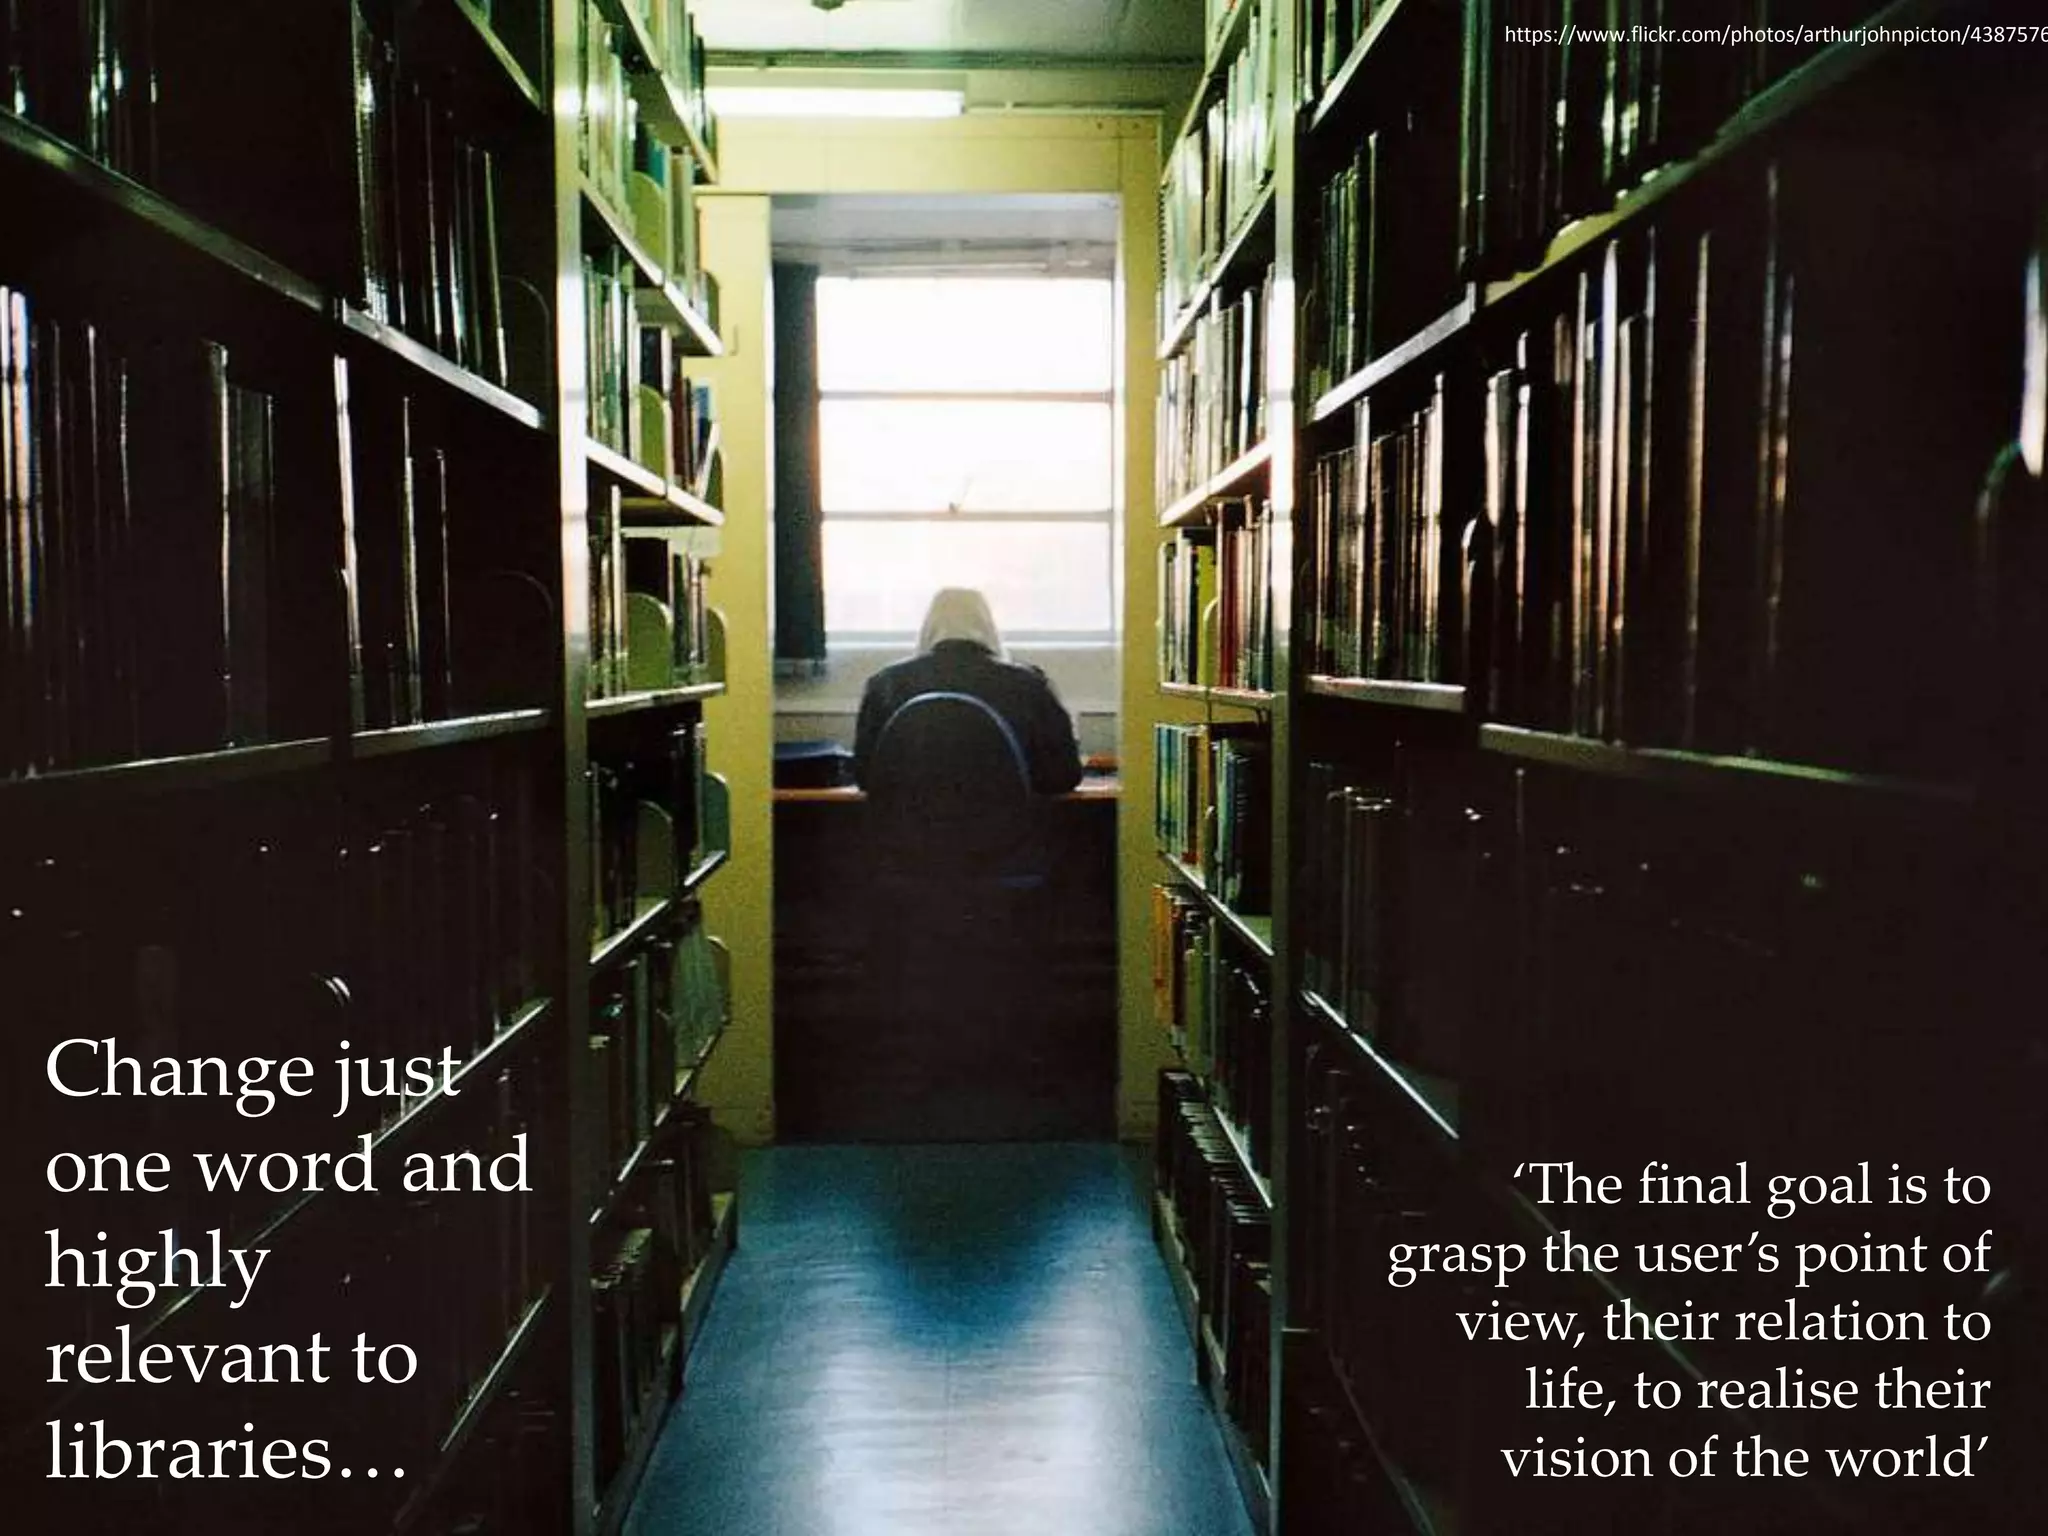
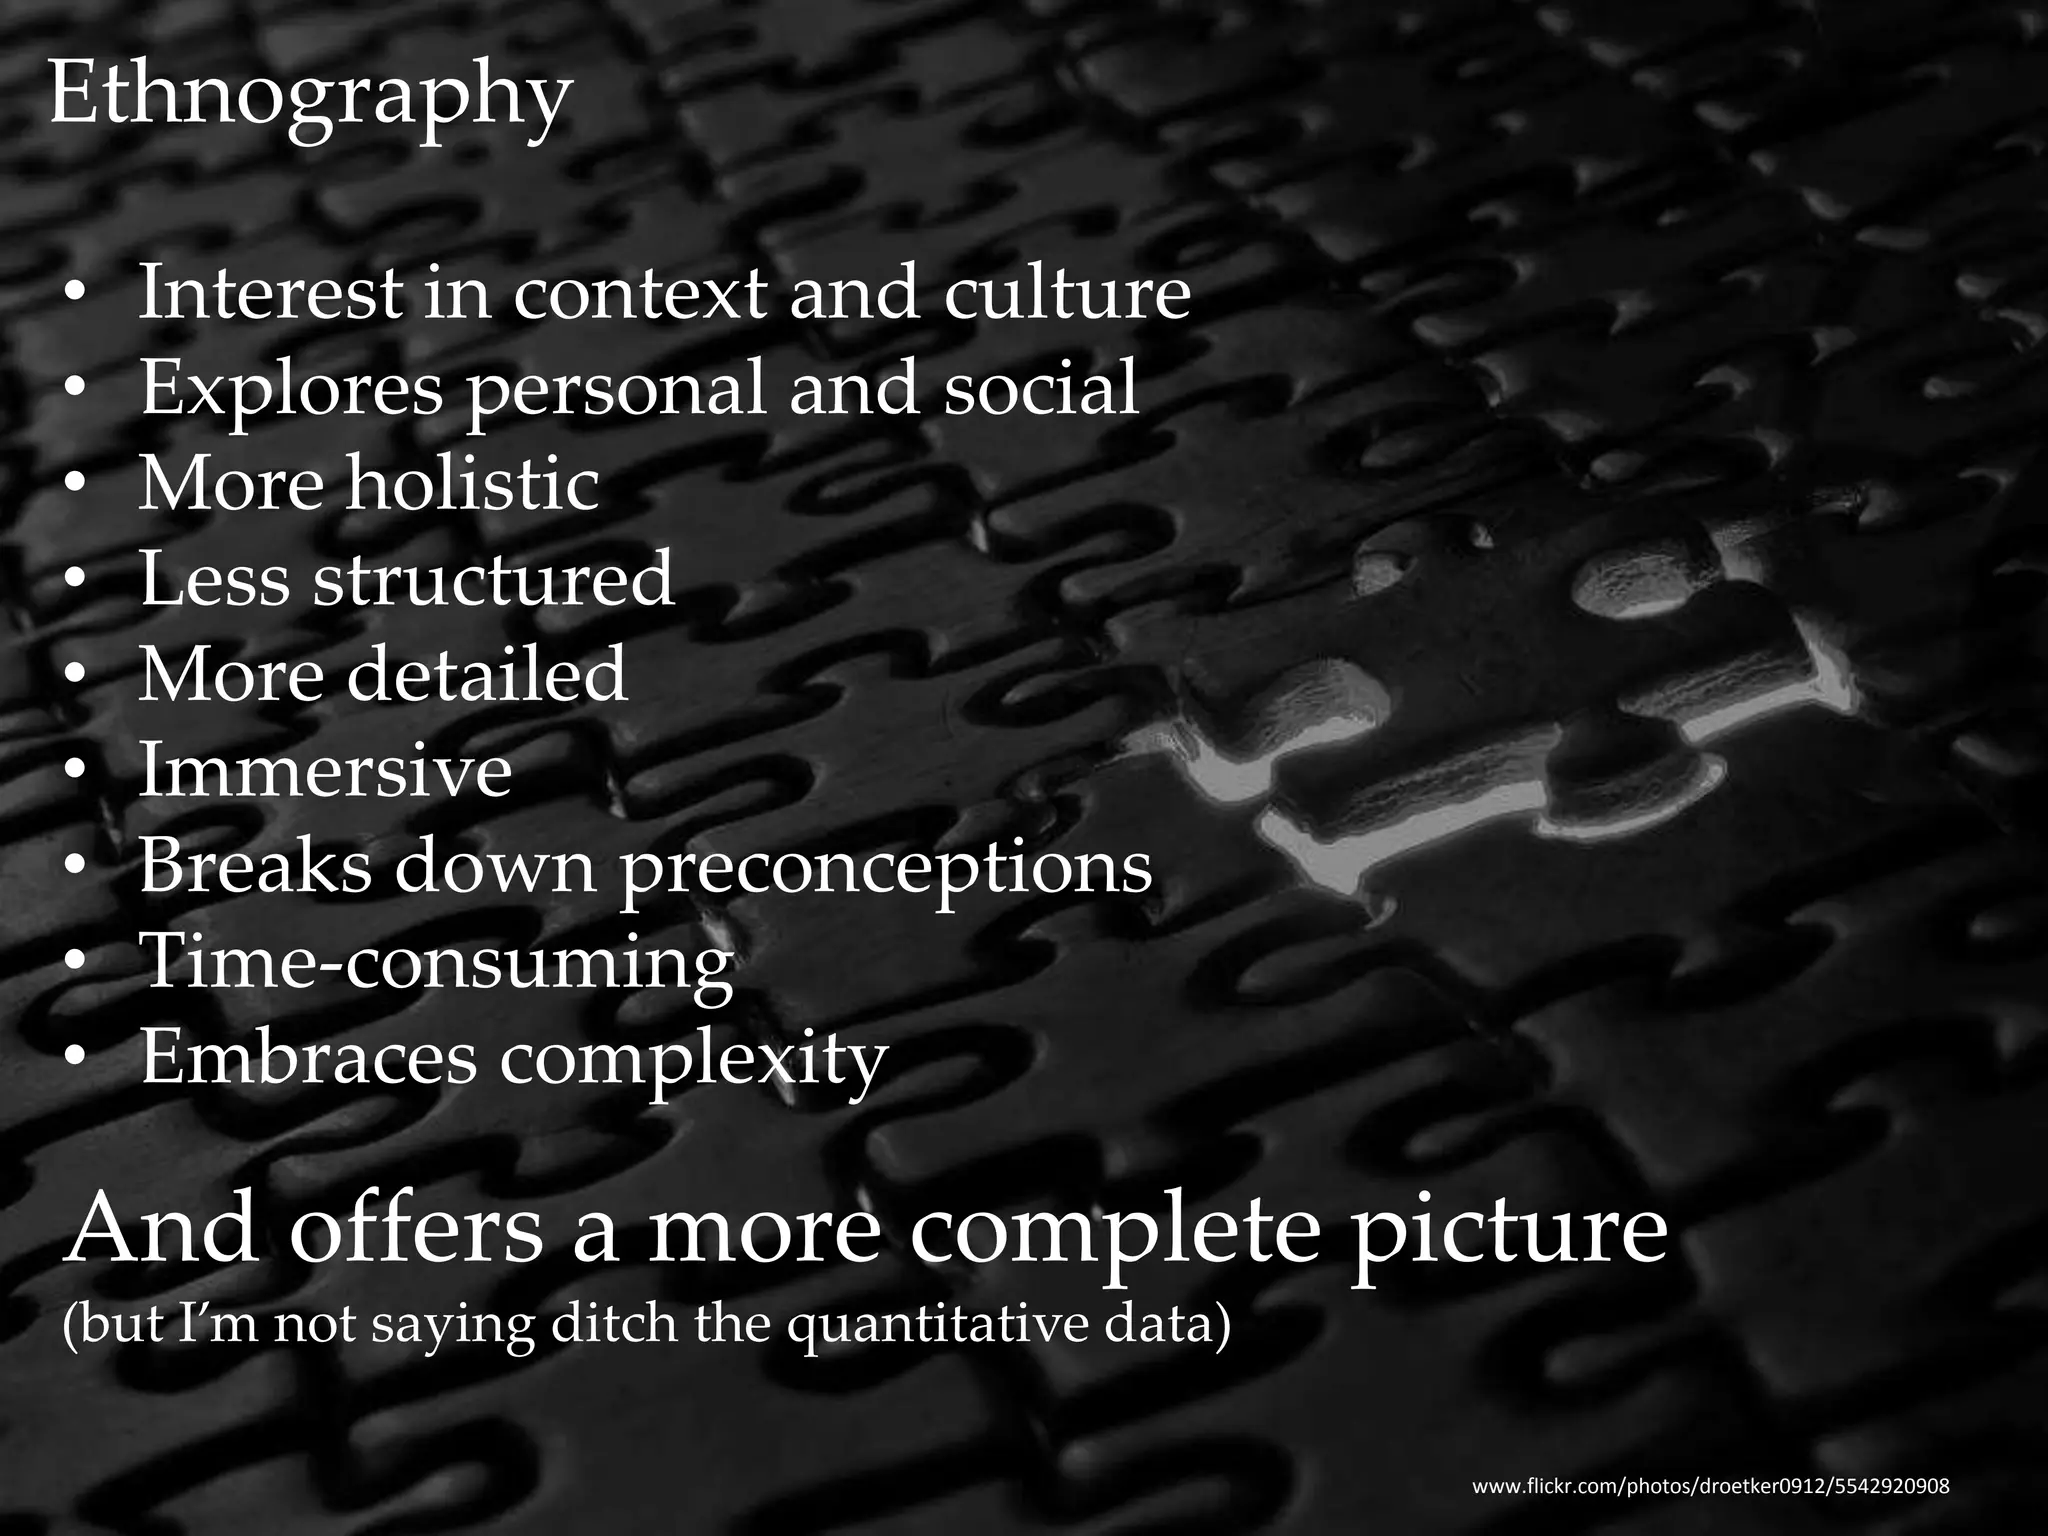
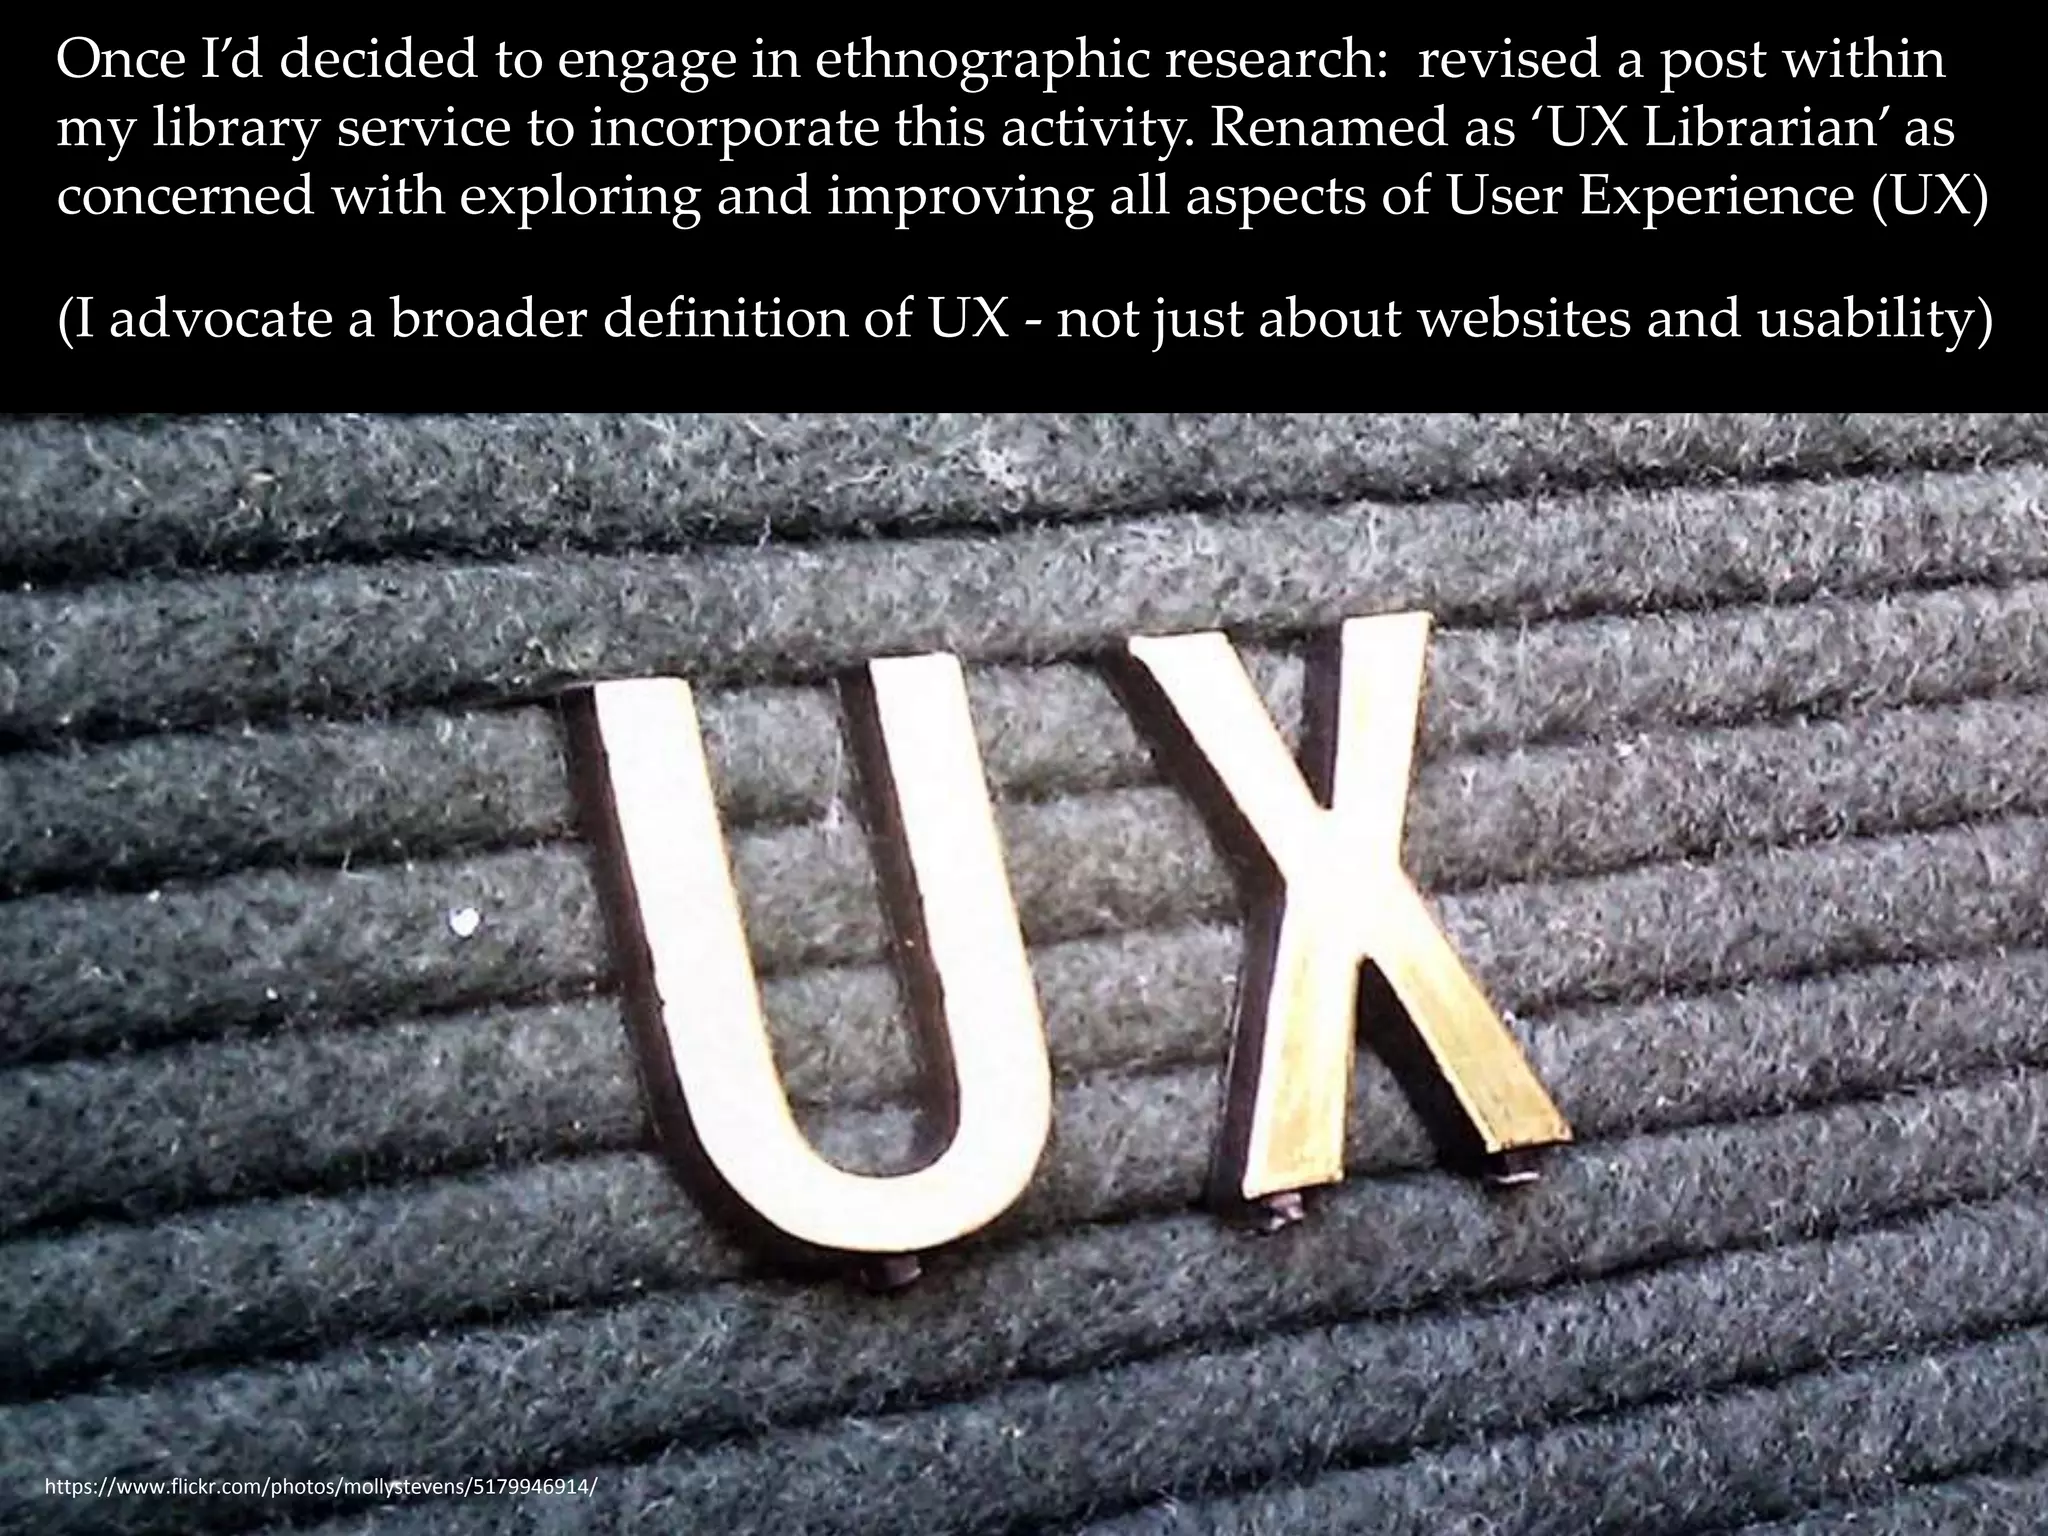
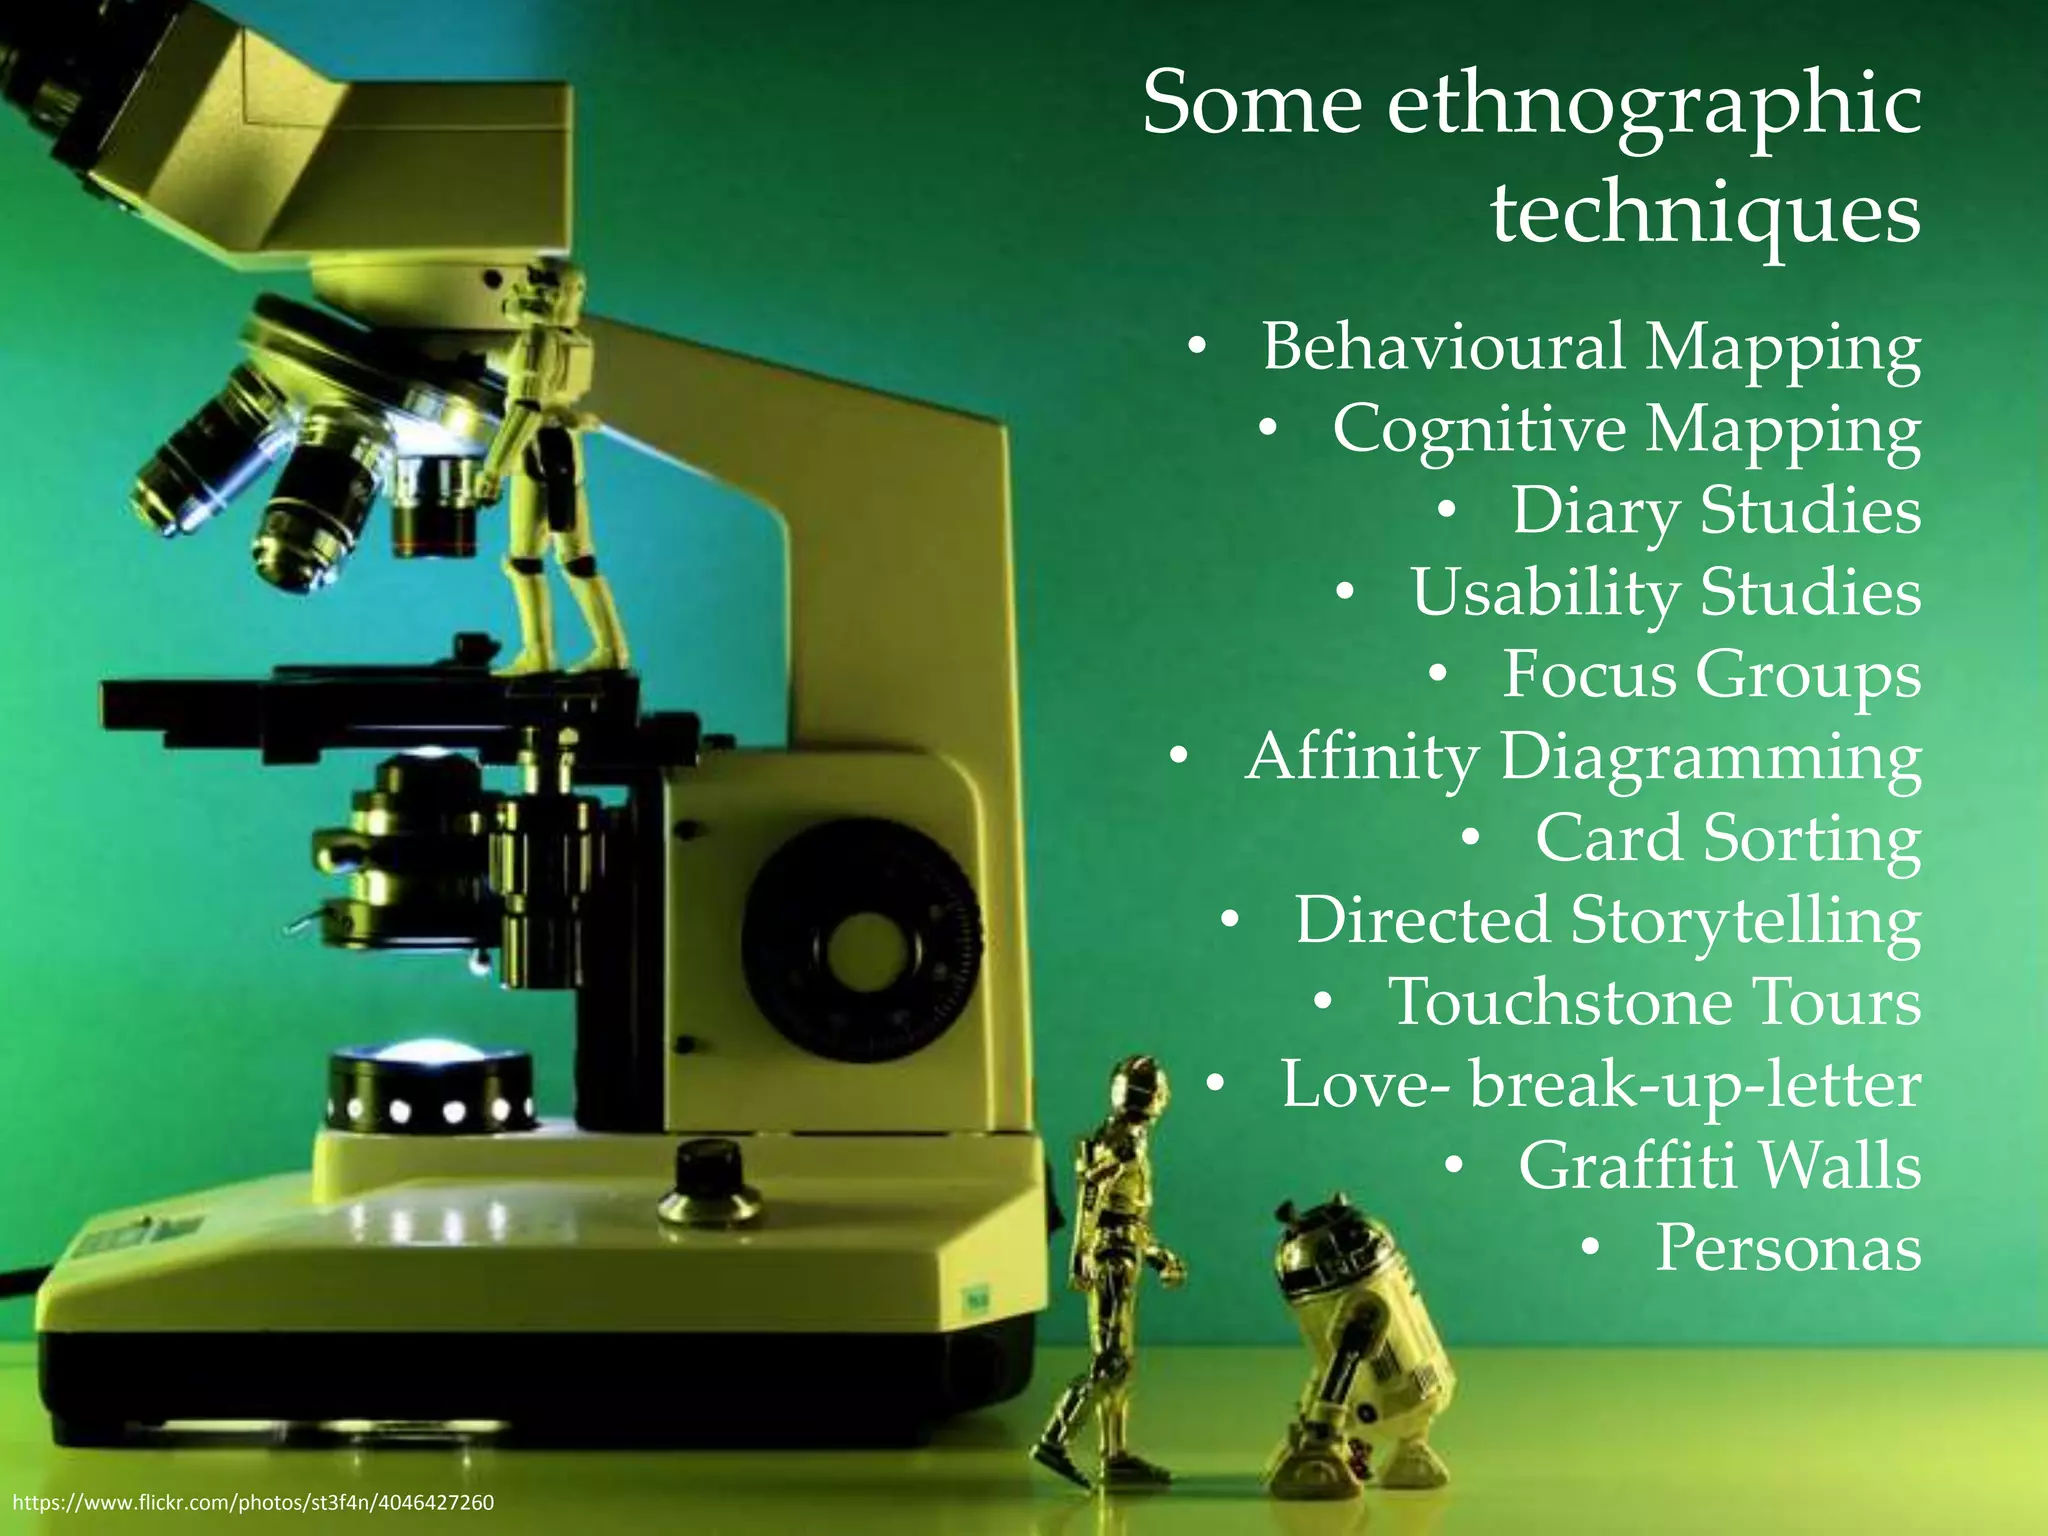
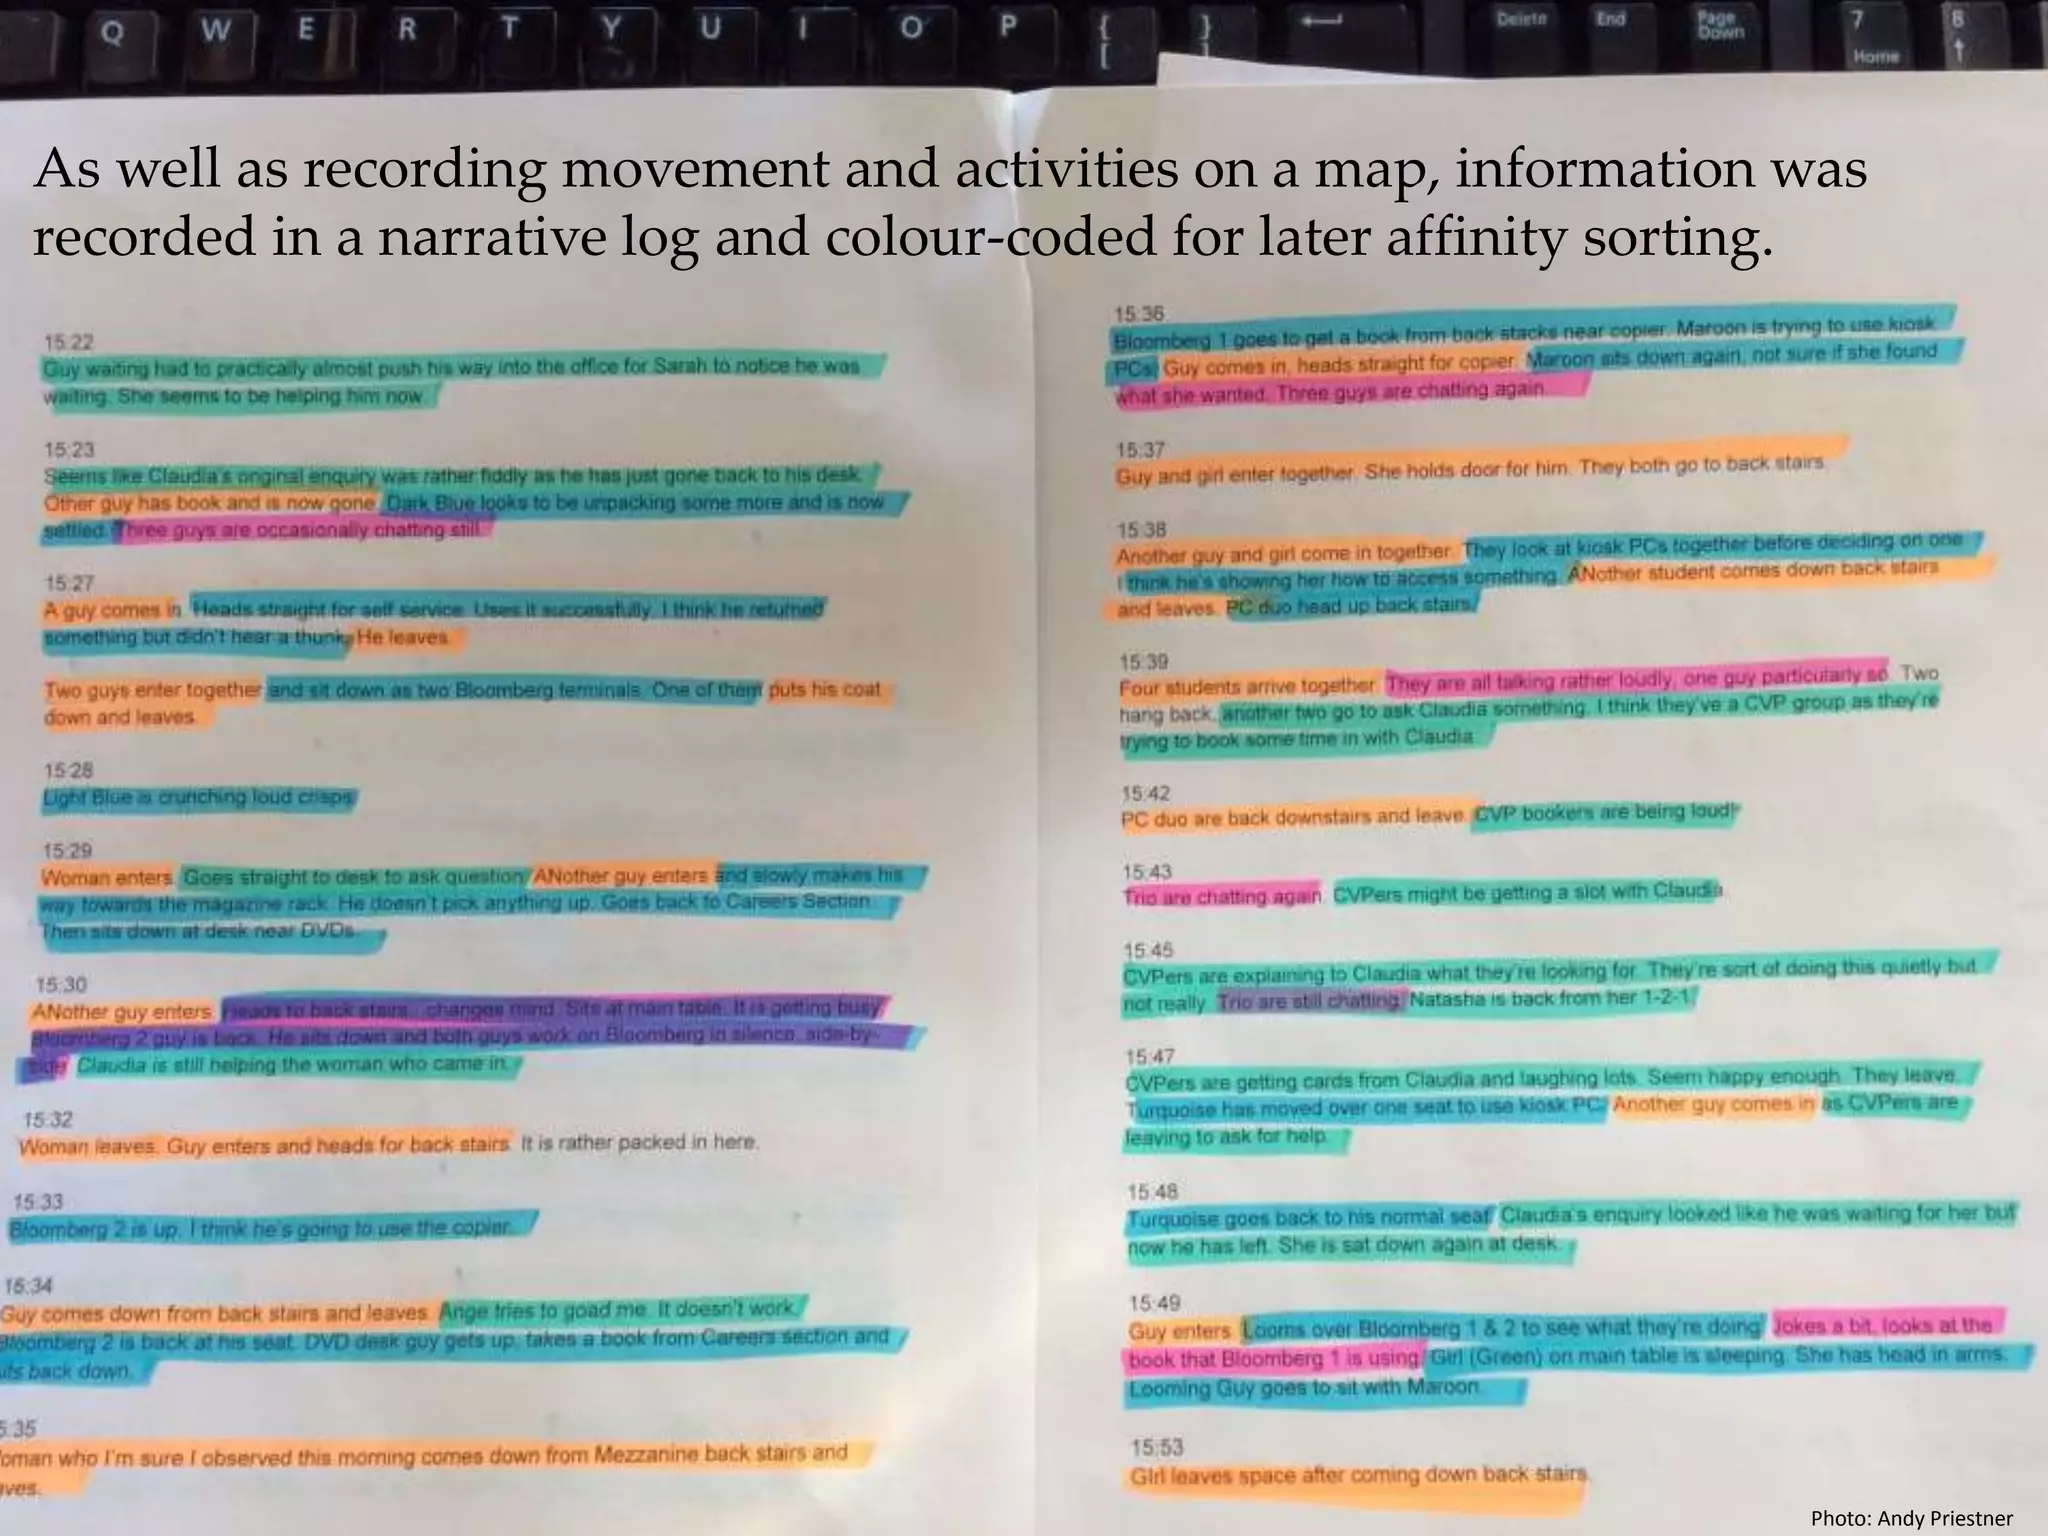
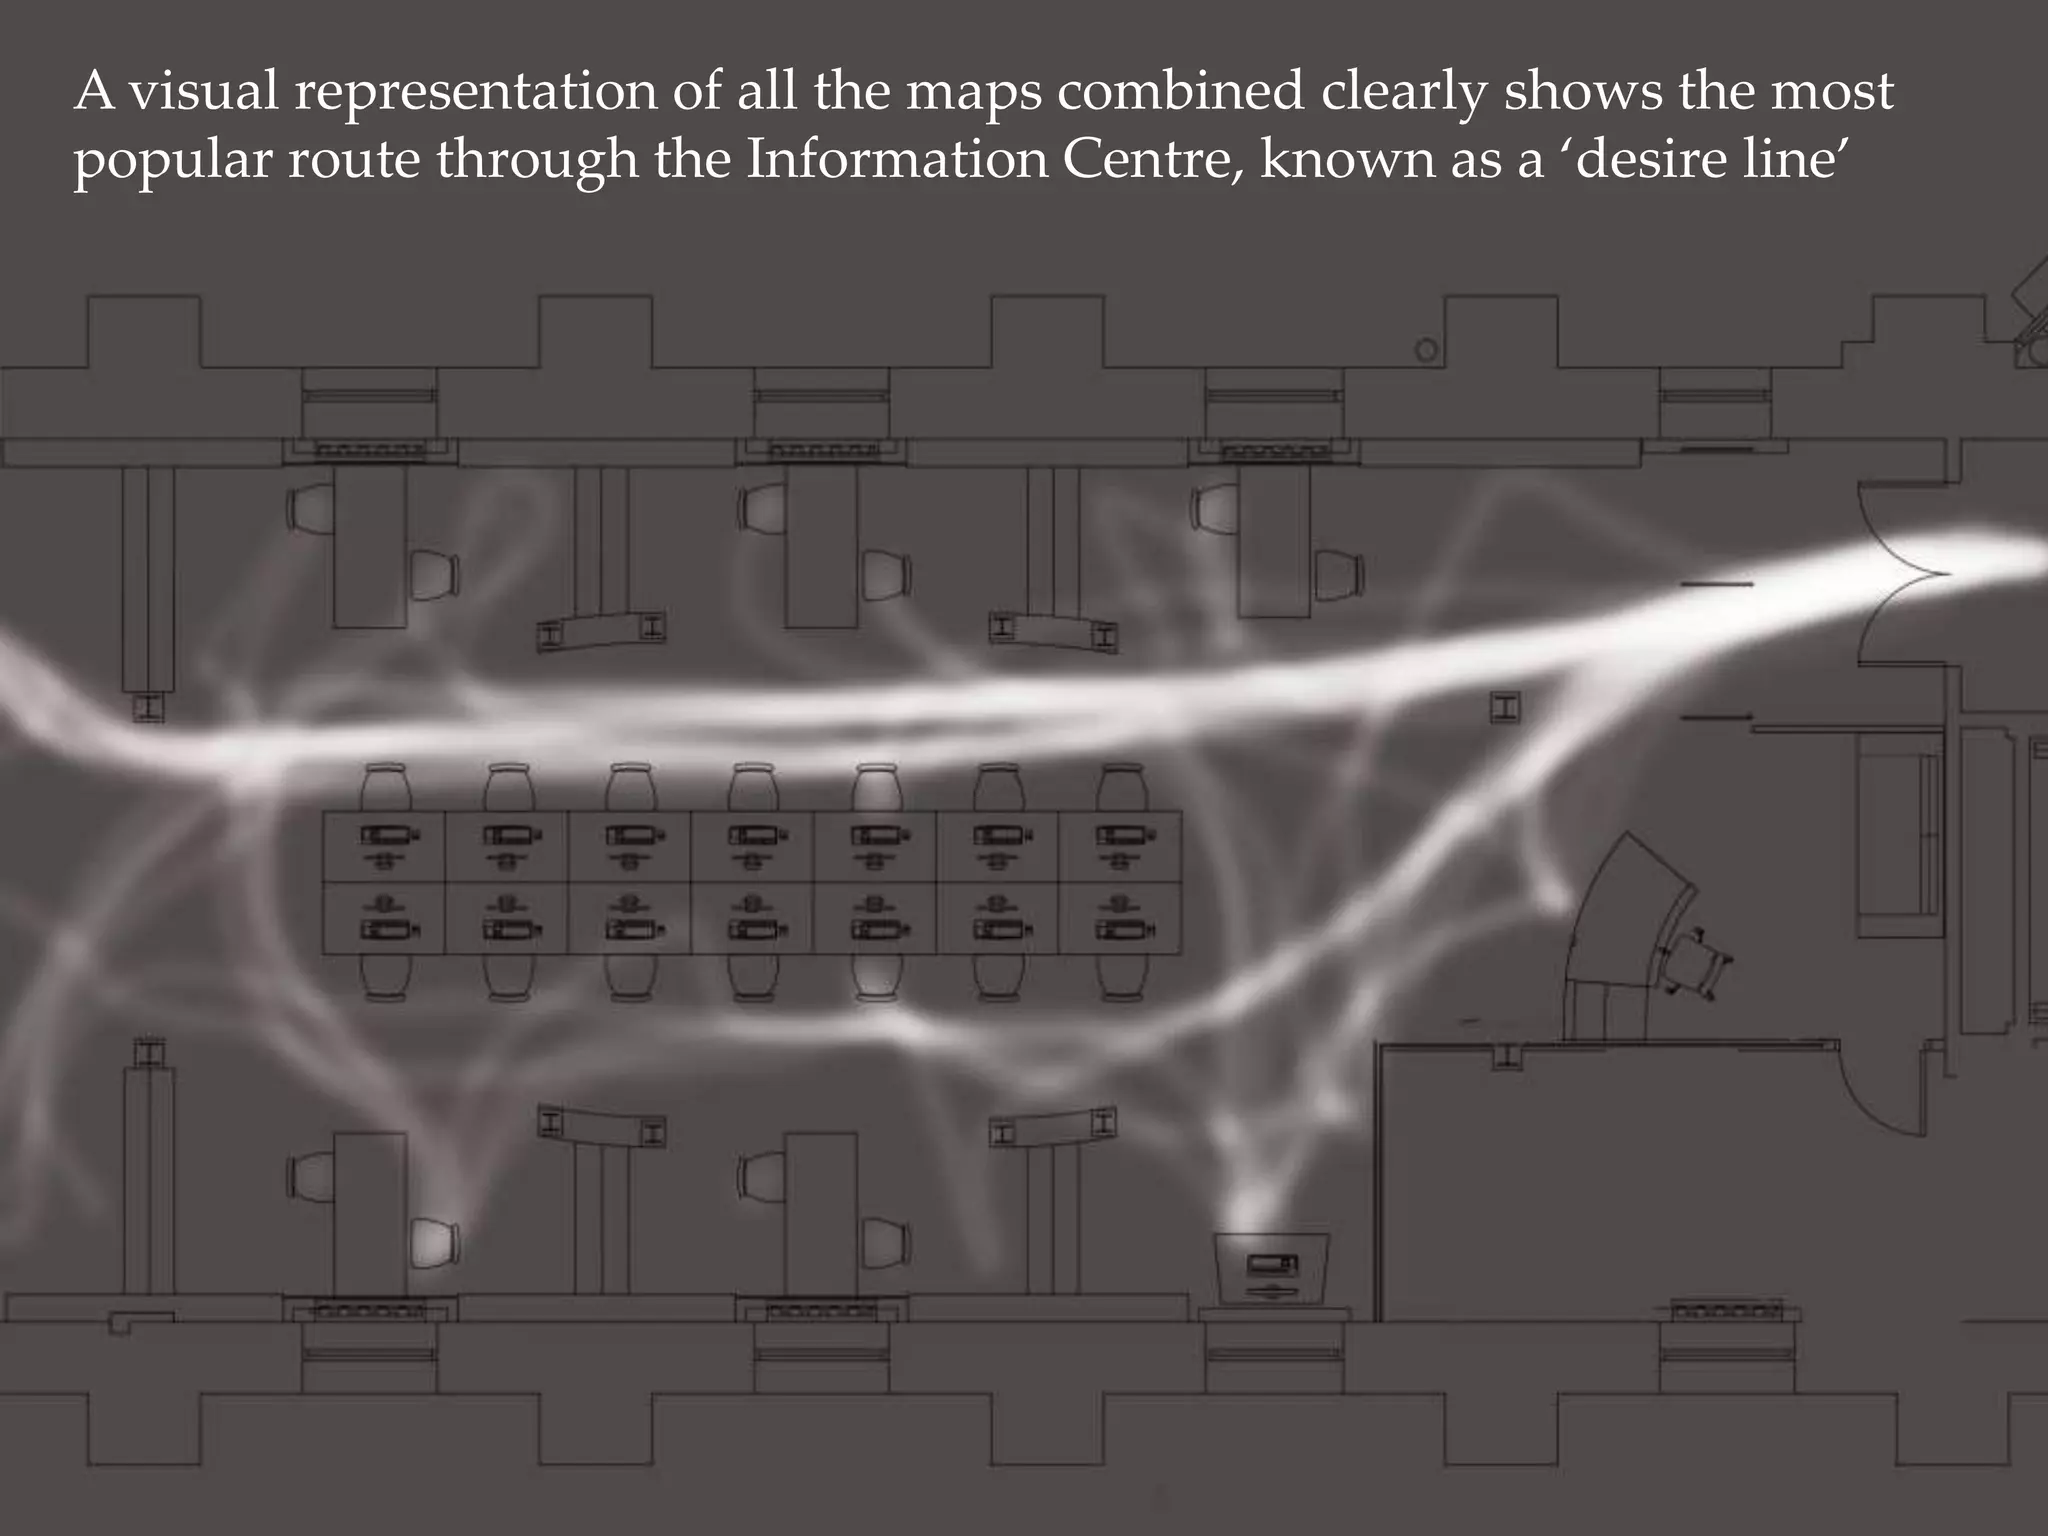
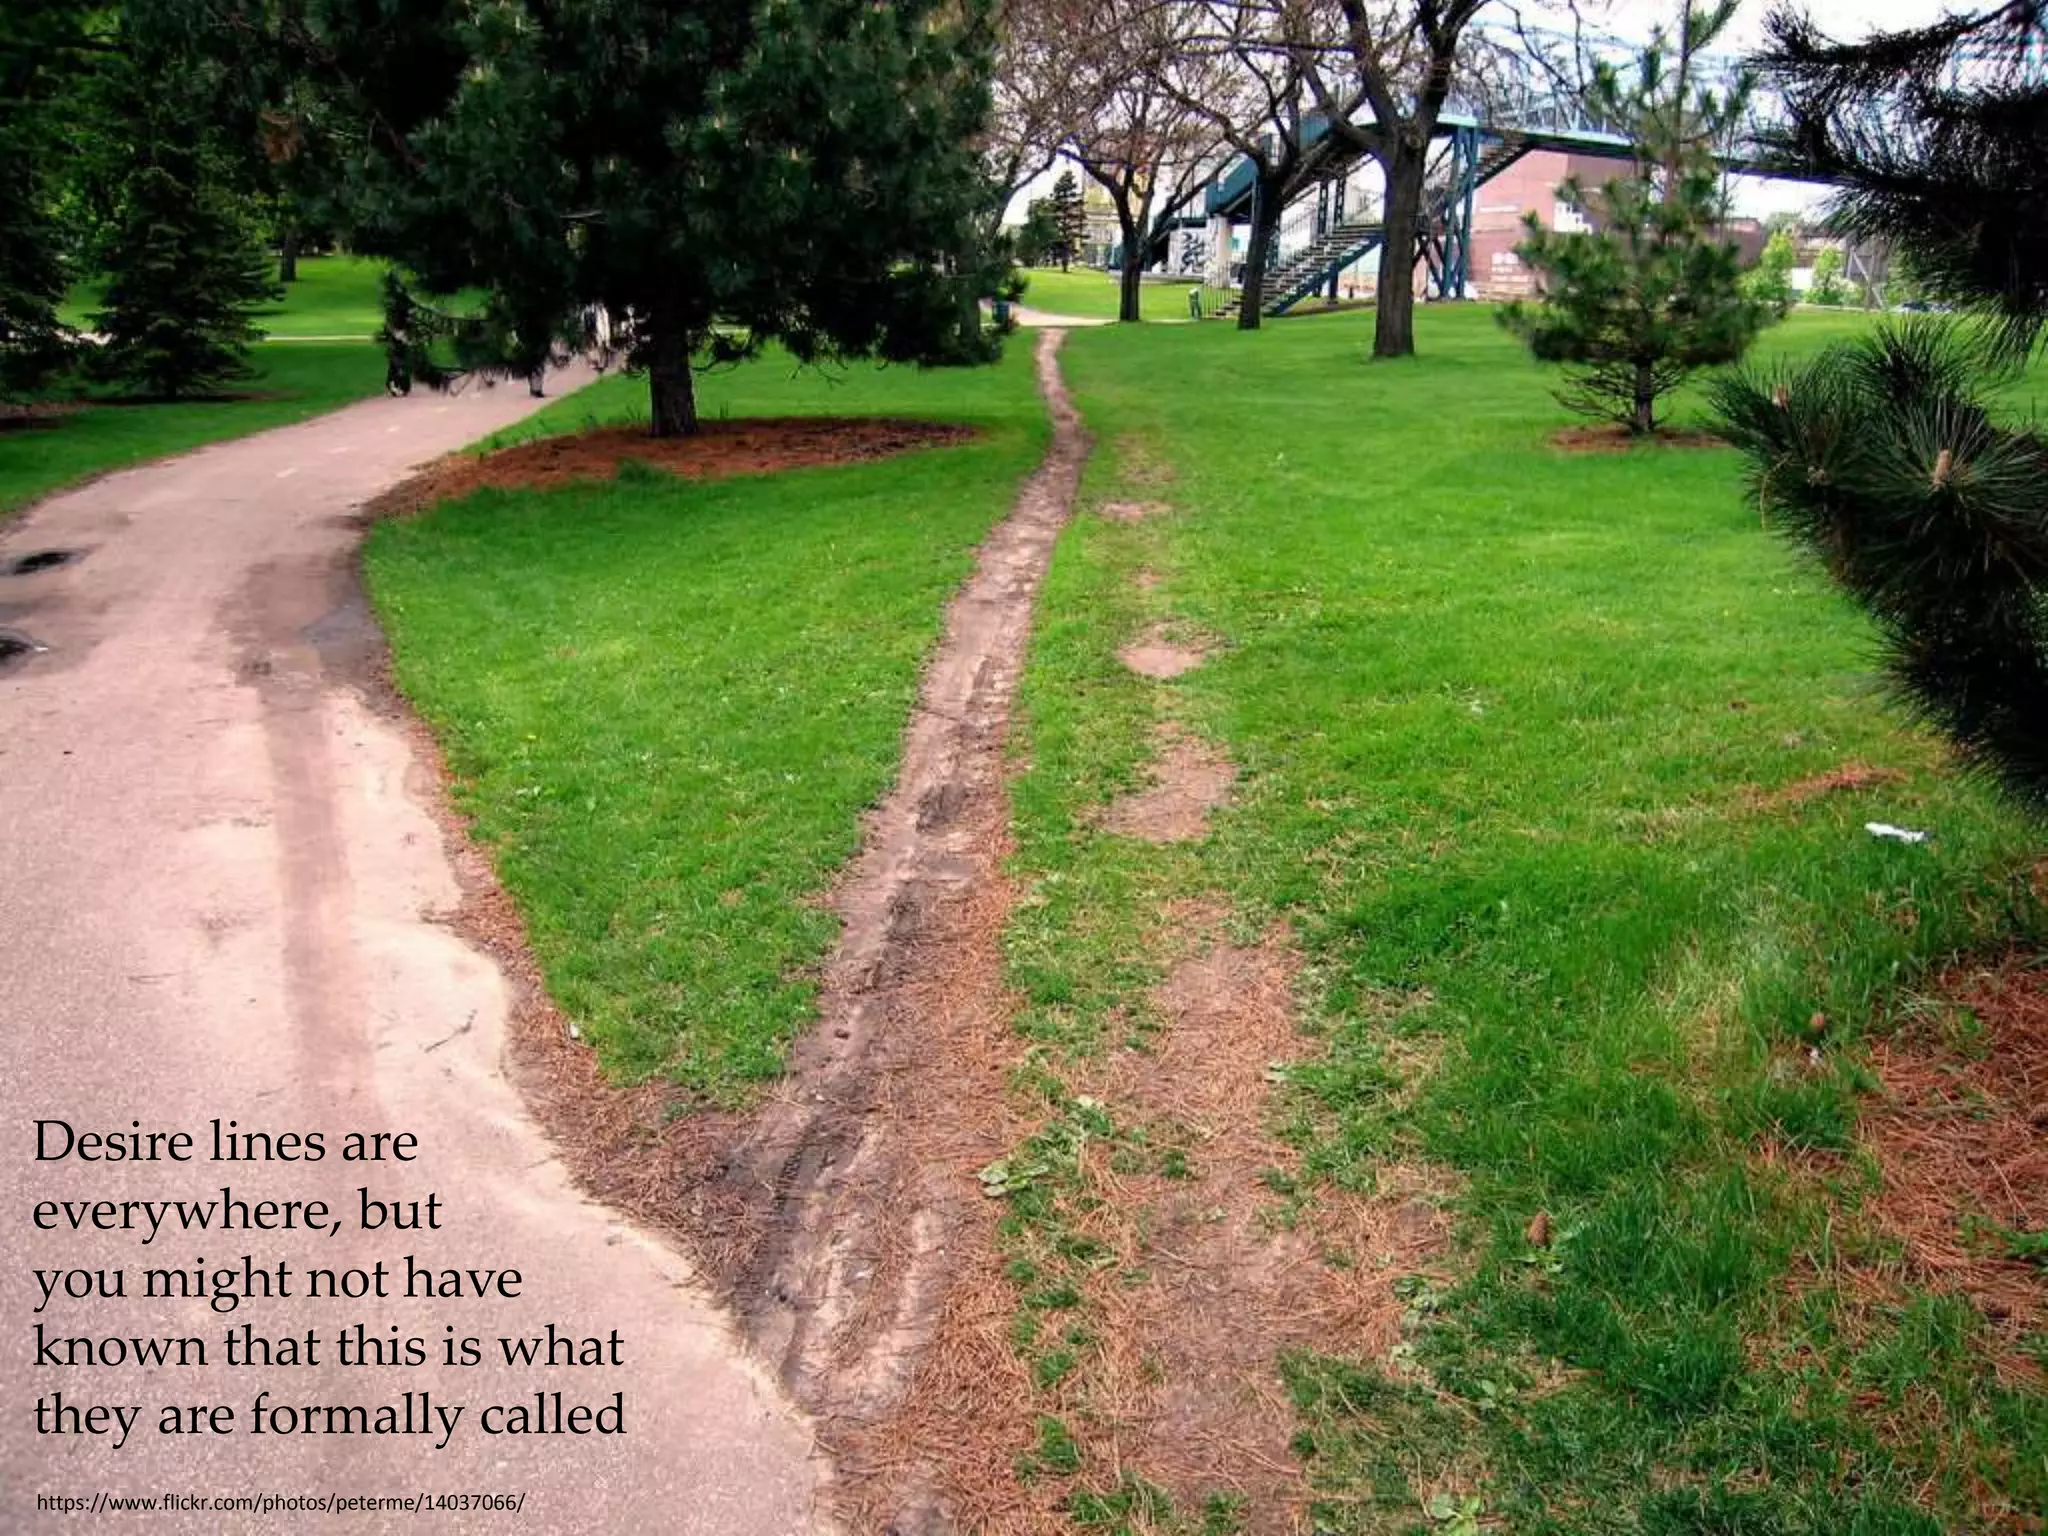
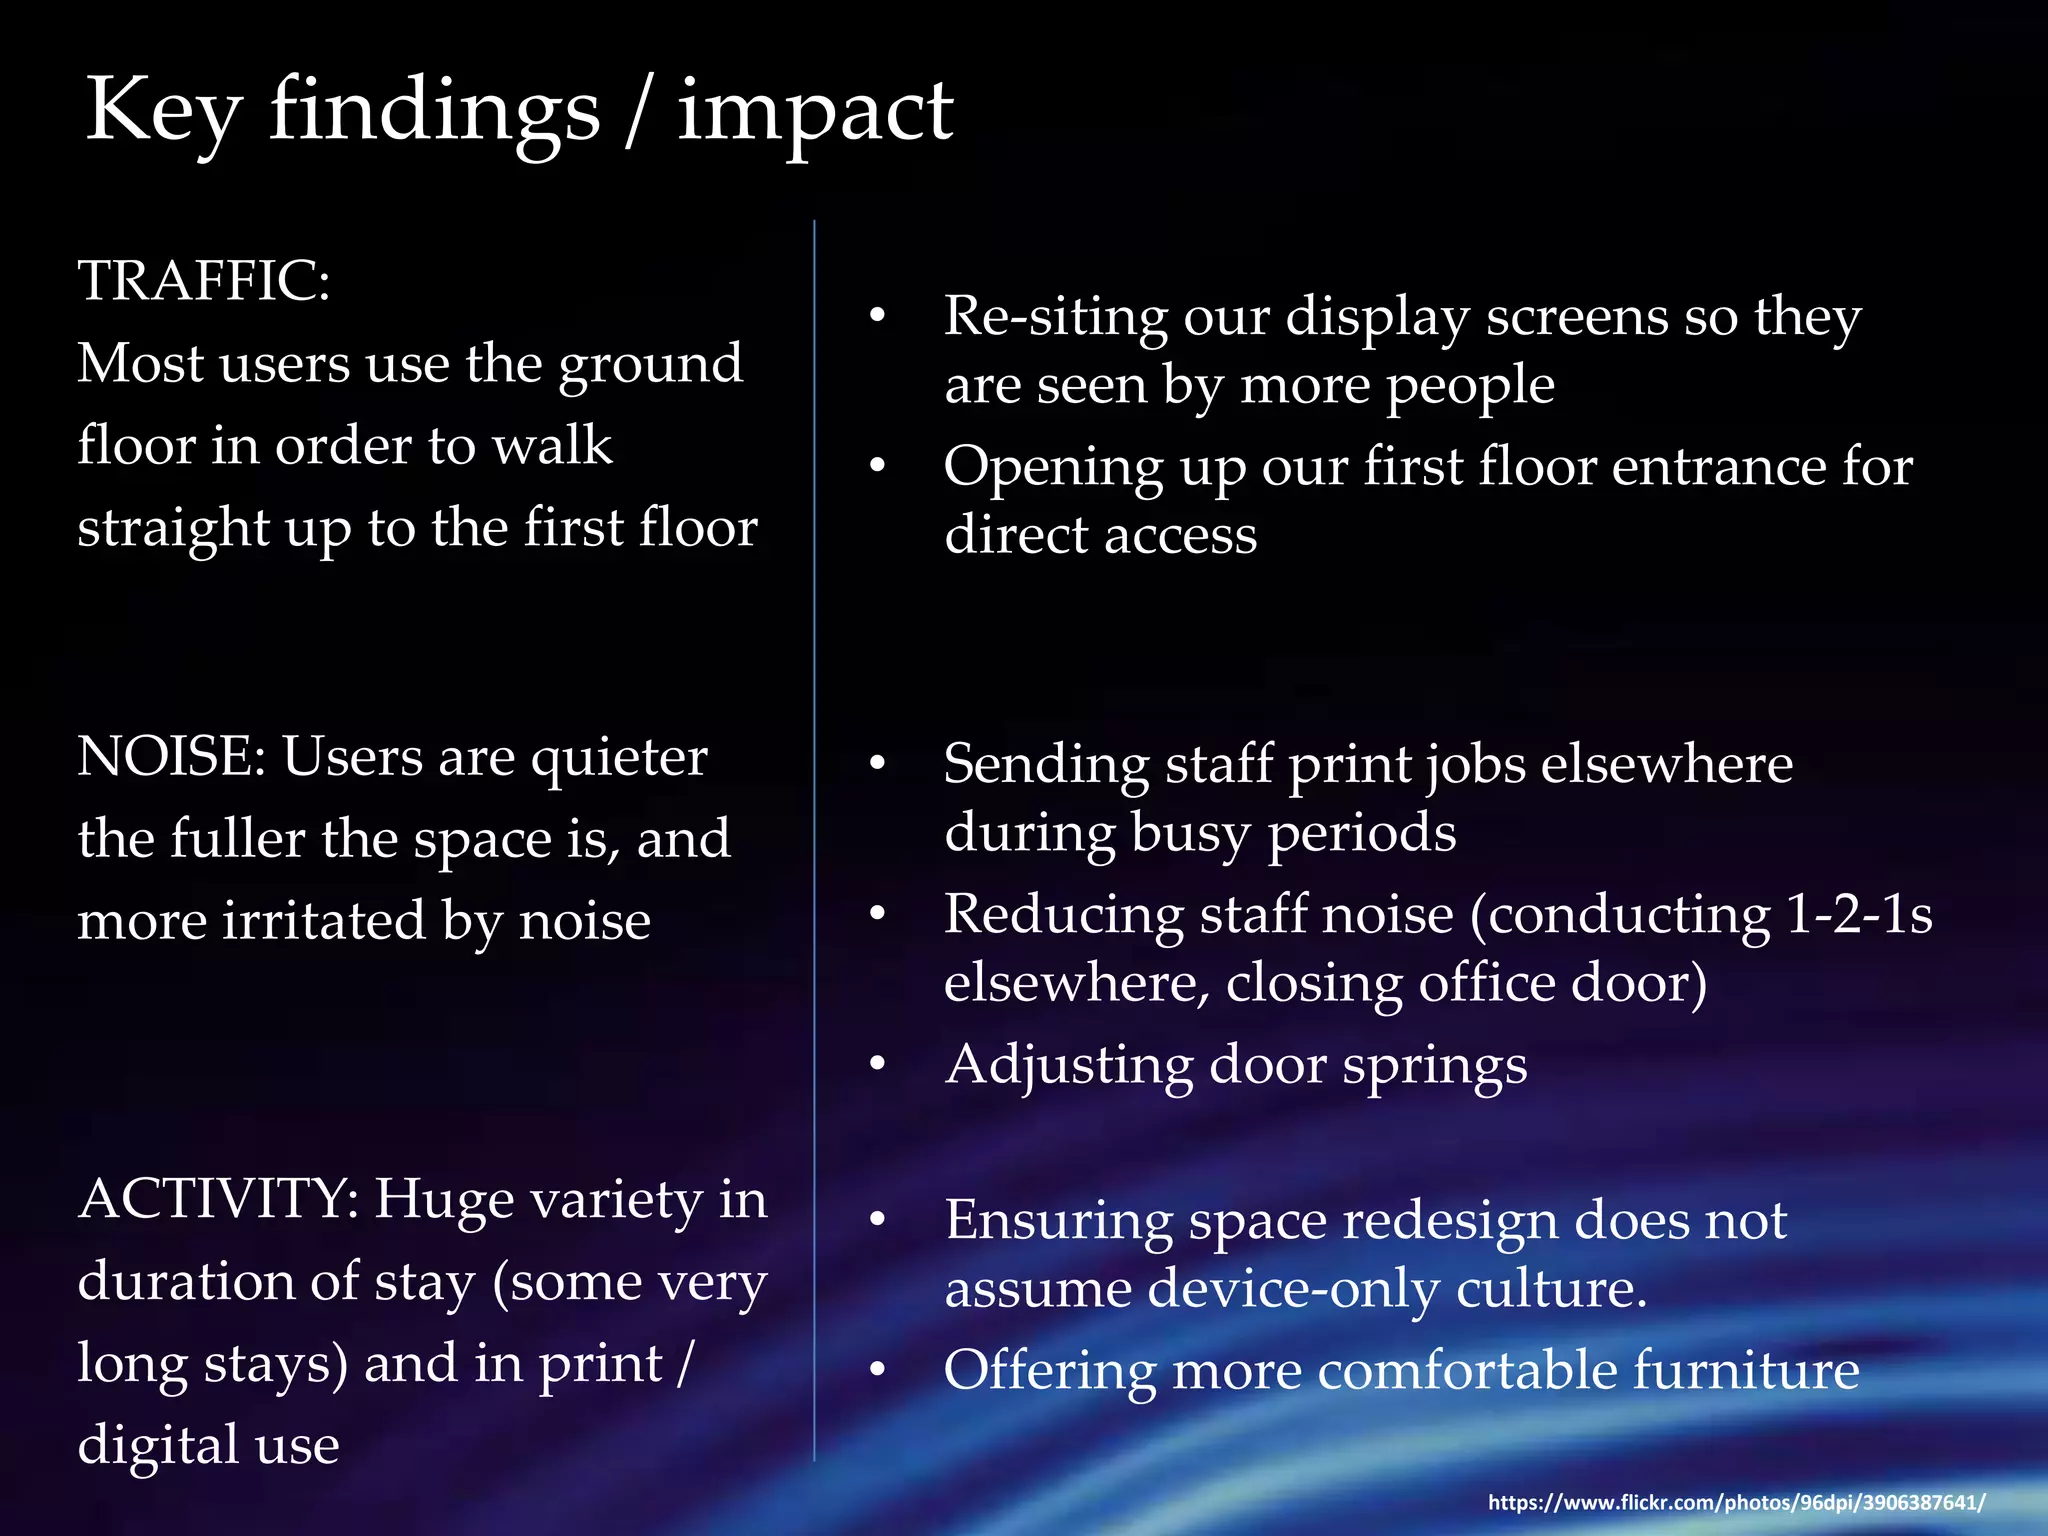
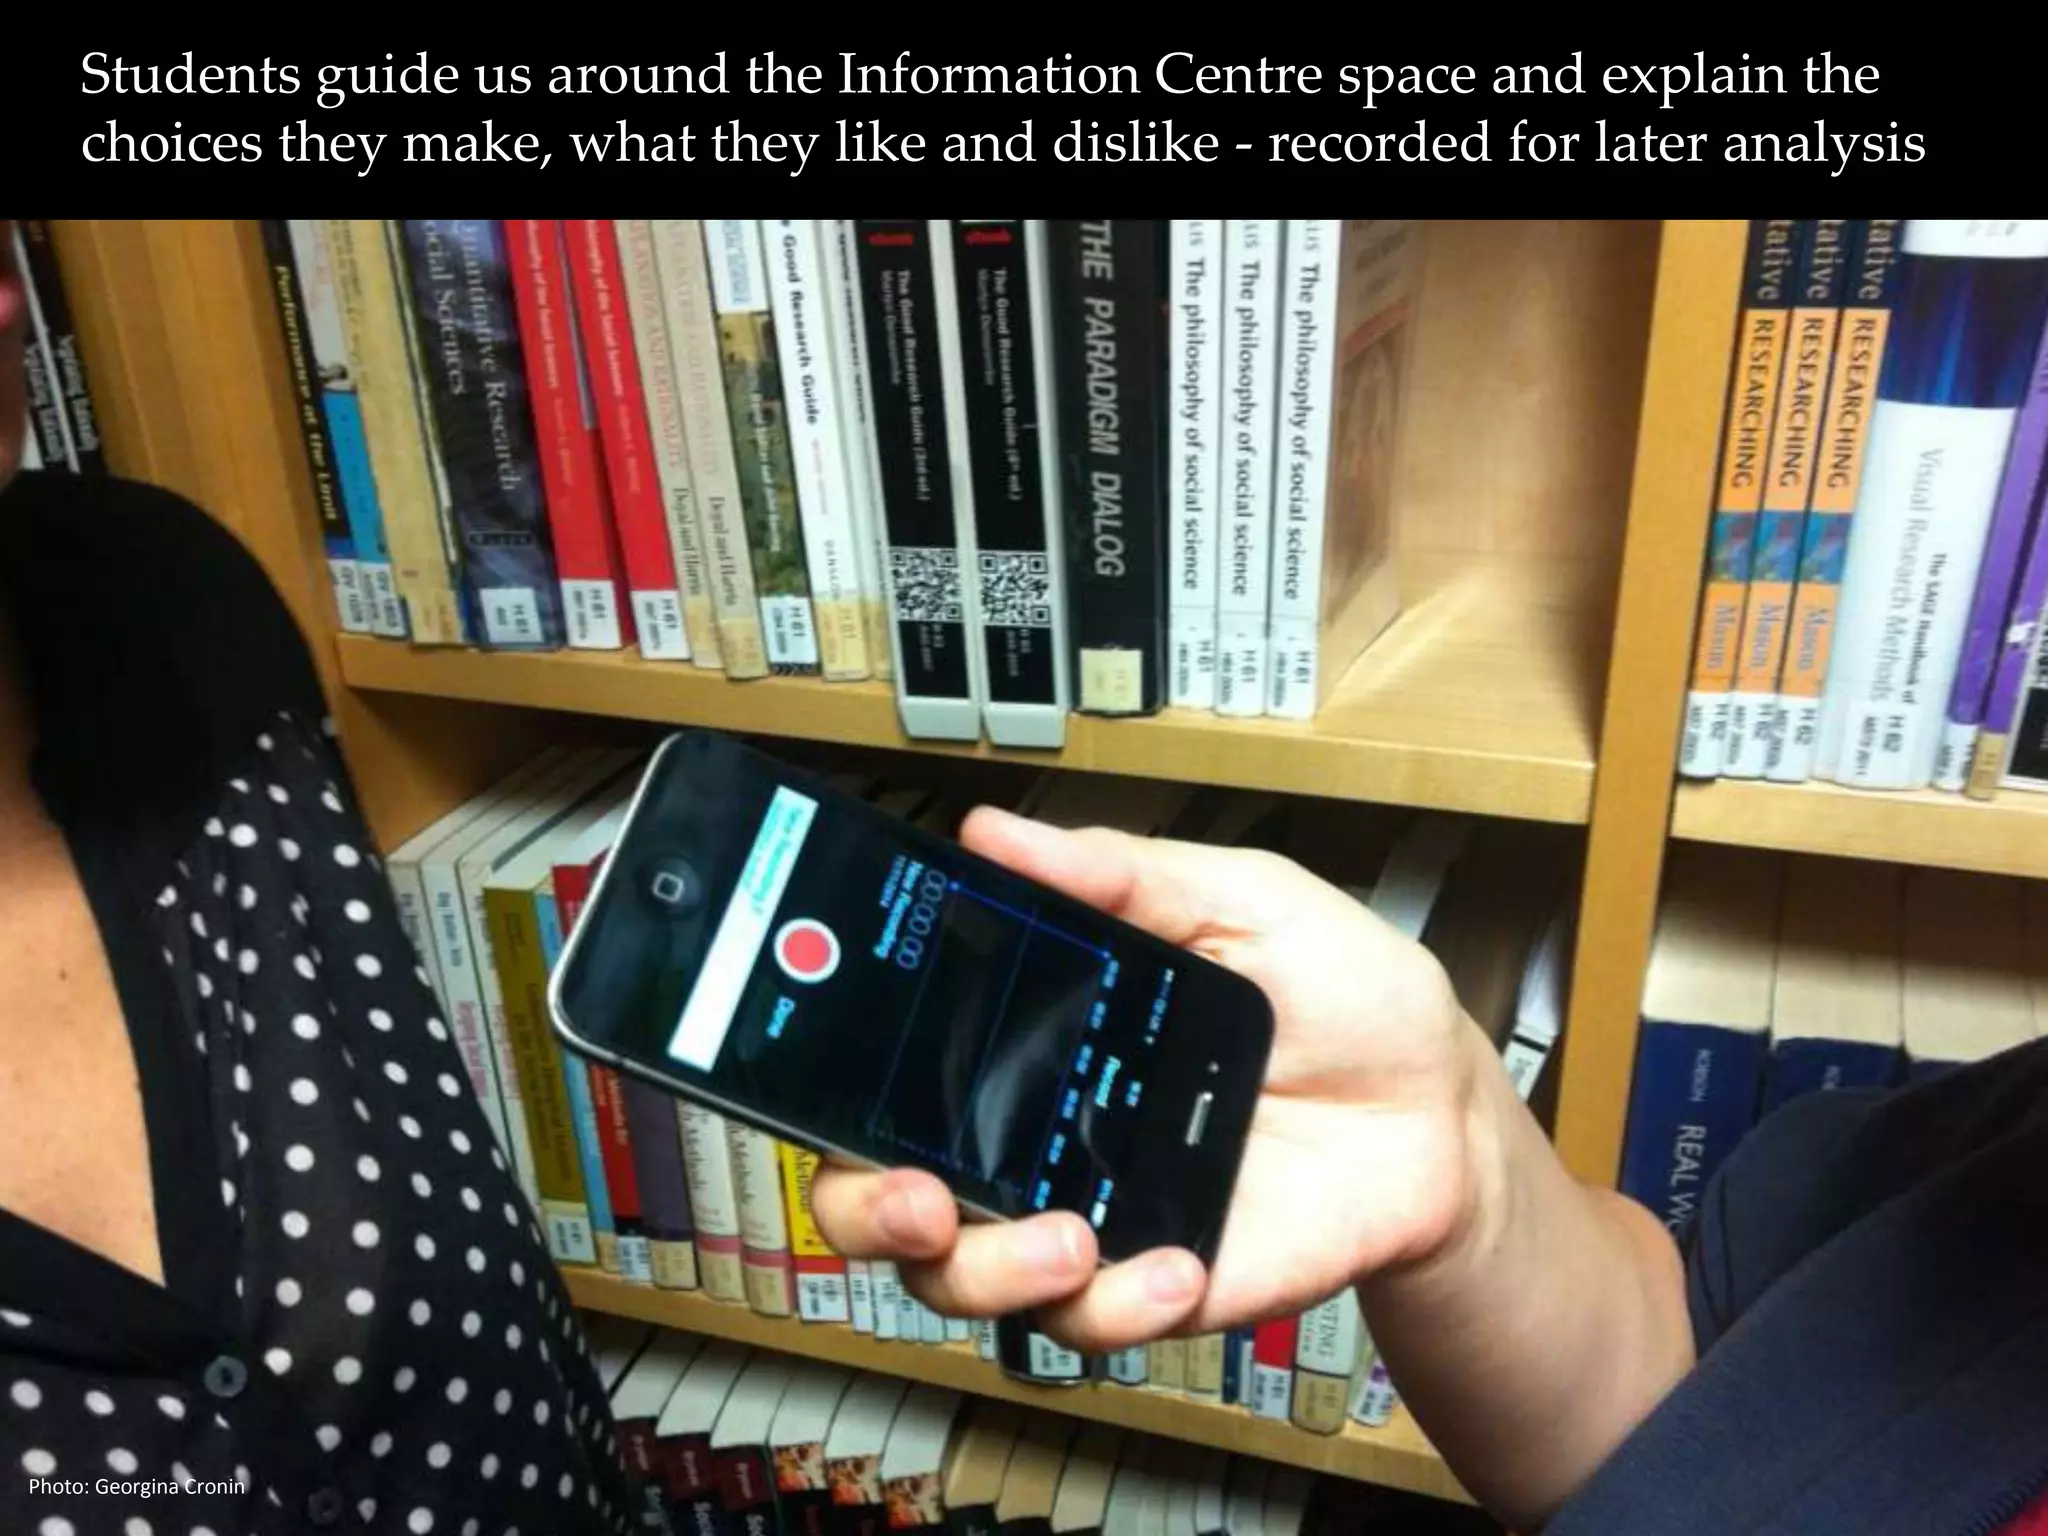
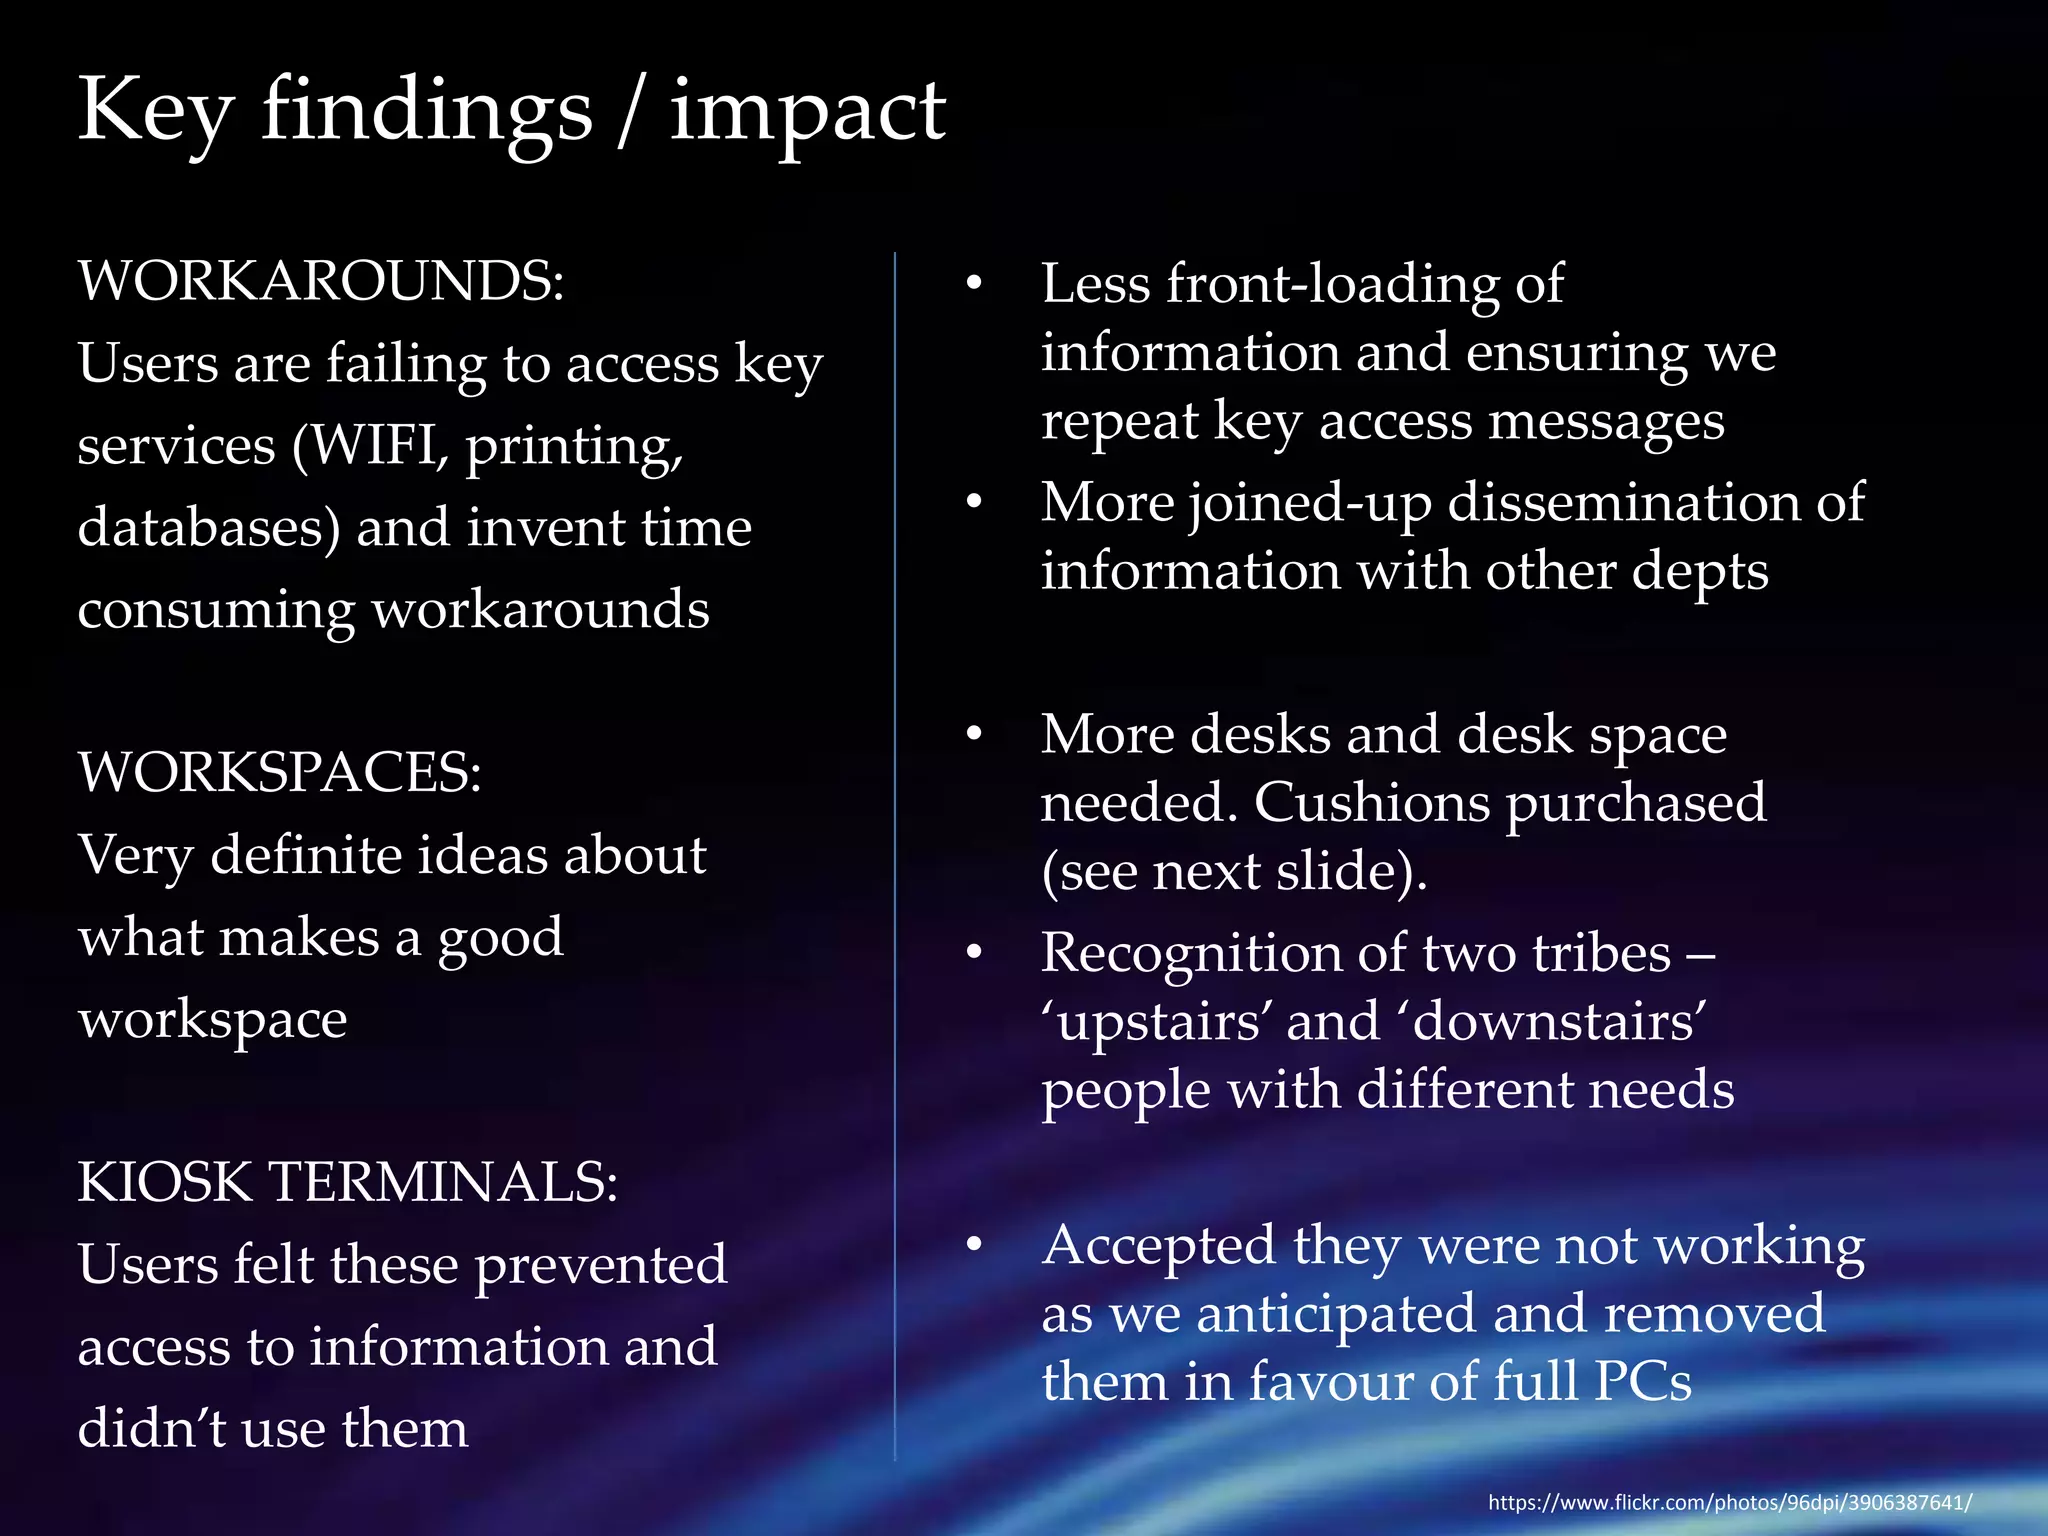
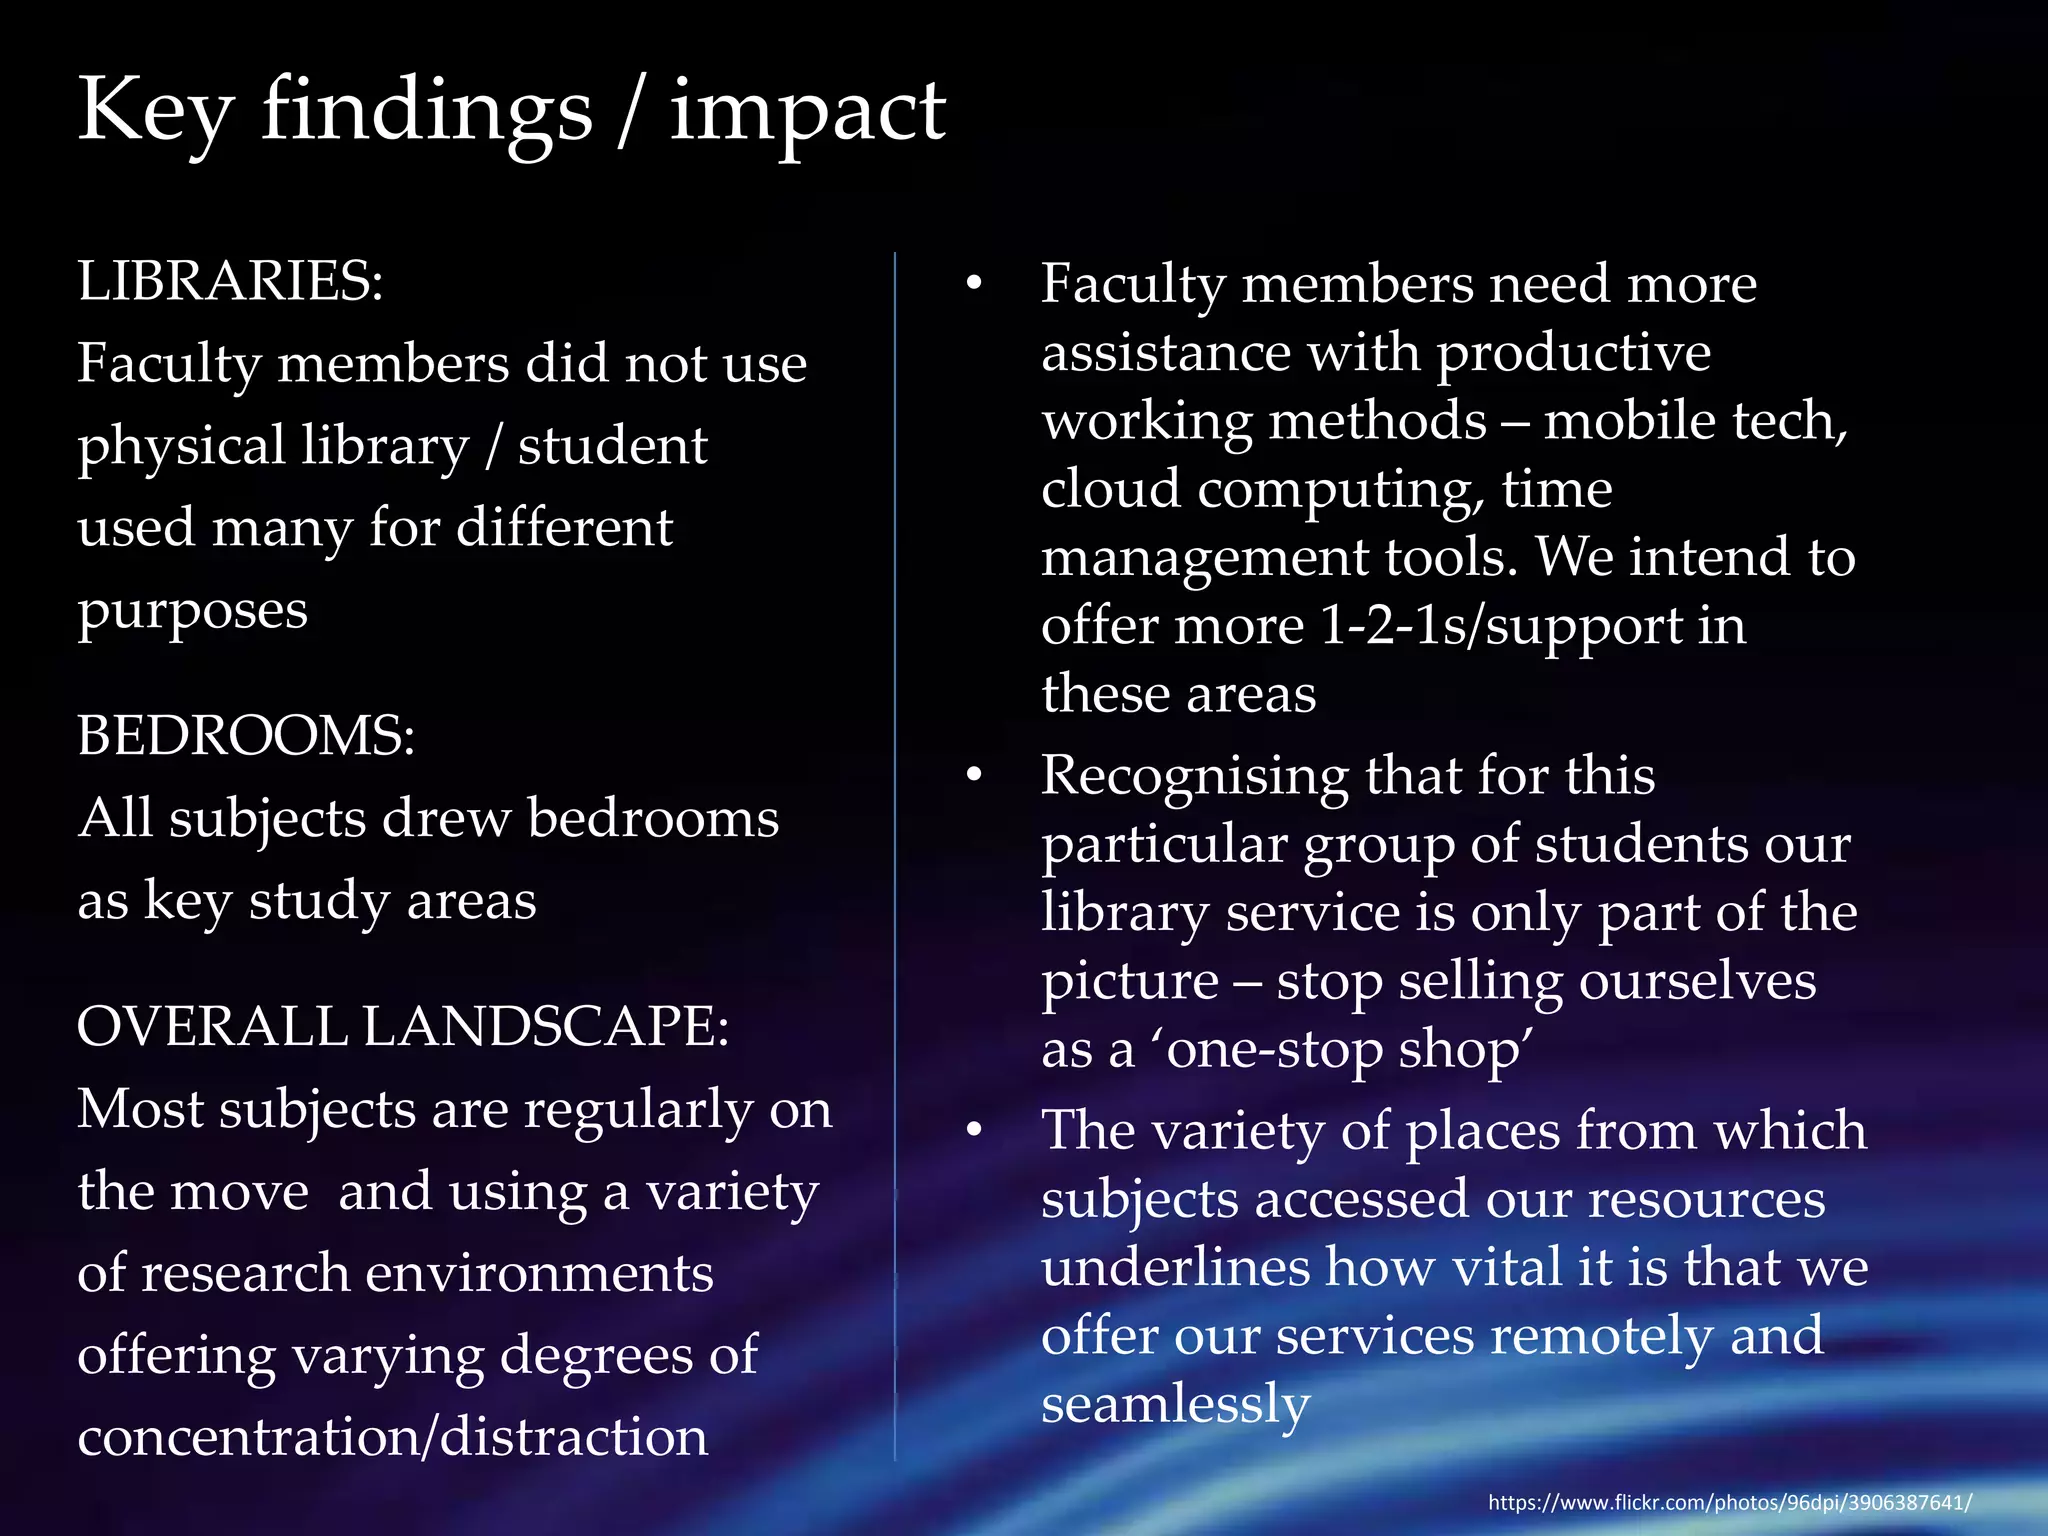
Ethnography 
for impact 
a new way of exploring 
user experience 
in libraries 
__________________ 
Andy Priestner 
(@PriestLib) 
https://www.flickr.com/photos/chasblackman/8502151556/
Judge Business School, University of Cambridge - 
one of the top business schools in Europe 
- very high-fee paying students (MBAs – 40k per annum) 
- students consistently rate our library service as excellent 
But I KNOW its not perfect, and until 
recently I really didn’t know 
enough about the library 
experience of our 
users… 
https://www.flickr.com/photos/mark_ch/5447151529
I, like most librarians, was more used 
to – and more comfortable with – 
sending out annual surveys, and 
chiefly recording quantitative facts 
My only qualitative approaches 
were comment boxes and, very 
occasional, focus groups 
and usability studies 
https://www.flickr.com/photos/64763706@N08/6850650385
As a result... 
• too much of my service data was 
only coming from those people 
who filled in the library survey 
• I was using too many closed or 
leading questions 
• and routinely interpreting 
increases and decreases ‘blind’ 
rather than researching further 
• largely ignoring qualitative 
feedback as it was ‘difficult’ 
• and when the comments boxes 
were left empty, as they so often 
are, I was not following up to 
find out more 
• and I knew full well that self-reporting 
is largely unreliable 
and skewed 
...so what was the answer? 
https://www.flickr.com/photos/rsms/1479448133/
Ethnography 
a way of studying 
cultures through 
observation, 
participation and 
qualitative 
techniques 
https://www.flickr.com/photos/collin_key/6080864794/
Conjured up the image of a white man 
‘going native’ in the South Pacific 
Ethnography - Malinowksi 
Credit: London School of Economics
‘The final goal is to grasp the native’s point of view, 
his relation to life, to realise his vision of the world’ 
(Malinowski – founding father 
of ethnography, 1925) 
Ethnography - Malinowksi 
Credit: London School of Economics
https://www.flickr.com/photos/arthurjohnpicton/4387576057 
‘The final goal is to 
grasp the user’s point of 
view, their relation to 
life, to realise their 
vision of the world’ 
Change just 
one word and 
highly 
relevant to 
libraries…
Ethnography 
• Interest in context and culture 
• Explores personal and social 
• More holistic 
• Less structured 
• More detailed 
• Immersive 
• Breaks down preconceptions 
• Time-consuming 
• Embraces complexity 
And offers a more complete picture 
(but I’m not saying ditch the quantitative data) 
www.flickr.com/photos/droetker0912/5542920908
Once I’d decided to engage in ethnographic research: revised a post within 
my library service to incorporate this activity. Renamed as ‘UX Librarian’ as 
concerned with exploring and improving all aspects of User Experience (UX) 
(I advocate a broader definition of UX - not just about websites and usability) 
https://www.flickr.com/photos/mollystevens/5179946914/
Some ethnographic 
techniques 
• Behavioural Mapping 
• Cognitive Mapping 
• Diary Studies 
• Usability Studies 
• Focus Groups 
• Affinity Diagramming 
• Card Sorting 
• Directed Storytelling 
• Touchstone Tours 
• Love- break-up-letter 
• Graffiti Walls 
• Personas 
https://www.flickr.com/photos/st3f4n/4046427260
3 Ethnographic 
Research Projects 
@ Judge Business School
~ 1 ~ 
Behavioural 
Mapping
Observing use of the 
Information Centre and 
mapping the results 
Behavioural mapping 
(Our UX Librarian 
- Georgina Cronin) 
Photo: Andy Priestner
The study (undertaken in a series of hour-long observation sessions) involved: 
mapping routes; volume of traffic; duration of stay; activities undertaken; 
interaction between users; choice of desks; staff assistance, food and drink 
consumed (we allow both); devices used; databases used; use of self-service.
As well as recording movement and activities on a map, information was 
recorded in a narrative log and colour-coded for later affinity sorting. 
Photo: Andy Priestner
A visual representation of all the maps combined clearly shows the most 
popular route through the Information Centre, known as a ‘desire line’
Desire lines are 
everywhere, but 
you might not have 
known that this is what 
they are formally called 
https://www.flickr.com/photos/peterme/14037066/
Key findings / impact 
TRAFFIC: 
Most users use the ground 
floor in order to walk 
straight up to the first floor 
NOISE: Users are quieter 
the fuller the space is, and 
more irritated by noise 
ACTIVITY: Huge variety in 
duration of stay (some very 
long stays) and in print / 
digital use 
• Re-siting our display screens so they 
are seen by more people 
• Opening up our first floor entrance for 
direct access 
• Sending staff print jobs elsewhere 
during busy periods 
• Reducing staff noise (conducting 1-2-1s 
elsewhere, closing office door) 
• Adjusting door springs 
• Ensuring space redesign does not 
assume device-only culture. 
• Offering more comfortable furniture 
https://www.flickr.com/photos/96dpi/3906387641/
~ 2 ~ 
Show-me 
-round
Students guide us around the Information Centre space and explain the 
choices they make, what they like and dislike - recorded for later analysis 
Photo: Georgina Cronin
Key findings / impact 
WORKAROUNDS: 
Users are failing to access key 
services (WIFI, printing, 
databases) and invent time 
consuming workarounds 
WORKSPACES: 
Very definite ideas about 
what makes a good 
workspace 
KIOSK TERMINALS: 
Users felt these prevented 
access to information and 
didn’t use them 
• Less front-loading of 
information and ensuring we 
repeat key access messages 
• More joined-up dissemination of 
information with other depts 
• More desks and desk space 
needed. Cushions purchased 
(see next slide). 
• Recognition of two tribes – 
‘upstairs’ and ‘downstairs’ 
people with different needs 
• Accepted they were not working 
as we anticipated and removed 
them in favour of full PCs 
https://www.flickr.com/photos/96dpi/3906387641/
Photo: Ange Fitzpatrick
~ 3 ~ 
Cognitive 
Mapping
Subjects were 
invited to draw a 
map of their 
research and 
learning landscape 
– sharing where 
and how they 
work 
N.B. 1 
Most library use happens 
outside the library 
N.B.2 
Ethnography often 
‘follows the user home’ 
for a fuller picture of 
experience 
https://www.flickr.com/photos/wrachele/8367457082
Example faculty map
Example student map
Key findings / impact 
LIBRARIES: 
Faculty members did not use 
physical library / student 
used many for different 
purposes 
BEDROOMS: 
All subjects drew bedrooms 
as key study areas 
OVERALL LANDSCAPE: 
Most subjects are regularly on 
the move and using a variety 
of research environments 
offering varying degrees of 
concentration/distraction 
• Faculty members need more 
assistance with productive 
working methods – mobile tech, 
cloud computing, time 
management tools. We intend to 
offer more 1-2-1s/support in 
these areas 
• Recognising that for this 
particular group of students our 
library service is only part of the 
picture – stop selling ourselves 
as a ‘one-stop shop’ 
• The variety of places from which 
subjects accessed our resources 
underlines how vital it is that we 
offer our services remotely and 
seamlessly 
https://www.flickr.com/photos/96dpi/3906387641/
Today’s library services are so complex, accessed in many 
different ways and from many different places, that we must 
adopt ethnography to reveal the full story of user experience 
https://www.flickr.com/photos/marcwathieu/2566147235
Further information 
More info 
https://www.flickr.com/photos/mayoral/13848318454
The definitive 
ethnography 
handbook by Nancy 
Fried-Foster and 
Susan Gibbons 
(available as a free 
PDF from 
www.ala.org)
Dr Donna Lanclos, 
anthropologist and library 
ethnographer at the J. 
Murrey Atkins Library at 
University of North 
Carolina, Charlotte 
Blogs at: 
www.donnalanclos.com 
(@donnalanclos) 
Co-devised 
‘Visitors & Residents’ in 
place of ‘Digital Natives’ 
Right: Donna’s library sleep map
A UK blog 
exploring 
ethnography 
and user 
experience 
in libraries 
(run by 
myself, 
Georgina 
Cronin & 
Meg 
Westbury)
The new open 
access peer-reviewed 
journal of 
library user 
experience 
www.weaveux.org 
@WeaveUX
UX in libraries - conference 
‘UX in Libraries’ book 
by Andy Priestner & Matt Borg 
Summer 2015
Ethnography 
for impact 
a new way of exploring 
user experience 
in libraries 
__________________ 
Andy Priestner 
(@PriestLib) 
https://www.flickr.com/photos/chasblackman/8502151556/

Ethnography for impact: a new way of exploring user experience in libraries

  • 1.
    Ethnography for impact a new way of exploring user experience in libraries __________________ Andy Priestner (@PriestLib) https://www.flickr.com/photos/chasblackman/8502151556/
  • 2.
    Judge Business School,University of Cambridge - one of the top business schools in Europe - very high-fee paying students (MBAs – 40k per annum) - students consistently rate our library service as excellent But I KNOW its not perfect, and until recently I really didn’t know enough about the library experience of our users… https://www.flickr.com/photos/mark_ch/5447151529
  • 3.
    I, like mostlibrarians, was more used to – and more comfortable with – sending out annual surveys, and chiefly recording quantitative facts My only qualitative approaches were comment boxes and, very occasional, focus groups and usability studies https://www.flickr.com/photos/64763706@N08/6850650385
  • 4.
    As a result... • too much of my service data was only coming from those people who filled in the library survey • I was using too many closed or leading questions • and routinely interpreting increases and decreases ‘blind’ rather than researching further • largely ignoring qualitative feedback as it was ‘difficult’ • and when the comments boxes were left empty, as they so often are, I was not following up to find out more • and I knew full well that self-reporting is largely unreliable and skewed ...so what was the answer? https://www.flickr.com/photos/rsms/1479448133/
  • 5.
    Ethnography a wayof studying cultures through observation, participation and qualitative techniques https://www.flickr.com/photos/collin_key/6080864794/
  • 6.
    Conjured up theimage of a white man ‘going native’ in the South Pacific Ethnography - Malinowksi Credit: London School of Economics
  • 7.
    ‘The final goalis to grasp the native’s point of view, his relation to life, to realise his vision of the world’ (Malinowski – founding father of ethnography, 1925) Ethnography - Malinowksi Credit: London School of Economics
  • 8.
    https://www.flickr.com/photos/arthurjohnpicton/4387576057 ‘The finalgoal is to grasp the user’s point of view, their relation to life, to realise their vision of the world’ Change just one word and highly relevant to libraries…
  • 9.
    Ethnography • Interestin context and culture • Explores personal and social • More holistic • Less structured • More detailed • Immersive • Breaks down preconceptions • Time-consuming • Embraces complexity And offers a more complete picture (but I’m not saying ditch the quantitative data) www.flickr.com/photos/droetker0912/5542920908
  • 10.
    Once I’d decidedto engage in ethnographic research: revised a post within my library service to incorporate this activity. Renamed as ‘UX Librarian’ as concerned with exploring and improving all aspects of User Experience (UX) (I advocate a broader definition of UX - not just about websites and usability) https://www.flickr.com/photos/mollystevens/5179946914/
  • 11.
    Some ethnographic techniques • Behavioural Mapping • Cognitive Mapping • Diary Studies • Usability Studies • Focus Groups • Affinity Diagramming • Card Sorting • Directed Storytelling • Touchstone Tours • Love- break-up-letter • Graffiti Walls • Personas https://www.flickr.com/photos/st3f4n/4046427260
  • 12.
    3 Ethnographic ResearchProjects @ Judge Business School
  • 13.
    ~ 1 ~ Behavioural Mapping
  • 14.
    Observing use ofthe Information Centre and mapping the results Behavioural mapping (Our UX Librarian - Georgina Cronin) Photo: Andy Priestner
  • 15.
    The study (undertakenin a series of hour-long observation sessions) involved: mapping routes; volume of traffic; duration of stay; activities undertaken; interaction between users; choice of desks; staff assistance, food and drink consumed (we allow both); devices used; databases used; use of self-service.
  • 16.
    As well asrecording movement and activities on a map, information was recorded in a narrative log and colour-coded for later affinity sorting. Photo: Andy Priestner
  • 17.
    A visual representationof all the maps combined clearly shows the most popular route through the Information Centre, known as a ‘desire line’
  • 18.
    Desire lines are everywhere, but you might not have known that this is what they are formally called https://www.flickr.com/photos/peterme/14037066/
  • 19.
    Key findings /impact TRAFFIC: Most users use the ground floor in order to walk straight up to the first floor NOISE: Users are quieter the fuller the space is, and more irritated by noise ACTIVITY: Huge variety in duration of stay (some very long stays) and in print / digital use • Re-siting our display screens so they are seen by more people • Opening up our first floor entrance for direct access • Sending staff print jobs elsewhere during busy periods • Reducing staff noise (conducting 1-2-1s elsewhere, closing office door) • Adjusting door springs • Ensuring space redesign does not assume device-only culture. • Offering more comfortable furniture https://www.flickr.com/photos/96dpi/3906387641/
  • 20.
    ~ 2 ~ Show-me -round
  • 21.
    Students guide usaround the Information Centre space and explain the choices they make, what they like and dislike - recorded for later analysis Photo: Georgina Cronin
  • 22.
    Key findings /impact WORKAROUNDS: Users are failing to access key services (WIFI, printing, databases) and invent time consuming workarounds WORKSPACES: Very definite ideas about what makes a good workspace KIOSK TERMINALS: Users felt these prevented access to information and didn’t use them • Less front-loading of information and ensuring we repeat key access messages • More joined-up dissemination of information with other depts • More desks and desk space needed. Cushions purchased (see next slide). • Recognition of two tribes – ‘upstairs’ and ‘downstairs’ people with different needs • Accepted they were not working as we anticipated and removed them in favour of full PCs https://www.flickr.com/photos/96dpi/3906387641/
  • 23.
  • 24.
    ~ 3 ~ Cognitive Mapping
  • 25.
    Subjects were invitedto draw a map of their research and learning landscape – sharing where and how they work N.B. 1 Most library use happens outside the library N.B.2 Ethnography often ‘follows the user home’ for a fuller picture of experience https://www.flickr.com/photos/wrachele/8367457082
  • 26.
  • 27.
  • 28.
    Key findings /impact LIBRARIES: Faculty members did not use physical library / student used many for different purposes BEDROOMS: All subjects drew bedrooms as key study areas OVERALL LANDSCAPE: Most subjects are regularly on the move and using a variety of research environments offering varying degrees of concentration/distraction • Faculty members need more assistance with productive working methods – mobile tech, cloud computing, time management tools. We intend to offer more 1-2-1s/support in these areas • Recognising that for this particular group of students our library service is only part of the picture – stop selling ourselves as a ‘one-stop shop’ • The variety of places from which subjects accessed our resources underlines how vital it is that we offer our services remotely and seamlessly https://www.flickr.com/photos/96dpi/3906387641/
  • 29.
    Today’s library servicesare so complex, accessed in many different ways and from many different places, that we must adopt ethnography to reveal the full story of user experience https://www.flickr.com/photos/marcwathieu/2566147235
  • 30.
    Further information Moreinfo https://www.flickr.com/photos/mayoral/13848318454
  • 31.
    The definitive ethnography handbook by Nancy Fried-Foster and Susan Gibbons (available as a free PDF from www.ala.org)
  • 32.
    Dr Donna Lanclos, anthropologist and library ethnographer at the J. Murrey Atkins Library at University of North Carolina, Charlotte Blogs at: www.donnalanclos.com (@donnalanclos) Co-devised ‘Visitors & Residents’ in place of ‘Digital Natives’ Right: Donna’s library sleep map
  • 33.
    A UK blog exploring ethnography and user experience in libraries (run by myself, Georgina Cronin & Meg Westbury)
  • 34.
    The new open access peer-reviewed journal of library user experience www.weaveux.org @WeaveUX
  • 35.
    UX in libraries- conference ‘UX in Libraries’ book by Andy Priestner & Matt Borg Summer 2015
  • 36.
    Ethnography for impact a new way of exploring user experience in libraries __________________ Andy Priestner (@PriestLib) https://www.flickr.com/photos/chasblackman/8502151556/