Download to read offline

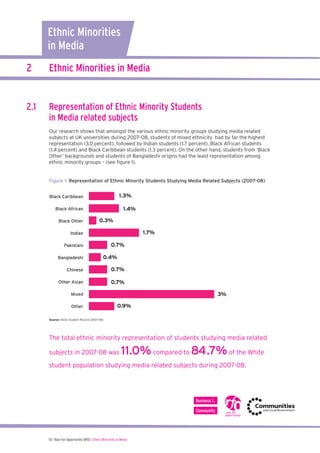
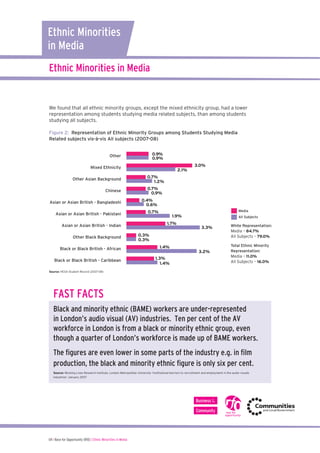
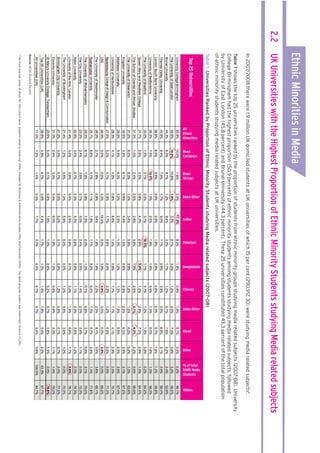
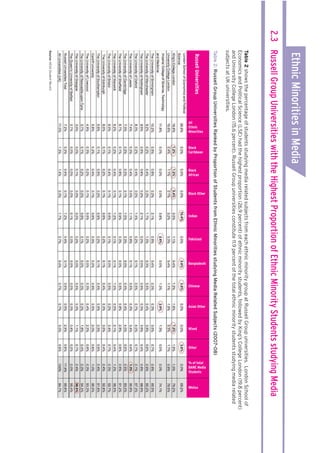

This document summarizes research on ethnic minority representation in media-related university subjects and careers in the UK. Some key points: - Students of mixed ethnicity had the highest representation (3%) in media-related university subjects, followed by Indian (1.7%) and Black African (1.4%) students. Representation was lowest for Black Other and Bangladeshi students. - Overall ethnic minority representation in media subjects was 11%, lower than the 16% representation across all university subjects. - Universities with the highest proportions of ethnic minority media students included University College Birmingham (50.9%) and University of East London (45.8%). - Among Russell Group universities, the London School of Economics


![Undergraduate media degrees in uk universities [autosaved]](https://cdn.slidesharecdn.com/ss_thumbnails/undergraduatemediadegreesinukuniversitiesautosaved-180420221856-thumbnail.jpg?width=640&height=640&fit=bounds)


