Estimated spectral overlap between Opal fluors with Chroma filter sets_JDC.pdf
•
0 likes•76 views

This report estimates the expected fluorescence overlap between Opal fluorophores when using the designated fluorescence filter sets in fluorescence microscopy applications. These are rough estimates only, based on fluorescence spectra of the Opal fluors and these specific Chroma filter sets. Variables such as light sources and the influence of sample chemistry on fluorescence ex. & emission spectra will affect the spectral overlap observed in real samples.

Recommended
Recommended
More Related Content
Recently uploaded
Recently uploaded (20)
Featured
Featured (20)
Estimated spectral overlap between Opal fluors with Chroma filter sets_JDC.pdf
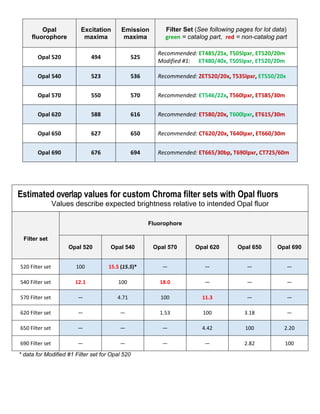
- 1. Opal fluorophore Excitation maxima Emission maxima Filter Set (See following pages for lot data) green = catalog part, red = non-catalog part Opal 520 494 525 Recommended: ET485/25x, T505lpxr, ET520/20m Modified #1: ET480/40x, T505lpxr, ET520/20m Opal 540 523 536 Recommended: ZET520/20x, T535lpxr, ET550/20x Opal 570 550 570 Recommended: ET546/22x, T560lpxr, ET585/30m Opal 620 588 616 Recommended: ET580/20x, T600lpxr, ET615/30m Opal 650 627 650 Recommended: CT620/20x, T640lpxr, ET660/30m Opal 690 676 694 Recommended: ET665/30bp, T690lpxr, CT725/60m * data for Modified #1 Filter set for Opal 520 Estimated overlap values for custom Chroma filter sets with Opal fluors Values describe expected brightness relative to intended Opal fluor Fluorophore Filter set Opal 520 Opal 540 Opal 570 Opal 620 Opal 650 Opal 690 520 Filter set 100 15.5 (15.5)* — — — — 540 Filter set 12.1 100 18.0 — — — 570 Filter set — 4.71 100 11.3 — — 620 Filter set — — 1.53 100 3.18 — 650 Filter set — — — 4.42 100 2.20 690 Filter set — — — — 2.82 100
- 2. The data in the table above are my estimates of expected fluorescence overlap when using the custom Chroma filter sets with the six listed Opal fluorophores (fluors). All supporting spectral data and calculations are in the following pages. Overlap values >10% are indicated in red. I do not have access to authentic Opal fluor spectra. All fluorescence ex. & em. spectra are proxies. Care was used to choose existing fluorescent spectra proxies for each Opal fluor by matching the shape of spectra in published excitation and emission graphs. The FWHM, excitation maxima & emission maxima of these spectra were then adjusted to match that of the published Opal fluor data. Differences are minimal and resulting spectra should provide reasonably accurate estimates. However, these are estimates, and actual values may vary significantly depending on several factors such as: brightness of each Opal fluor relative to others abundance/concentration of each Opal fluor relative to others variation of illumination intensity across the spectral range of an excitation filter passband amount and spectral variation of tissue autofluorescence spectral variation of fluorescence ex. & emission spectra due to pH, local chemistry, etc. Values were obtained by plotting the integrals of an ex. or em. filter passband with the appropriate ex. or em. fluorescence spectra and quantifying this “area under the curve”. For example, one finds the integral of the excitation filter intended for use with Opal 540 and the fluorescence excitation spectra of Opal 540. Then one finds the integral of the emission filter intended for Opal 540 and its associated fluorescence emission spectra. These are expressed in dimensionless units. Next, these two values are multiplied to calculate the estimated "brightness" (or specific fluorescence signal intensity) of a given filter with a given fluor. To calculate overlap, one multiplies the excitation crosstalk and emisson bleedthrough integrals of "contaminating" fluors with a given filter set's spectra, and divides this resulting estimated brightness by that of the similarly calculated brightness of the intended fluor. So, dividing the Opal 520 brightness obtained with the 540 filter set by the Opal 540 brightness obtained with the same set will provide the estimate of the relative overlap of Opal 520 signal into the Opal 540 imaging channel, keeping in mind the above, bulleted caveats. Values assume a uniform white light source across a given excitation passband. In reality, intensity varies somewhat across the spectrum of all light sources, especially arc lamps. Often, the variation is negligible over a 20-40nm region typical of these passbands. LED light sources with integrated excitation filters could potentially result in very different values. The Modified #1 Opal 520 Filter set is intended for use with a Zeiss Colibri LED light source. Because of the discontinuous nature of the illumination provided by the two relevant LEDs and their dedicated excitation filters, an excitation filter with a wider passband is used in the modified set. This is an estimate, and does not take into consideration the gap between the two dedicated excitation filters, which is not expected to skew the data in one direction.
- 3. 1. Opal 520 Filter set with Opal 520 & estimated Opal 540 overlap Spectra of Opal 520 filter set with Opal 520 Spectra of Opal 520 filter set with Opal 520 (blue) & 540 (green)
- 4. Integrals of Opal 520 filter set with Opal 520 (black) & 540 (red) spectra a. Estimated fluorescence intensity calculations with Opal 520 filter set 1. Opal 520 set with Opal 520 ET485-25x_X_Opal520_EX = 1846.799 ET520-20m_X_Opal520_EM = 1657.313 1846.799 * 1657.313 = 3,060,724 2. Opal 520 set with Opal 540 ET485-25x_X_Opal540_EX = 641.678 ET520-20m_X_Opal540_EM = 739.438 641.678 * 739.438 = 474,481 b. Estimated overlap of Opal 540 into Opal 520 filter set expressed as fraction of Opal 520 signal 1. Opal 540 signal intensity/Opal 520 signal intensity 474,481/3,060,724 = 15.5%
- 5. 2. Opal 520 Modified #1 Filter set with Opal 520 & estimated Opal 540 overlap Spectra of Opal 520 filter set with Opal 520 Spectra of Opal 520 filter set with Opal 520 (blue) & 540 (green)
- 6. Integrals of Opal 520 filter set with Opal 520 (black) & 540 (red) spectra c. Estimated fluorescence intensity calculations with Modified #1 Opal 520 filter set 3. Modified #1 Opal 520 set with Opal 520 ET480-40x_X_Opal520_EX = 2526.081 ET520-20m_X_Opal520_EM = 1657.313 2526.081 * 1657.313 = 4,186,507 4. Modified #1 Opal 520 set with Opal 540 ET480-40x_X_Opal540_EX = 875.408 ET520-20m_X_Opal540_EM = 739.447 875.408 * 739.447 = 647,318 ci. Estimated overlap of Opal 540 into Modified #1 Opal 520 filter set expressed as fraction of Opal 520 signal 2. Opal 540 signal intensity/Opal 520 signal intensity 647,318/4,186,507 = 15.5%
- 7. 3. Opal 540 Filter set with Opal 540 & estimated Opal 520 & 570 overlap Spectra of Opal 540 filter set with Opal 540 Spectra of Opal 540 filter set with Opal 540 (green) & 520 (blue) & 570 (red)
- 8. Integrals of Opal 540 filter set with Opal 540 (black) & 520 (blue) spectra Integrals of Opal 540 filter set with Opal 540 (black) & 570 (red) spectra
- 9. a. Estimated fluorescence intensity calculations with Opal 540 filter set 1. Opal 540 set with Opal 540 ZET520-20x_X_Opal540_EX = 1676.235 ET550-20x_X_Opal540_EM = 1237.60 1676.235 * 1237.605 = 2,074,517 2. Opal 540 set with Opal 520 ZET520-20x_X_Opal520_EX = 267.952 ET550-20x_X_Opal520_EM = 934.952 267.952 * 934.952 = 250,522 3. Opal 540 set with Opal 570 ZET520-20x_X_Opal570_EX = 994.071 ET550-20x_X_Opal570_EM = 375.881 994.071 * 375.881 = 373,652 b. Estimated bleedthrough of Opal 520 into Opal 540 filter set expressed as fraction of Opal 540 signal 1. Opal 520 signal intensity/Opal 540 signal intensity 250,522/2,074,517 = 12.1% c. Estimated bleedthrough of Opal 570 into Opal 540 filter set expressed as fraction of Opal 540 signal 1. Opal 690 signal intensity/Opal 650 signal intensity 373,652/2,074,517 = 18.0%
- 10. 4. Opal 570 Filter set with Opal 570 & estimated Opal 540 & 620 overlap Spectra of Opal 570 filter set with Opal 570 Spectra of Opal 570 filter set with Opal 540 (green) & 570 (blue) & 620 (red)
- 11. Integrals of Opal 570 filter set with Opal 570 (black) & 540 (green) spectra Integrals of Opal 570 filter set with Opal 570 (black) & 620 (purple) spectra
- 12. a. Estimated fluorescence intensity calculations with Opal 570 filter set 1. Opal 570 set with Opal 570 ET546-22x_X_Opal570_EX = 1788.68 ET585-30m_X_Opal570_EM= 1937.907 1788.68 * 1937.907 = 3,466,295 2. Opal 570 set with Opal 540 ET546-22x_X_Opal540_EX = 272.647 ET585-30m_X_Opal540_EM = 598.914 272.647 * 598.914 = 163,292 3. Opal 570 set with Opal 620 ET546-22x_X_Opal620_EX = 672.421 ET585-30m_X_Opal620_EM = 581.637 672.421 * 581.637 = 391,105 b. Estimated bleedthrough of Opal 540 into Opal 570 filter set expressed as fraction of Opal 570 signal 1. Opal 540 signal intensity/Opal 570 signal intensity 163,292/3,466,295 = 4.71% c. Estimated bleedthrough of Opal 620 into Opal 570 filter set expressed as fraction of Opal 570 signal 1. Opal 620 signal intensity/Opal 570 signal intensity 391,105/3,466,295 = 11.3%
- 13. 5. Opal 620 Filter set with Opal 620 & estimated Opal 570 & 650 overlap Spectra of Opal 620 filter set with Opal 620 Spectra of Opal 620 filter set with Opal 620 (blue) & 570 (red) & 650 (green)
- 14. Integrals of Opal 620 filter set with Opal 620 (black) & 650 (red) spectra Integrals of Opal 620 filter set with Opal 620 (black) & 570 (green) spectra
- 15. a. Estimated fluorescence intensity calculations with Opal 620 filter set 1. Opal 620 set with Opal 620 ET580-20x_X_Opal620_EX = 1601.33 ET615-30m_X_Opal620_EM = 2666.805 1601.33 * 2666.805 = 4,270,435 2. Opal 620 set with Opal 650 ET580-20x_X_Opal650_EX = 540.75 ET615-30m_X_Opal650_EM = 250.784 540.75 * 250.784 = 135,611 3. Opal 620 set with Opal 570 ET580-20x _X_Opal570_EX = 86.18 ET615-30m_X_Opal570_EM = 759.733 86.18 * 759.733 = 65,474 b. Estimated overlap of Opal 650 into Opal 620 filter set expressed as fraction of Opal 620 signal 1. Opal 650 signal intensity/Opal 620 signal intensity 135,611/4,270,435 = 3.18% c. Estimated overlap of Opal 570 into Opal 620 filter set expressed as fraction of Opal 620 signal 1. Opal 650 signal intensity/Opal 620 signal intensity 65,474/4,270,435 = 1.53%
- 16. 6. Opal 650 Filter set with Opal 650 & estimated Opal 620 & 690 overlap Spectra of Opal 650 filter set with Opal 650 Spectra of Opal 650 filter set with Opal 650 (green) & 620 (blue) & 690 (red)
- 17. Integrals of Opal 650 filter set with Opal 650 (black) & 620 (blue) spectra Integrals of Opal 650 filter set with Opal 650 (black) & 690 (red) spectra
- 18. a. Estimated fluorescence intensity calculations with Opal 650 filter set 1. Opal 650 set with Opal 650 CT620-20x_X_Opal650_EX = 1701.678 ET660-30m_X_Opal650_EM = 2416.943 1701.678 * 2416.943 = 4,112,859 2. Opal 650 set with Opal 620 CT620-20x_X_Opal620_EX = 176.534 ET660-30m_X_Opal620_EM = 1029.187 176.534 * 1029.187 = 181,686 3. Opal 650 set with Opal 690 CT620-20x_X_Opal690_EX = 534.942 ET660-30m_X_Opal690_EM = 168.792 534.942 * 168.792 = 90,294 b. Estimated bleedthrough of Opal 620 into Opal 650 filter set expressed as fraction of Opal 650 signal 1. Opal 620 signal intensity/Opal 650 signal intensity 181,686/4,112,859 = 4.42% c. Estimated bleedthrough of Opal 690 into Opal 650 filter set expressed as fraction of Opal 650 signal 1. Opal 690 signal intensity/Opal 650 signal intensity 90,294/4,112,859 = 2.20%
- 19. 7. Opal 690 Filter set with Opal 690 & estimated Opal 650 overlap Spectra of Opal 690 filter set with Opal 690 Spectra of Opal 690 filter set with Opal 690 (red) & 650 (green)
- 20. Integrals of Opal 690 filter set with Opal 690 (black) & 650 (green) spectra a. Estimated fluorescence intensity calculations with Opal 690 filter set 1. Opal 690 set with Opal 690 ET665-30bp_X_Opal690_EX = 2233.772 CT725-60m_X_Opal690_EM= 2849.773 2233.772 * 2849.773 = 6,365,743 2. Opal 690 set with Opal 650 ET665-30bp_X_Opal650_EX = 243.787 CT725-60m_X_Opal650_EM= 736.052 243.787 * 736.052 = 179,439 b. Estimated overlap of Opal 650 into Opal 690 filter set expressed as fraction of Opal 690 signal 1. Opal 650 signal intensity/Opal 620 signal intensity 179,439/6,365,743 = 2.82%